Visualising Business Data: A Survey


Visual and Interactive Computing Group, Swansea University, Swansea SA2 8PP, UK
*
Author to whom correspondence should be addressed.
Information 2018, 9(11), 285; https://doi.org/10.3390/info9110285
Submission received: 25 September 2018
/
Revised: 30 October 2018
/
Accepted: 9 November 2018
/
Published: 17 November 2018
(This article belongs to the Section Information Theory and Methodology)
Abstract
:A rapidly increasing number of businesses rely on visualisation solutions for their data management challenges. This demand stems from an industry-wide shift towards data-driven approaches to decision making and problem-solving. However, there is an overwhelming mass of heterogeneous data collected as a result. The analysis of these data become a critical and challenging part of the business process. Employing visual analysis increases data comprehension thus enabling a wider range of users to interpret the underlying behaviour, as opposed to skilled but expensive data analysts. Widening the reach to an audience with a broader range of backgrounds creates new opportunities for decision making, problem-solving, trend identification, and creative thinking. In this survey, we identify trends in business visualisation and visual analytic literature where visualisation is used to address data challenges and identify areas in which industries use visual design to develop their understanding of the business environment. Our novel classification of literature includes the topics of businesses intelligence, business ecosystem, customer-centric. This survey provides a valuable overview and insight into the business visualisation literature with a novel classification that highlights both mature and less developed research directions.
1. Introduction and Motivation
As businesses make the transition to digital solutions, they become overwhelmed by the volume of data they collect. The continued evolution of improved hardware propagates a cycle of collecting larger quantities of data at a lower cost. Despite the investment made to collect data, it still only accounts for a fraction of the process required for useful output. Interpretation of data is vital to unlock the potential value held within and to make the most informed decisions. Companies often employ teams of data analysts to achieve this. However, this can be very costly. In addition to the cost, it also limits the number of people who may understand or access the analysis. Employing visualisation approaches enables employees with a wide range of backgrounds to view and understand it [1]. Opening the analysis to a wider audience encourages ideas and provokes discussion about the nature of the behaviour under investigation [2]. This broadening of the audience highlights a unique benefit that data visualisation and visual analytics can offer.
Visualisation and visual analytics have the capability to overcome the challenges associated with large datasets ([3] p. 56) and multidimensional relationships [4]. In business, the holistic nature of “big picture” approaches is valuable [5], providing a complete overview of a scenario or situation. Pairing this requirement of large-scale data analytics with the capabilities of data visualisation produces fruitful and thought-provoking output.
The body of business visualisation literature is growing rapidly. During the IEEE VIS 2014 conference, a workshop entitled “Business” focused on the conversion of business data into meaningful visual insight which aids in better decision making [6]. The workshop was so popular that a second workshop was held during the IEEE VIS 2015 conference entitled “From Data to Actionable Business Insights” [7]. In addition to these workshops, Computer Graphics and Applications published a special issue entitled “Business Intelligence Analytics” [8,9].
The challenges associated with the transition to data visualisation are typically related to skill set, data scale, and ease of interpretation. Traditional visual design such as simple bar charts and line plots are often unable to accommodate the scale and complexity of data. Many off-the-shelf software packages are created to address business visualisation requirements [10,11] but often require specialised training to use or are incapable of conveying proprietary data a company generates. To overcome these challenges, custom software can be developed to directly address the challenges and reduce the training necessary to use it. According to a study by Gartner, the “Visualization and Data Discovery” market segment is the fastest growing area of Business Intelligence [12]. Inspired by our collaboration with industry, we collected literature that addresses the challenges associated with visualising business data with the aim of understanding the processes involved and maximising business output. Our contributions include:
- The first Business Visualisation survey of its kind to our knowledge;
- An overview and classification of 70 published visualisation business papers;
- A novel categorisation of Business Visualisation literature supported by related literature sources;
- A reference for businesses looking to explore their datasets with visualisation; and
- The identification of both mature and immature research directions in this rapidly evolving field.
Although the relationship between academic research and business is often complicated due to conflicts in interests and goals ([1,13] p. 63), this survey shows that the two are not only compatible but have a vast potential for growth in their respective fields.
This paper can act as a reference for businesses wishing to explore their own data through visualisation. Utilising both the primary and secondary classifications used in this paper, the reader can find previously published visualisation research that explores data similar to their own.
1.1. Literature Classification
To develop a classification, we looked for predominant and recurring themes in the visualisation and visual analysis literature. Firstly, we selected papers that focus on the visualisation of business data designed for a practical business application. We then divided the papers into three primary categories. The top-level categories we used to classify the publications are:
- Business Intelligence
- Business Ecosystem
- Customer Centric
See Figure 1 and Table 1 and Table 5 for an overview of the literature in these categories. Section 1.2 presents the inspiration behind this classification.
1.1.1. Business Intelligence (BI)
“The main task of business intelligence (BI) is providing decision support for business activities based on empirical information.”—Grossman [15]
Papers that fall in this category aim to provide a visual design that improves the understanding of a business’ internal or external environment. The emphasis is that the resulting visual system is created for the use of a single business as opposed to a whole economy or ecosystem. In the “Business Intelligence Guidebook”, Sherman states that BI turns data into “actionable” information [16]. It is this output that businesses strive for through whatever means are available to them. BI is seen as both a process as well as a saleable product [17]. We identify two subcategories in this section: Internal Intelligence and External Intelligence.
Internal Intelligence (II)
Internal Intelligence involves the knowledge of internal business processes. Papers in this category often aim to improve business process efficiency or gain a better understanding of the internal structure of the company. This perspective is inward facing. For example, Kandel et al. explored the role that visualisation plays in day-to-day business operations [18]. The focus is placed on a company’s internal operations.
External Intelligence (EI)
External intelligence examines the business ecosystem from the perspective of a single business. The focus is often placed on the business competitors to aid in competitive development or in identifying business operations out of the businesses control. This perspective is outward facing. For example, Hao et al. used visualisation to explore fraud detection data in the banking industry [19].
1.1.2. Business Ecosystem (BE)
A Business Ecosystem is defined as:
“An economic community supported by a foundation of interacting organisations and individuals—the organisms of the business world. The economic community produces goods and services of value to customers, who are themselves members of the ecosystem. The member organisms also include suppliers, lead producers, competitors, and other stakeholders.”—Moore [86]
To further understand the definition, Rothschild stated:
“A capitalist economy can best be comprehended as a living ecosystem. Key phenomena observed in nature—competition, specialisation, co-operation, exploitation, learning, growth, and several others are also central to business life.”—Rothschild [87]
This topic encompasses research that focuses on an economic community. The literature here differs from business intelligence as the research aims to understand an economy from an external perspective instead of through the eyes of an individual business. The focus is on business networks and their surrounding environments. For example, Basole et al. presented an overview of the telecommunications industry using an in-house visualisation tool called dotlink360 [76].
1.1.3. Customer Centric (CC)
Customer-centric literature focuses on visualising customer data. Businesses are moving towards a customer focused method of operating [88]. This focus ensures that the customers’ interests are seen as the highest priority and therefore benefits the business through customer loyalty and superior product development. There are two sub-categories in this classification based on customer feedback and customer behaviour.
Customer Behaviour (CB)
The Customer Behaviour sub-category examines potential customers and identifies patterns in their behaviour so that their actions may either be predicted or utilised to sell a product or service more effectively. The scope of behaviour is broad. Geospatial information can be used to inform the physical movement of people, online tracking data can be used to optimise website sale processes, and customer segmentation information can be used to estimate the future behaviour of customers. For example, Yaeli et al. visualised the movements of customers through physical retail stores using GPS tracking data [21]. This customer path dependency falls into the customer behaviour category.
Customer Feedback (CF)
Customer Feedback research focuses on customers who have used a product/service and have provided feedback through any medium. Often surveys are used, and sentiment analysis is performed on the data to examine the feedback. In other scenarios, direct customer feedback is used (i.e., interviews). This feedback is highly important to customer-focused businesses because it enables vital insight into the reception of a product or service. For example, Oelke et al. presented a visual analysis of web scraped customer feedback data from multiple online sources [40].
1.1.4. Business Finance
The topic of financial data visualisation could be included in this survey. However, this topic is covered fully in the EuroVis 2016 STAR paper by Ko et al. [14]. We briefly summarise the survey in Section 2. Additionally, Rodriguez and Kaczmarek published a “Visualising Financial Data” textbook [89]. As such, it is not the focus of our survey. In addition, joining both a business and financial visualisation survey would be too large.
In addition to the primary classification, we have created a second-level classification that is outlined in Section 1.3.
1.2. Justification of Classification: Turning Data into Profit
The original inspiration motivating this classification came from our research into why businesses collect data and what they do with it. In short, they do so to maximise profit. Our taxonomy encompasses the core platforms by which businesses derive profit. A 2016 Gartner study identifies the key areas a digital enterprise can support business [90] which includes placing value on: data analysis and information systems for decision making (business intelligence), customer-focused analysis and ecosystem analysis. In addition to these, the report also identifies an IoT platform as valuable, however, IoT is beyond the scope of this survey. Therefore, we have chosen these facets as the basis for our top-level classification. A complete business taxonomy does not exist in a form that would be useful to this survey, and so we have developed this taxonomy from an existing business sources and from the research found within the literature search. We found that the research fell into these categories due to reoccurring themes. The significance of the taxonomy facets is still thoroughly established in the academic business world.
Increasingly, businesses are striving to utilise their valuable resource—data [91]. Bean presented an article in the Harvard Business Review highlights a decrease in expenditure as the ultimate goal of data analytics [92], with the objectives of increasing revenue, product innovation, and operational efficiency (business intelligence). Bean stated that businesses are now looking to find new ways to innovate with data to extract previously untapped value. We propose that these new methods of innovation can be achieved through the creation of visual designs that depict the data decision making.
From this, we can see that business intelligence is a crucial facet to the success of a data-driven business [93]. McAfee highlighted the managerial benefits of data analytics—stating “You can’t manage what you don’t measure” [91], advocating the creation of intelligence through data as an integral part of business operations. Grossmann wrote at length about the potential value of utilising business data for the purposes of business intelligence [15]. The book entitled “Fundamentals of Business Intelligence” presents an overview of business data types and visual designs of the data to exemplify it. The data types consist of reporting and process data (business intelligence) and customer data.
Buluswar interviewed six senior leaders from major businesses, asking how they utilise their data [94]. A strong theme emerged highlighting the importance of business intelligence but also of consumer centred analysis, focusing on what serves the customer best—looking at their experience with the product and exploring how to align the business with customer expectations. Many books have been published that discuss how to collect and data-mine customer centred business data so that it can be used for business development purposes [95,96,97].
The business ecosystem was identified by the Gartner report [90] as a critical facet of a businesses knowledge. Moore described the practical benefits of embracing the ecosystem centred view:
“A business ecosystem can also be conceived as a network of interdependent niches that in turn are occupied organisations. These niches can be said to be more or less open, to the degree to which they embrace alternative contributors. One of the most exciting ideas in business today is that business ecosystems can be “opened up” to the entire world of potential contributions and creative participants.”—Moore [98]
1.3. Data Classification
Our secondary level of classification is based on the origin of the data used in each paper. The data source list can be seen in Table 1. Each paper is assigned a type of data source.
We break the data sources down into primary and secondary. Primary data can be defined as “Original data collected by the visualisation researchers for a specific research goal”. Secondary data can be defined as “Data originally collected for a different purpose and reused for another research question” [99]. We also include one sub-classification of web-scraped data that is a hybrid of both primary and secondary.
To illustrate these two, we present a data collection pipeline for visualisation in Figure 2. We use the term “A Priori” to describe the visualisation hypothesis that is formulated before the data is collected. If the initial data are collected after the visualisation hypothesis, then we refer to this as an “A Priori Hypothesis”.
Primary:
In this category, we include:
- Intentional, Active Digital Collection
- Intentional, Active Research Study Data
The first primary data source is the collection of data for the explicit purpose of the visualisation research featured in this survey. For example, Otsuka et al. collected data through electronic name tags worn by members of staff that identify and record interactions between the staff. These data are then used to visualise the inter-office relationships [20].
Study data are collected to support an a priori hypothesis first hand through interviews, questionnaires, and reviews. The most popular use of study data in this survey lies in the internal intelligence classification. These data are typically collected as part of the visualisation research. For example, Kandel et al. presented an interview study with data visualisation analysts working with industry to characterise the process of industrial data analysis [18].
Secondary:
Secondary data sources are not collated by those performing the visualisation research featured in this survey. Here, the researchers pose a hypothesis a posteriori, i.e., after the initial data collection. Researchers use the pre-existing data to explore and perform the analysis. In this category, we include:
- A Priori Databases
- Business Processes
- Business By-product
Pre-existing databases are often used as a case study to demonstrate new visualisation techniques. They are databases that are created for the purpose of previous analysis, and not for the visualisation research in which it is currently used. Roberts et al. used a pre-existing database for their treemap-based research on call centre data, provided by their industry partner [51].
Business process visualisation refers to the graphical representation of the operational procedures implemented within a company. For example, Broeksema et al. presented a visualisation system for business decision management and the processes behind these decisions [71].
The data by-product of a business is similar to pre-existing databases except that the data is collected as a by-product of business operations. These databases are often in the form of financial records, or Point of Sale (PoS) transactions. For example, Keim et al. presented a novel approach to bar chart designs using transactions data [80]. The business by-product differentiates from the pre-existing database as data collected as a by-product will be part of a continuous generation and collection, regardless of who uses it.
Hybrid:
We classify web scraping data as a hybrid of both primary and secondary data. Although the data are originally gathered for a different purpose other than visualisation (Secondary), the collation of a new, structured dataset is performed after a hypothesis for visualisation is posed (Primary). This leads to our creation of the hybrid primary/secondary classification. It is often used in the field of customer feedback (see Figure 1) and often involves social media data. The data are downloaded from various online sources into an archive that can be used for research purposes. For example, Hao et al. presented a visual sentiment analysis of customer feedback streams through the scraping of Twitter data [42].
Web-scraped data are differentiated from a digital collection due to the process by which the data is obtained. Web scraped data utilise and collate online sources of information into one structured dataset. The real-world, digital collection of data utilises hardware components that collect information offline.
1.4. Literature Search Methodology
To ensure that we include a complete collection of the literature, we employed a methodical approach to the literature search. Firstly, we identified keywords and phrases that encompass the field of business visualisation, e.g., “Business”, “customer”, “market”, “visualisation”, “visual analysis”, “economic”, “ecosystem”, “intelligence”, and “finance”. Then, we used a logical AND combination of these keywords to search through digital libraries and conference proceedings as shown in Table 2. We started by searching the IEEE Xplore and ACM Digital Libraries, and then we browsed the conference proceedings of both the IEEE Visualisation and EuroVis conferences. We repeated this process with Google Scholar. A database that documents the publications within IEEE VIS conference from 1990 to 2015 called VisPubData [100] was also incorporated. The combination of search terms is outlined below. Each search term was split into two segments. Each combination of first and second terms were used in the search process.
Once the list is complete, we carefully read through while summarising and classifying each paper according to the systematic process outlined previously [101], prioritising the most recently published work. Then, we inspected the references for each paper, looking for previous papers that do not appear in the preliminary searches. The literature search process lasted over a year.
In summary, our primary sources during the literature search are:
- IEEE Xplore
- ACM Digital Library
- Google Scholar
- References of collected papers
Table 3 shows where most of the papers are published.
1.5. Survey Scope
Due to the multidisciplinary nature of this state-of-the-art report, we require a well-defined scope to ensure that the most relevant research is included. The scope encompasses academic research that has emphasis placed on state-of-the-art visualisation for the purposes of business data exploration. The quality of the visual design must be regarded as state-of-the-art—and the motivation behind the research must focus on business data.
Many conferences and journals publish articles which include visualisation of business data but do not focus on novel visual design aspects of the research. Papers published in visualisation journals are a valuable source for our literature scope. Non-visualisation journal and conference papers are only in scope if the focus of the research is visualisation-oriented with the ultimate goal of better understanding the business data for informing the decision-making process.
The primary source of in-scope research comes from the conferences and journals that make visualisation the subject of their publishings. The conference proceedings of IEEE VIS and EuroVis, or the IEEE TVCG and CGF journal contain a wealth of publications that focus their attention on business data. These papers are considered the primary driving force behind the evolution of the field. See Table 3.
1.5.1. Out of Scope
Publication venues such as the conference “Software Engineering and Service Science” (ICSESS) may publish papers that include visualisation of business data but do not place emphasis on novel visual design or value. For example, in a paper entitled “Visualizations-based Analysis of Telco Data for Business Intelligence” [102], Ashraf and Khan designed imagery to represent telecommunications data. However, these images come in the form of a pie chart and a radar chart where most of the analysis is performed through a numerical calculation. We do not include papers like this in the scope due to the limited visual component of the research.
IT Journals such as “IEEE/WIC/ACM International Conferences on Web Intelligence and Intelligent Agent Technology” also fall within this category. A paper entitled “Prototype of New Business process Visualization Tool” by Nagai et al. presents methods for visualising business process data through network diagrams [103]. However, these diagrams are not considered state-of-the-art and therefore are not included in the scope.
Papers we consider to be borderline might have good potential in the field of business visualisation and often mention this as a valid application, however, they do not focus on the business aspect. For example, Wu et al. created an opinion-based visual design from social media data [104] which shows valuable public opinion on products but also on non-business based events such as WWII and political scandals. Because of the tenuous connection, we do not include this within scope.
The topic of social media falls outside of the scope of this survey. Including it would make the survey too large. We refer readers to Wanner et al. [105] for an existing survey on this topic.
1.5.2. In Scope
It is possible for papers in cross-disciplinary journals to be within scope, only if the visualisations used are state-of-the-art or add additional value to the visualisation literature. For example, the journal “Expert Systems with Applications” published Hanafizadeh and Mirzazadeh’s “Visualizing market segmentation using self-organizing maps and Fuzzy Delphi method-ADSL market of a telecommunication company” [65], where advanced visual methods are used with emphasis placed on the contribution of the visualisation within a business context. A further example of an in-scope paper comes from the proceedings of the “International Conference on Web Intelligence and Intelligent Agent Technology” in a paper by Ziegler et al. entitled “Mining and Exploring Unstructured Customer Feedback Data Using Language Models and Treemap Visualizations” [39] where customer feedback data are structured in a specialised treemap. This falls within scope due to the focus on the customised treemap design and the novel features implemented in the software.
The main body of publications in this survey was obtained from the major visualisation publication venues. However, the “business” component of each paper is more complicated to define. To clarify this aspect of the scope, we impose a heuristic that a business related subject has to be mentioned in the title or abstract of the paper. A case study alone is not enough to fall within scope. For an overview of the business-related subjects, please refer to the literature search methodology in Section 1.4.
1.6. Organisation of Survey
The survey is presented in the same structure as the classification outlined in Section 1.1 and in Table 1. The three primary classification groups are Business Intelligence, Business Ecosystem, and Customer Centric. The Business Intelligence classification contains two sub-classifications; Internal Intelligence and External Intelligence. The Customer Centric classification also contains two sub-classifications of Customer Behaviour and Customer Feedback. See Figure 1.
We use these classifications as the major organisation of the survey and then use the secondary classification outlined in Section 1.3 to group research papers into subsections. Using Table 1, we navigate top-to-bottom, left-to-right summarising each paper and describing their relevance to their position in each classification. We also include meta-data tables in the survey to enhance the overview of the literature. See Table 1 and Table 5.
2. Related Surveys
This section outlines closely related surveys in this field but have a different scope. See the work of McNabb and Laramee [106] for a comprehensive overview of survey papers in information visualisation. Firstly, we provide an overview of the survey on visual analytics of financial data. Secondly, we describe Zhang et al.’s survey outlining state-of-the-art commercial visualisation systems readily available on the market.
Ko et al. presented a comprehensive survey on visual analytical approaches to financial data [14]. This paper aims to classify financial visualisation papers as well as make contributions as to the requirements for a financial visualisation paper.
The survey first identifies financial task requirements by interviewing analysts with a background in financial analysis. They introduce metrics by which financial visualisations can be quantified. Secondly, the survey collects and classifies previously published research in the field of financial visualisation. The requirements for VA systems are a product of the interview process with industry experts. Ranging from R1 (basic requirements) to R7 (Maximised utility).
- R1: Provide sufficient information to deduce basic patterns including historical and context data.
- R2: Automated techniques for pattern detection, trends and anomalies.
- R3: User interaction with the system. Enabling data resolution selection (drill-down), and data comparison.
- R4: Statical analysis of trends and anomalies identifying “statistically significant” trends.
- R5: Forecasting for future trends based on currently available data.
- R6: Additional functions for data cleansing, customisation and presentation.
- R7: Clear visualisations that avoid occlusion as well as supporting R6 and R3 functionality.
Ko et al. highlighted the discrepancy in the volume of research between the classes of financial visualisation. The discrepancy is attributed to data privacy issues within the financial community.
Zhang et al. presented a comparison of the industry-leading visual analytics software used in Big Data Analysis [107]. The Top 10 most prolific pieces of visual analytics software are compared. The four most popular of these are: Tableau, Spotfire, QlikView, and JMP.
Contributions include a comparison of how the software handles data, what frameworks are used, and the efficiency of the data management. Aspects such as data import ease, data compatibility, etc. are taken into account when assessing the software. Four subsections of criteria are used to assess the automatic analysis of the software: statistics, data modelling, dimensionality reduction, and visual query analysis. This is considered a way of learning about the data without greatly customised user input. Features such as pattern recognition are mentioned as useful in some of the software but not implemented across all of them. Visualisation techniques are divided into two subsections: graphical representations and interaction techniques. System and architecture is divided into stand-alone desktop applications and server-sided dashboard tools.
3. Business Visualisation Articles
This section contains the core state-of-the-art review of Business Visualisation.
3.1. Business Intelligence (BI)
The category of business intelligence (BI), which consists of two sub-classifications: Internal intelligence and external intelligence. Business intelligence is seen as the generation of meaningful insight into business data.
3.1.1. Internal Intelligence (II)
This subsection contains all inwardly focused BI visualisation research. If the emphasis is placed on internal structures or processes within the business, then we classify the paper to be internal.
Primary Data as Intentional, Active Digital Collection (II): This section contains research that use digital hardware to collect data for the purpose of internal intelligence visualisation research. Only a small amount of research is found in this category, presumably due to the availability of existing data and the high cost of collecting new data. Otsuka et al. presented methods of visualising internal staffing relationships within a company [20]. Each staff member wears a digital name tag that records interactions with other staff members. All internal interactions are recorded and then visually mapped. A topographic map is used to display this interaction. To visualise the interaction, a topological map called a dendrogram is used. See Figure 3.
The employees are clustered into groups showing the social and working dynamic of the organisation. Each employee can fall into multiple groups and therefore can be represented by multiple nodes. The process of adding new members automatically generates the dendrograms. This is done by either creating a new group, adding the member to an existing group, or merging two groups to make the member fit. The novel algorithm classifies the interactions into a hierarchy in such a way that members can belong to multiple groupings, and the staff hierarchy can also be seen. The research informs managers on the employee networks in their own company.
The strongest influences in the field of visualising hierarchical structures have been MoireGraphs [110], Multi-Tree Hierarchies [111], and ConeTrees [112]. This research data have strong links with social networking data. Visualisation projects of this nature are becoming increasingly more popular as social networks grow [113,114].
Primary Data as Intentional, Active Research Study (II): In the following, internal intelligence (II) is derived from data sourced using direct research studies. Sedlmair et al. examined the analytical role of visualisation tools used in large automotive companies [24]. Nine different challenges are discussed along with a set of recommendations for planning and evaluating large company visualisation software. The paper also explores two case studies within the automotive industry that highlight the challenges of information visualisation in the environment of large businesses.
The article outlines many field characteristics that present challenges when attempting to perform analytical data visualisation in a large business environment. These challenges range from the aligning the software capabilities with the corporate aims, through data acquisition processes, to the end result of either publication, research, or appealing to the stakeholders. The recommendations for the field are established as a counter to the challenges, e.g., the challenge of publication and stakeholder appeasement can be overcome by making all publication conditions clear at the start of the project, agreeing what components of the research can be published through a documented communication.
- Case Study 1: AutobahnVis. The AutobahnVis software provides an overview and navigation of error detection in network communication logs. The challenges that arose while developing the software were largely the complexity of the data and the specialised skill required to interpret it. It had to be acquired from busy staff members within the company, resulting in a large time cost and expense to the project. The complexity of the project is reflected in the design, and therefore presented several challenges along the way.
- Case Study 2: MostVis. The MostVis software is designed as an alternative visual access to auxiliary information. It presents large hierarchical data related to the bus systems of car models. The visual hierarchy tree runs from left to right and shows complex information about a car’s auxiliary data. Company stakeholders accepted the resulting software research and provided funding to expand further, highlighting the importance of stakeholder support in visualisation research.
The concept of software design being a product of both software developers and domain experts has been found to be beneficial in gaining insight into unexplored work processes [115]. Gonzalez and Kobsa [116] outlined the adoption of information visualisation tools by analysts, later followed up by a further paper outlining the major benefits of visualisation in the field [117].
The next paper uses primary interview data to increase understanding of a company’s employees. Kandel et al. conducted an interview study with 35 enterprise analysts with the aim to better understand their day-to-day operations and how visualisation tools are used from the analysts perspective [18]. The study is conducted with 35 participants from 25 organisations within 15 different industries.
It was found that analysts generally fall into three main categories; hacker, scripter, and application user. These three groups of people have very different tool requirements. Six of the “Hackers” claimed that visualisation tools such as Tableau or D3 are useful only as reporting tools as they did not offer any data flexibility and can only be used to present information. They already know what information they would like to portray. Scripters did use statistical visualisation packages to produce visualisations for exploration purposes, and they found that using the same package for visualisation and analysis helped them transition smoothly between visualisation and analysis. The extent to which application users created visual designs was through simple packages such as Excel or used standard reporting tools such as Crystal Reports.
Analysts report that a primary benefit of visualisation is error detection. When working with large amounts of data, errors in the collection often go unnoticed, and visualisation highlights these errors. In general, it is reported that visualisations are best used alongside statistical analysis. The findings indicate that imagery of large amounts of high dimensional data is too complex, and simple visualisations do not scale to this level.
Prior to Kandel et al., Sedlmair et al. discussed the difficulties of evaluating visualisation tools in the corporate environments [24]. Kwon and Fisher discussed the difficulties of using visualisation tools from the perspective of someone who is not trained in the field [118]. Other research has looked at the processes of analysts [119,120] but often do not focus specifically on business or on visualisation.
Burkhard presented a framework for the creation of business strategy visual designs [23]. Building on the knowledge visualisation framework, this research identifies the aspects of strategic data suited for visualisation by isolating the different perspectives of the visual design. The resulting guidelines produce valuable strategy based imagery suitable in a business context—focussing on internal operations of a business.
- The Function perspective distinguishes functions of visualisations based on the desired outcome; i.e., if the goal is to create new insight, recall the data, produce motivation, elaboration etc.
- The Knowledge perspective identifies the type of knowledge that is required to be transferred, i.e., what, who, where, why, and how?
- The Recipient perspective highlights the target group recipient, i.e., individual worker, team leader, senior management, workgroup etc.
- The Visualisation type perspective examines the type of visual design suitable for the above context. i.e., sketches, diagrams, maps, images, interactive visualisations, stories.
Previously, Kaplan and Norton introduced a strategy map for visualising causal relationships in strategic scenarios [121]. La Rooy described graphical representations of data in a business context to improve performance [122].
Secondary Data as A Priori Database (II): The literature in this section studies pre-existing data for internal intelligence visualisation. The first paper describes some visual designs to inform a company’s internal decision making after the original data is collected.
Wright presented six case study examples of info-vis software used in a business context [47]. These real-world examples are among the first recorded utilisations of information visualisation software used in the day-to-day management of the business. In this article, case studies focus on 3D visualisations of pre-existing business data ranging from financial information to management support.
- Fixed Income Management: In this case study, a dataset of financial portfolios is depicted using 3D line graphs. Emphasis is placed on the 3D nature of the visual design as it enables thousands of data points to be plotted compared to a smaller number in 2D. The more holistic view enables investors to quickly see the state of their portfolio or compare multiple 2D visual designs.
- Derivatives Risk Management: The software conveys the risk involved in options trading. A virtual environment contains multiple visual representations including a virtual screen showing the yield curve, a surface plot mapping the current profit and loss, and a grid map that shows the relative profit and loss. Users can interact by adjusting the extraneous variables such as interest rates to change the forecast visual designs.
- Management Decision Support: A geospatial map is used to display the locations of a chain of businesses and then 3D bar charts are overlaid on top to show the metric values used to analyse the businesses. This enables managers to evaluate and balance multiple business locations.
- Credit Scoring: This design uses a geospatial map to display credit scores in the United States. The software enables the market risk of permitting loans to be analysed.
- Retail Sales Analysis: Again using geospatial maps, this enables the user to compare the retail value of stores across the U.S. both individually or aggregately in each state. Three-dimensional bar charts or raised map tiles are used to show the sales from each sector or store.
- Management Reporting: This managerial software uses a virtual environment and 3D bar charts to show the portfolios of a business. The portfolios are grouped into asset classes and represent the main axis of data. A virtual screen shows 60 scenarios that would affect the portfolios and users can select each to see the effect. Another virtual screen shows the currency conversion rates which change with the scenario.
Vliegen et al. proposed an algorithmic modification to the traditional treemap to enable a better understanding of internal business data to mimic (or resemble) standard business graphs such as pie charts, bar charts, and histograms [48]. Specifically, the potential layouts of the treemap nodes are explored to maximise the coherence of the result. The data originate from a pre-existing database. See Figure 4.
The first proposed mixed treemap takes the structured layout of the slice and dice algorithm and combines it with the square readability of the squarified treemaps algorithm. This way, the higher level nodes remain ordered, but the lower level nodes become squarified. The matrix modification enables data comparison of different sizes by subdividing the rectangle into a grid. When the number of cells in the grid exceeds the number of items, then dummy nodes are added and blank cells are used. Another modification involves the transformation of the treemap visualisations in pixel space to reflect the aesthetics of other popular visual designs, such as pie charts.
Prior to Vliegen et al., Harris provided an extensive overview of traditional depictions of business data [123]. The treemap was first introduced by Johnson and Shneiderman in the early 1990s [124]. Further work enhancing the original design is also presented [125,126,127].
Continuing on this theme, we look at research utilising pre-existing databases for the purposes of exploring internal business operations and functions. Nicholas et al. presented a novel way of conveying the failure rates of automotive components and the effect that this has on customer satisfaction [50]. The base design of the visual layout extends the standard chord diagram and depicts three-way relationships using both curved angles and glyphs. Previous attempts at chord diagrams focus on two-way relationships. This method enables a third relationship to be added and compared. The dataset is collected from by automotive company recording the failure rates of automotive components. The automotive data are divided into 11 autonomous fault categories (engine, transmission, etc.). The aim of the visual design is to ascertain which combination of component failures yield the most dissatisfied customer. See Figure 5 on page 16.
The multi-chord diagram represents the frequency of failures between components with the curve thickness and then may use colour to represent how dissatisfied the customer is. See Figure 5. In the glyph extension, the lines of the chord diagram are shortened and only display the intersection of three component fails. This reduces overlap and improves visibility by reducing clutter while retaining the vital information. The benefit of this design is that the company can now clearly see what products typically fail together as well as how badly the hardware failure affects customer satisfaction. Recommendations can be made to improve the worst offending components that have the largest impact on customer satisfaction. Less focus is placed on the failing components that do not have a negative influence on customer satisfaction.
The inspiration for the chord diagram extension came from Bostock, Ogievetsy and Heer in their “Data-Driven Documents” paper [128]. A radial technique by Kerren and Jusufi enables the visualisation of an undirected hyper-graph [129]. Nicholas et al. used elements of this visual design.
This next example of derived internal intelligence using a pre-existing industry acquired data involves the analysis of call centre data. Roberts et al. presented an analytics system that visualises call centre data [51] provided by their industry partner. They modified the traditional treemap to accommodate time series, event-based data such that 24 h of call centre activity can be presented in one view. Novel interactions and filtering methods are used to modify the view from a full day of data to individual call records.
The top hierarchical level of the treemap shows leaf nodes representing time frames (24 h > 1 h > 10 min > 1 min). When an hour node is selected, the graphic is zoomed in smoothly to reveal the individual call records as the new leaf nodes of the treemap. A selection of sliders enables the user to filter the call records by a range of metrics, narrowing the scope of the calls in a focus + context environment. Roberts et al. noted that queue times sharply increase around 13:00 each day. This is attributed to shifting staff levels within the call centre. See Figure 6 on page 17.
A common area of research in the call centre is the customer service quality being provided by the staff [130,131]. This research extends Blanch and Lecolinet’s work on navigating treemaps using a zoom interaction [132].
Roberts et al. continued their work exploring call centre event data, using parallel coordinates plots (PCP). See Figure 7. The focus of this research is to develop new brushing techniques to overcome the challenges associated with overplotting. The main contribution lies in the “sketch-based” brushing that can be easily applied, modified, and moved around the plot to enhance the analytics of the software.
Additionally, a range of glyph-based user options guide the user in their brush placement and provide additional information about the surrounding metadata. A priority rendering feature lets the user select a point on the n-dimensional plot that they want to focus on, and the draw order of the polylines change to show that data drawn on top, helping with overplotted graphs. The software also includes an automatic brushing feature that can be used to either scale the parallel coordinates axis or apply a brush sketch according to the distribution of the data. This feature aims to make complex datasets accessible to new users.
Secondary Data as a Business Process (II): This sub-section focuses on internal intelligence generated from existing business processes. The derived internal intelligence of this literature aims to inform decision making.
Broeksema et al. [71] presented a visual analytics system for operational decision making in a business management environment. The system displays the decision-making process in the software. A car insurance case study is used. The VA toolset is used to analyse a dataset from the car insurance industry. The data used is from an auto-quote request that has been stripped of confidential information.
A set of 144 rules process the input information and generate a quote. Discounts are applied based on variables such as car safety features, no claims bonuses, etc. These data are then fed into the decision map visualisation. The decision map is based on work by Zizi et al. [133] but instead maps concepts as opposed to instances. Two diverging factors in the data are plotted against each other in a scatterplot and the space is segmented according to the most prolific value in that data space. See Figure 8.
The decision map is primarily based on Zizi et al.’s [133] dynamic map. Decision support systems often are used with financial data [134,135].
Secondary Data as a Business By-Product (II): This segment describes visualisation research related to internal intelligence using business by-product data. In this example, the by-product is data recording delivery times and product sales. Gresh and Kelton present a visualisation application focused on the presentation of business intelligence data using 2D and 3D visual designs in the delivery industry [78].
Customer delivery times are the focus of this research. The business has delivery targets to achieve, however, due to the vast stock range of hardware and the small delivery targets, the business needs to optimise their warehouse locations and stocking. This optimisation analysis is done through the visualisation of the delivery times. When using the software, the user is presented with a control window that enables them to choose a subset of the data. The user is then shown a combination of two- and three-dimensional visual designs. These images show the target service level in comparison to the actual service level.
Comparable software has been created, but does not exploit the full potential of the data [136,137]. A more customised approach is required for this subset.
Keim et al. proposed a new type of bar chart that can be used in the visual analysis of large transaction datasets [80]. The design enables the user to see transaction value correlations and outliers. The bar chart is created from sales data by separating the range of transaction values into tiers and then assigning each transaction a tier. The bar is drawn as a sorted accumulation of all transactions within that period. The tiers are coloured such that the bar appears to be subject to a continuous colour gradation while still visualising each transaction as discrete. See Figure 9.
3.1.2. External Intelligence (EI)
This subsection contains outward focused BI visualisation research. If the emphasis is placed on the external environment such as direct competition within the market sector, then we classify the paper as external.
Primary Data as Intentional, Active Research Study (EI): In the following, external intelligence is depicted using data collected through research studies. In a business environment, different categories of stakeholders have their own requirements for visual analysis made within the company [29]. Keahey examined the different stakeholders, classified them, and outlined their expectations.
The types of stakeholders examined in this paper range from the marketing team to the end users. Each has a different set of expectations for the visual design. The range of requirements spans across two axes. The first ranges from effective to attractive, and the second from simple to complex. Although this is a generalisation, often effective visualisations are not considered aesthetically pleasing, whereas attractive graphics are not always the most effective. The y-axis is the scale of visual complexity. Some stakeholders require a complex visualisation to show off the work while others require a simple graphic to aid in information retention. See Figure 10 on page 20.
Secondary data as A Priori Database (EI): This subsection contains one visualisation research paper that uses a pre-existing database for analysis in the field of external intelligence. Ferreira et al. utilised the many urban taxi behaviour data that have been collected in New York City [54]. Primarily, geospatial data are used in the visualisations to map out the routes the taxis traditionally make. This research intends to find answers to some previously unanswered questions such “What is the average trip time?”, “How does taxi activity vary throughout the week?”, and “What effect do major events have on the taxi behaviour?”.
The TaxiVis software enables the user to select the time frame. The geospatial paths appear on a map widget, and the raw data appear on a data summary widget. See Figure 11. A heat map is overlaid onto a map of the city to display the majority of the data. This heat map highlights the trip density within the city as plotting individual points would occlude most of the data due to its volume. Side-by-side comparisons are used to show each day’s activity throughout the week. It is easy to observe that Monday is the quietest day with activity progressively getting busier throughout the week. The same side-by-side comparison is used to compare the taxi activity during major city events such as presidential visits, or natural disasters. Using day-to-day comparisons of the same map visualisations shows the progression of such events.
Previously, Ge et al. proposed an analytics method for taxi drivers to calculate the most financially efficient way of finding passengers [140]. Peng et al. modelled the day-to-day habits of taxi drivers [141]; however, neither of these research topics is visualisation focused. There has been research into the visualisation of movement data [142,143], but not explicitly related to taxi data.
Secondary Data as a Business Process (EI): Here, we look at two papers by Hao et al. that explore the external environment of a business that impacts the day-to-day operations of the business.
Hao et al. presented BizViz, a visualisation software that interactively visualises business operations processes [19]. The BizViz software analyses the relationships between important external operational parameters. The primary focus is on data distribution of up to three operational parameters but the user can drill down to a one-on-one comparison of parameters where the transaction sets can be seen.
The design uses a circular chord-like plot to present its data. Separated into three sections, the circle presents one attribute on the left half, one attribute on the centre dividing line, and the final attribute on the right side. See Figure 12. Edges denote relationships. When drilled down to two attributes, the circle is split into two, and the half circles are plotted with horizontal lines at varying density to represent the two selected operational parameters. The data specifically deal with fraud prevention and credit card usage in retail.
Hao et al. later published further research in this field, continuing the parallel/chord visualisation in the financial security sector [75]. They focused on business process impact by adapting the previous visualisation methods use case to show the new data. The examples show the source attribute to be the customer type (measured by importance or size). The intermediate attribute is mapped to a time frame for ordering (delays, or order time), and the destination attribute is mapped to the outcome (order accepted/rejected, penalty costing, etc.).
Secondary Data as a Business By-Product (EI): This subsection contains external intelligence visualisation research using data sourced from the by-product of business operations.
Liu et al. explored the potential of billboard placement through the visualisation of GPS taxi data [81]. Using a combination of geospatial visualisation and glyph designs, Liu et al. explored the optimum placements of billboards across a city. A geospatial heat map is used to display the flow of taxi traffic, highlighting high volume areas where billboard potential is maximised. The solution view uses layered circular glyphs to evaluate potential points of interest where billboards can be placed. Using a combination of the location view and solution view, the user can select which location is best suited to their billboard as a function of cost and footfall.
The billboard location selection process is a sub-problem of Multicriteria Decision Making, using a geospatial context [144]. Taxi GPS data have been extensively researched with applications from route optimisation [145] to urban planning [146]. Visualisation is often used to present data of this nature. Chen et al. provided a full survey of traffic data visualisation [147].
3.2. Business Ecosystem (BE)
This section exemplifies literature that places emphasis on a complete business ecosystem from an external perspective without the specific focus on a single body within the ecosystem. These ecosystems can be collaborative, competitive environments, industries, or stock market-based. The focus is often placed on an overview of the complete ecosystem. This classification is dominated by research from Rahul C. Basole, who specialises in Business Ecosystem visualisation, and is associated with eight papers of the seventeen in this field.
Primary Data as Intentional, Active Research Study (BE): Here, we present a visualisation paper that performs a research study using business ecosystem data. The ecosystem is represented by stock market activity. Merino et al. presented a user study evaluation of different visualisations and identify which are more suited to visualising large amounts of stock market data [30]. This is done through the “Task-At-Hand” interface which offers a selection of visualisation techniques to display the data and user options that incorporate brushing and linking.
Traditional visual designs range from bar charts and line graphs to pie charts and tables. These visualisation techniques are easy to understand but are limited in the depth of data that they can display. The Geometrically-transformed group contains visualisations such as parallel coordinates and pyramid representations of data. These are useful for identifying trends in the data but, again, it can be challenging to interpret more complicated datasets.
Iconic displays map attributes for complex datasets. Glyph-based approaches depict a large number of data attributes, however, they are not appropriate for large datasets due to overplotting. Pixel-based designs depict the benefit of conveying a large number of data points but present a challenge when positioning the data points being plotted. Stacked Display techniques are designed to present hierarchical data. Treemaps are often used for visualising data of this nature. The space-filling approach enables useful analysis of a dataset; however, it is dependant on the algorithm used to generate the treemap as varying aspect ratios can have a negative impact on utility.
Each design category is assessed by a range of criteria. See Figure 13 for results. The visualisation technique categorisation was identified by Keim [148] and the criteria by which the designs are judged were identified by Zhou et al. [149].
Basole et al. performed a study that evaluates the effectiveness of visualisation methods on business ecosystem data [31]. The three presentation types examined—list, matrix, and network—are the most popular forms of ecosystem visualisation. Seven criteria were used to evaluate the visual representation: ease to learn, ease of use (beginner), ease of use (intermediate), speed of use, speed to learn, control over analysis, and flexible capabilities. See Figure 14.
The results found that the network outperformed the other two in almost every criterion, other than the ease to learn. Once the cost of training has been expended, the network is a far superior method of displaying business ecosystem data.
Hybrid Web-scrape (BE): In the following category, web-scraped data are used to visualise the business ecosystem. Lu et al. outlined methods that use visual analysis to predict box office success [35]. Social media data are used to derive predictions, ranging from Twitter data to Bitly link data mining.
To obtain customer data about the movies, tweet data are mined using keywords related to a given movie. In addition to this, IMDb [150] is used to collect numerical data about the film. All data are collected two weeks before the release date. Both the volume of tweets and the content are taken into account when analysing the tweet data. Sentiment analysis is performed on the text so that the film reception can be assessed and the qualitative data are quantified. A word cloud of the most commonly used words where colour is mapped to sentiment enables users to see at a glance how positively the twitter community ranks the film. A timeline visualisation shows the magnitude of positive or negative tweets over a two-week period before the release of the film. This enables marketing campaigns to be measured through a new medium. Both film review scores and the film revenues were predicted from the data. Despicable Me 2 has a predicted score of 7.8 and an actual score of 7.9, whereas the predicted five-day revenue for the film is $116.5 m and the actual five-day revenue is $143 m. This shows the score is far easier to predict than the revenue, but the system can calculate a rough estimate.
Prediction models for the film industry have previously been worked on [151]. The relationship between movie review and revenue is also examined [152]. Asur and Huberman found that the volume of tweets relating to a film had a direct relationship on the revenue, accounting for 80% of the variance in prediction [153].
Secondary Data as A Priori Database (BE): The literature in this section contains a number of visualisation research papers on the business ecosystem where the data are taken from pre-existing (a priori) databases. This is by far the most common data source for an ecosystem visualisation paper. Wu and Phillips presented a visual design of the 2008 financial crisis [56]. Using stock prices and news headlines on a timeline leading up until the crash, the user can identify relationships between financial news headlines and the Dow Jones Industrial Average (DJIA).
The user is presented with a dashboard-style visual design that uses brushing and linking techniques to show different aspects of the finance evolution. The dashboard is made up of three components. The bubble motion chart depicts the influence of news articles on the trading of stocks. This visual design projects a live animation to present the data. A radial plot displays the frequency by which important words are used in the headlines of financial news articles. Words that result in a positive impact are drawn in green. The News Events Bar Chart shows a simple chart that indicates the number of news articles written about each of the chosen companies up until a given point.
Lux presented the first overview of financial visualisation, which Wu and Phillips extended [154]. Merino et al. analysed different visualisation techniques for financial information to discover those most suited to the data. Keim et al. suggested that charts are the most efficient method of presenting financial data [155].
Basole et al. presented an overview of the business ecosystem using the example of the mobile industry [57]. To achieve the overview, Basole et al. presented dotlink360, an in-house visual analytics application that utilises data from pre-existing finance and business databases as well as current news articles to explore a businesses’ ecosystem. This involves exploring the connections between companies and the types of connections, the difference between companies in similar market position, and how these positions have changed over the years. See Figure 15.
Previous software that attempts to yield similar insight into the business ecosystem does not take into account the dynamic and complex data involved. This research takes a more holistic approach to the data analysis which encompasses the complex data landscape “from core to periphery”. Emphasis is placed on the user interaction design to ensure a practical use in the field. The dotlink360 incorporates a range of visual designs, namely a “periscope view” that maps the companies in a network that are clustered by industry.
Few citations to previous related work are provided here, most notably Basole’s visualisation of interfirm relationships in a converging ecosystem [58].
In a later paper, Basole et al. also presented methods of visualising relationships between firms within an industry that enable analysis of the surrounding business ecosystem [58]. The networks that link businesses together are the focal point. By extension, the designs convey a holistic competitive insight into the ecosystem beyond the traditional single market view. See Figure 16.
The software primarily focuses on the agreement portfolios of an entity, defined as either a company, market segment, or country. An agreement is classed as an official interaction between two entities whereby a decision has been processed.
The connectivity perspective is the primary window that shows the set of connections between firms. See Figure 16. There are four types of view in the connectivity perspective: Path, a network view that shows connections between companies; Segment, a view that depicts a company’s position relative to its market segment (company focused); ScatterNet, a node-link diagram combined with a scatterplot to show company-to-company agreements; and Geography, a view that maps the physical location of the companies on a map.
The foundation of research in this paper stems from the development of network analysis software [156] that shows static imagery of organisational networks. The business process analysis component of the research has a foundation in previous business visualisation tools [157]. Knowledge management and discovery tools were also available but in separate software packages [158,159].
Schotter et al. explores international business relationships through the creation of interactive dashboard designs [62]. Data are overlaid on a google map view which represents the pathways in which Japan is expanding their business throughout Asia. This interactive map shows the “communities” within a network, where nodes share a higher rate of connections than in other areas. Additionally, heat maps and hexbinning (tile-based heat maps) are also used to show the relationships between these communities.
The paper presents a range of visual designs that utilise the plotting of meta-data over a google map window, or through standard visualisation methods such as matrix plot and chord diagrams. These dashboard-like designs focus on the nature of the relationships between business entities, and the communities within an ecosystem.
Basole et al. presented ecoxight, an interactive network diagram displaying business ecosystem data [63]. The network is constituted of two components, nodes and edges. Nodes represent either a company, API, or investor within an ecosystem and edges which represent the relationships between the nodes. Each edge has a source, target and weight. User options enable interaction through data filtering and visual control of size, colour, and shape of nodes within the network. Multiple views enable the user to explore the data from different perspectives.
Secondary Data as a Business Process (BE): This subsection features two visualisation papers that focus on the business processes involved in the business ecosystem. Both use data that were not collected originally by the visualisation researchers (secondary data). Basole utilised visualisation tools to enhance understanding of a business’s position in the global market by exploring supply chain network process [76]. The approach in creating the tool is to co-author the design with the corporate users to ensure the use case is being adhered to.
Three scenarios are devised and tools are created to cater to each of their user requirements.
The global supply chain is an integral process to the success of a business. Poor optimisation of this process can wreak havoc on the finances of the business in the future. The tool depicts the risk involved in managing a global supply chain using a network graph to show suppliers and the relationships between them. Shared suppliers are seen as a higher risk and are therefore highlighted. Through this visual design, we can clearly see what suppliers should be used to minimise the risk of chain disruption. See Figure 17.
It is essential for corporate management to have a detailed and accurate view of the competitive market in which they are engaged. A force-directed network is used to achieve this. A user can view the market ecosystem as a whole which enables informed decision making. Venture capitalists are highly sought after in the business world. Understanding the motivation behind the investments these people make is integral to gaining funding from them. Here, the previous force-directed network is adapted to show venture capitalist activity within those markets.
Previously, corporate visualisation has been studied, but no focus is placed on intelligence tools [24,160].
As business globalisation increases, the process of supply chain management is becoming increasingly more complex [77]. Large supply operations are often subject to delays and susceptible to extraneous environmental factors outside business control. Basole and Bellamy provided insight into visual forms of risk analysis for supply chains [77]. Network graphs are used to depict the risk across all supply chain visualisations. There are two main focus areas: firm level and industry level.
For firm-level analysis the network graph places the firm at the centre of the layout and all firm connections are shown within a circle radius connected by relationship curves. See Figure 18. The connecting firm’s dependants are then shown on the next circle radius. This continues until a map of the supply chain is built around the first firm. The industry level visualisation places all firms in an industry as nodes around in a circle. Relationship edges connect the firms and colours are used to map the risk level. Node size is linked to topological importance.
Decision support related research has been carried out in the field of network topologies [161]. There is previous research investigating workflow visualisation [162], identifying influential nodes in topological networks [163,164], and identifying unhealthy supply networks [165].
Secondary Data as a Business By-Product (BE): In the following, business by-product data are used to depict the business ecosystem. Business by-product data often come in the form of transaction and sales records. Ko et al. created a visual analytics system that draws a comparison of two competing businesses, displaying trends, growth rates, sales, etc. [83]. The software utilises PoS (Point of Sale) data to create the analysis and design. Visual features of MarketAnalyser can be seen in Figure 19.
A screen space saving layout is implemented to display sales, growth, and trends for each of the chosen companies. Filtering options enable the user to prioritise stores through a cumulative method of filtering companies using sales or trends. The user can choose the most suitable company to compare with their data. Figure 19 on page 32 shows the geographical view of the software. This enables the user to see the geographical sale locations for each company. The colour of each region shows the direction of the trend in sales. The stacked graphs in Figure 19 can show relationships between different product purchases. It can highlight combinational trends of multiple products between businesses. Sliders are used to select time intervals.
Market trends and financial forecasting are traditionally conveyed using the standard set of visualisation tools such as bar charts and line graphs [166,167]. Treemaps are sometimes used to represent market data [48]. The design of the display matrix utilises elements from Keim’s work on pixel-oriented visual designs [138,168,169].
3.3. Customer Centric Literature
This section presents the two-part customer centric literature. Here, we examine visualisation research that focuses on the customers involved in the business, as opposed to the business itself. Table 5 shows the number of research papers appearing in each business classification of the survey by year. We can observe a general increase in the number of publications over time.
3.3.1. Customer Behaviour (CB)
The sub-category of customer behaviour encompasses literature that focuses on profiling customers or potential customers in an attempt to observe or predict customer behaviour. This type of analysis has become progressively more popular in recent years due to the availability of suitable data (see Table 5).
Primary Data as Intentional, Active Digital Collection (CB): The following research conveys geo-location data collected through hardware that is used to track customer behaviour. Yaeli et al. analysed the movement of customers shopping in retail stores [21]. The data are collected from mobile devices capable of WiFi, NFC, and Bluetooth in the target area. Analytical visual interfaces are used to explore the customer path in the retail store. The analysis aims to provide a better customer in-store experience and to improve business decision making.
Customer value is derived by combining the motion data with other meta-data such as point of sale information. Customers who visit the store more frequently or make more significant purchases are clustered into a group with the goal of targeting these customers more. Other segmentation criteria taken from the original tracking data outline the customer’s path through the store, e.g., in a department store, some customers browse the entire inventory while others go directly to one section of the store.
The data used in the design are department store data. A geospatial map of the store is drawn with each department labelled. Customers are given an entry point and then arrows depict the path that each customer makes through the store. Contrary to popular belief, it is shown that low-value customers are more likely to walk at random through the store, whereas high-value customers take a direct and efficient path around the store. See Figure 20.
In-store path dependency analysis has been widely researched [170,171]. However, there is no noted related work for the visualisation of these data.
Primary Data as Intentional, Active Research Study (CB): This subsection presents visualisation research that explores customer behaviour through research-based user studies—primary data collected by the visualisation researchers themselves.
Dou et al. presented an analytics system that provides insight into social, economic and behavioural issues through demographic analysis [32]. An online survey is used to collect textual data along with the correct demographic information about the respondent so that the predictive visitations can be tested. The software utilises a number of visualisation methods and their effectiveness is analysed and ranked based on their ability to predict demographic information.
The ultimate aim of this system is to answer three questions: What are different demographic groups interested in? Which demographic groups share interests? Can we successfully classify online users into the correct demographic?
To address the first question, a parallel set diagram is combined with a word cloud such that the user can see a customer segment or demographic (shown with the parallel set) alongside their interests (shown with the word cloud). The user can select a demographic in the parallel set and the word cloud will update with that segment’s interests. See Figure 21a). The cluster view maps each demographic against their interests to see if there is any overlap between demographic and interests. See Figure 21b). A tabular view shows the most common textual attributes associated with each demographic variable. This addresses the third question.
Parallel sets are often used to visualise categorical or demographic data [172]. Previous research focuses on the visualisation of text data without the linking of demographic data alongside them [104,173].
Hybrid Web-scrape (CB): The research in this section uses web-scraped data to derive and study customer behaviour.
Shi et al. presented a visual analytics system that tracks user search engine loyalty and the behaviour of users switching between different search engines [36]. A new visualisation method “Flow View” is presented that develops its structure based on a flow metaphor. A density map and a word cloud are also used to further the understanding of the customer loyalty behaviour. See Figure 22.
Inspired by an infographic by an XKCD Munroe comic [174], the flow view presents user loyalty by separating the flow out into different degrees of loyalty. The transitions between these layers show the trending changes in customer loyalty. Highlighting the link between loyalty and satisfaction, the density map plots loyalty on the x-axis and satisfaction on the y-axis. A word cloud displays the keywords searched in each search engine where transitions between search engines can be seen.
Web behaviour visualisation is a mature research topic [175]. Trees have also been used to depict these data [176,177]. Search engine switching behaviour has been widely researched [178,179], though Randall Munroe’s webcomic XKCD [174] inspired the visual design itself.
Sijtsma et al. presented TweetViz, a tool that utilises twitter data for the purposes of customer feedback and business intelligence. A dashboard approach is taken that visualises the geographical location of the business alongside the tweet feedback. The user can select what company to view, and then all of the stores from that company are marked on the map. The sentiment of the tweets about these stores are computer and displayed to the user through the colour of a marker on the map. This system enables the user to quickly find “problem stores” and then read the twitter feedback of the customers who have been there. User options provide filtering of customer demographics and competitor comparisons.
Twitter data have often been used for sentiment and business analytics purposes [180,181]; the novelty of this application is that it collects customer opinions of physical stores and visualises the sentiment behind them, removing the need for a review to be explicitly written.
Secondary Data as A Priori Database (CB): This subsection contains research that derives and depicts customer behaviour from pre-existing secondary databases. Woo et al. presented a method of conveying customer targeting data using a heat map [64]. This method depicts value distribution across customer needs and characteristics which helps the planning of a customer-oriented business strategy.
A pre-existing database appears to have been used for this research.
A customer need is interpreted as any voiced opinion about a product. This can be represented linearly by taking the volume of expressed opinions without a positive or negative correlation. The customer characteristic refers to a linear scale that can quantify a customer. Using a number of metrics, customers are placed on a single sliding scale. The customer map is drawn on a 2D plane with one axis representing a key customer characteristic and the other a key customer need. Each customer will occupy their own space on the x–y grid and therefore a heat map can be created to see where the customers fall. Clusters of customers can be identified as well as trends in the data.
Customer segmentation visualisation methods previously use neural networks to draw a self-organising map [182]. Mulhern suggested a framework that emphasises the importance of segment-based target marketing as calculated by visually inspecting profit curves [183].
Hanafizadeh and Mirzazadeh presented methods for displaying market segmentation data to inform marketing strategies [65]. Utilising a pre-existing database, clustering techniques alongside self-organising maps are used to segment customers into behavioural demographics. Each cell of the SoM grid is coloured using a combination of RGB values which are derived from the attributes associated with the customer such as education level or income. These customer nodes are arranged into clusters, isolating groups of similar purchasers. This segmentation enables the user to see distinct groups of customers and the motivation behind their purchases.
The self-organised map was introduced by Kohonen [184] in 1981 and is used to present data of high dimensionality. The maps have previously been used to present business-related data [185].
The self-organising map was more recently explored by Kameoka et al. [66] who continued this area of research by visualising customer segmentation data, as opposed to market segmentation data. The dataset that was used contained over 100k members of a Japanese supermarket loyalty scheme. The SoM clusters loyalty club members into unique categories which can be used to more effectively market selected products to the different groups.
Wu et al. presented “TelCoVis”, a visual analytics system that highlights behavioural patterns in potential customers through data obtained from China’s largest telecommunications company [67]. This system focuses on co-occurrence (people from two regions visiting the same urban space during the same time span). See Figure 23 on page 38.
They used two visual designs to convey this data. Firstly, a contour based treemap view that divides radial space into time segments and renders a contoured treemap within the space representing the distribution of visitors in that area. Secondly, a geospatial heat map shows the flow of people into and out of a given area. Domain expert feedback attests to the usefulness of these in the context of business intelligence.
The visualisation of mobile phone data is an established area of research. Deville et al. presented population mapping [186], the data have even been studied for the purpose of fire and rescue services [187]. The movement behaviour aspect often employs heat map-like rendering to address the geospatial data as well as the intensity data [188].
3.3.2. Customer Feedback (CF)
This subsection discusses the visualisation of feedback data. The papers focus on aspects of the customer experience such as satisfaction or opinions. These visual insights aim to adapt the business product or service to better suit the customer expectations.
Primary Data as Intentional, Research Study (CF): This subsection presents a paper that use interview studies to visualise customer feedback—data collected by the visualisation researchers. Broadbeck and Girardin presented a visualisation tool that uses parallel coordinates combined with a tree structure to analyse customer feedback data [33].
The design of the tool maps the data to parallel coordinates and then implements a selection system that converts the customer survey data to a hierarchical structure by clustering questions by dimensions. The user can select subsets of the data according to these dimensions. The three dimensions are quality criteria (questions), quality dimensions (segmented), and indices (individual data records). Primarily, the contribution lies in the combination of the data selection tool with the traditional parallel coordinate diagram and the creation of an easy-to-use visual analytics system. See Figure 24. The tool primarily uses parallel coordinates [189] but introduces a hierarchical tree nature to the data [190]. Using the two together, brushing and linking is also incorporated [191].
Hybrid Web-scrape (CF)
In the following, many research papers use web-scraped data to visualise customer feedback.
Ziegler et al. [39] presented a system that analyses textual customer feedback data from an unspecified online feedback website. The system uses clustering techniques to analyse short segments of data-mined text to provide a quantitative context for customer feedback. Treemaps are then used to convey these data and the nodes are automatically labelled. See Figure 25.
The top view of the visual layout provides an overview of the most frequently cited topics and issues by presenting them in clustered treemap nodes. Colour is mapped to sentiment and the size of the nodes is mapped to the volume of feedback within a given cluster. Treemap nodes are formed from clusters of similar feedback. These nodes are labelled by the groups of words found within the clusters. To ensure that the labels are legible, the orientation of the label is rotated to match its longest axis.
Twenty-three people were shown the system and were asked if they were more confident with the treemap or being presented the data in a list format. Fifteen opted for the treemap while six indicated they preferred lists. Two users were indifferent. This supports the use of visual interfaces in a business data analysis environment. The treemap design and layout is taken from Bederson et al. [127]. The textual analysis and clustering is based on the work of Ponte et al. [192].
Oelke et al. presented an approach to visually analyse large quantities of customer review data [40] scraped from online sources. The research takes a holistic approach to calculate the customers’ opinions, breaking down each component attributed to the product and producing an overall product score. The visual designs enable quick overviews to be made of the data as well as clustered comparisons of similar reviews.
The visual summary reports offer an overview of the customer feedback. Using a matrix grid that compares multiple products against a range of features, the design enables the viewer to look at either the most favourable product or their most valued attribute to inform their purchasing decision. See Figure 26. The cluster analysis uses 2D scatterplots to categorise the reviewers. The table sizes vary depending on the number of people within a cluster.
Chord diagram and parallel coordinate hybrid plots are used to show a detailed view of the data. The Hybrid can be used to highlight correlations between different attributes of the customer feedback. The left half of the chord circle shows the values for each product attribute and the right half shows the product score. Edges that connect the two join via a centre axis that represents each product. Filtering processes enable the user to identify trends and observe the customer opinion of each product.
Previously, Gamon et al. presented Pulse, a clustered visualisation technique for displaying customer review data. This calculates the average review per cluster and incorporates a treemap [193]. Gregory et al. focused on sentiment analysis but did not only calculate a positive or negative outcome. Instead, they identified more detailed thoughts such as pleasure, pain, power, conflict, etc. These data are rendered primarily through radial plotting methods such as the rose plot [194].
Wu et al. presented OpinionSeer, interactive software that presents customer feedback of hotels [41]. The opinion data are mined from Trip Advisor, a popular venue review website. The main focus of this visualisation is the opinion wheel. See Figure 27 on page 41.
The vertices of the opinion triangle represent the reviewer’s disbelief, uncertainty, and belief. The three component values are weighted so that one coordinate can be plotted to represent the value for all the variables. This triangle lies at the centre of the OpinionSeer. The software offers multiple options for the ring of the radial layout. Some discretise the ring into sections representing the age demographic of the reviewer and then colour the section according to the average scores by the reviewers. Some use a layering system to present the same information and variations of these to present the demographic of reviewers along with the review data. The interactive software is designed such that users may analyse the data at different levels of detail. The user can focus on one aspect of the hotel service and compare these, or rather look at the hotel overview data. In addition to the opinion triangle and rings, a word cloud is used to analyse the textual customer feedback data.
Previous work in the field often uses standardised bar charts to present customer feedback data [195]. Scatter plots have been suggested to present positive/negative customer data [196]. Similar software systems have been created but are less flexible and are not as versatile [40,195].
Hao et al. utilised the abundant resource of social media feedback by analysing the customer reception of products worldwide [42]. The customer sentiment is analysed from the text data and then visualised using a geo-temporal map.
The data are mined from Twitter due to the ease of access, quality of meta-data such as location, etc., subject availability from hashtags and concise messages limited to 140 characters. Given that the text streams are unpredictable, each noun or compound-noun in the message is run through sentiment analysis algorithms and an average sentiment value is derived for each message [197]. Once the sentiment is quantified, the values can be mapped (depending on the quality of information) to a geo-spatial heat map. In addition to the geo-map, a matrix plot-like view can visualise the location against the days in a month. This temporal view can show the change in product sentiment over time.
The analysis of Twitter data is thoroughly studied [198], as is sentiment analysis from text data [199]. Popescu and Etzitoni proposed a noun filtering method for text analysis so that message noise is removed [200]. More semantic rules were developed to improve the analysis quality from the data [201,202]. Feature-based sentiment visualisation was developed for customer feedback streams [197] and forms the basis of Hao et al.’s research. Saga and Yagi researched network visualisation of customer expectation through use of a web crawler that collects feedback data from the search engine Bing [46]. The results are automatically collated into an expectation network which presents words from the feedback as nodes in the network and the connecting edges represent the relationships between the words. The case study in this paper explores customer expectations for coffee products, and how different segments of customers prioritise different qualities in the coffee such as bitter or richness. The network provides a holistic viewpoint from multiple customer perspectives.
4. Discussion and Observations
Throughout this survey, we examine the trends and driving forces behind business-oriented visualisation. We identify a range of varying classifying features for the research (see Table 1 and Table 5). Ultimately, the goal for businesses is to generate a profit. This can be done through improving the efficiency of internal processes (internal intelligence), identifying the actions of competition (external intelligence and business ecosystem), or improving business-customer relationships and therefore increasing sales (customer feedback and customer behaviour) [90,94].
The most popular data source was from pre-existing databases showing business ecosystem data. Rahul C. Basole is a significant contributor to this field, who is associated with over half of the papers in this collection.
The second most popular primary data source was used in the field of internal intelligence, demonstrating the relative affordability of internally generated data for the purpose of research. This is often qualitative study data [18,24] that evaluate certain operations of the business. Internal operations are more easily accessible than external operations, and so produce more research.
Customer-centric visualisation literature has seen a shift from customer feedback to customer behaviour research (see Table 5). Prior to 2011, five customer feedback visualisation papers were published in contrast to just one customer behaviour visualisation paper. Post-2011, just one customer feedback visualisation paper was published and six customer behaviour visualisation papers were published. We speculate that this decrease in feedback-driven analysis and increase in behavioural driven analysis is strongly related to the increasing availability of GPS data from devices such as smartphones. This idea is reinforced through the timeline by which smartphone GPS data started to be utilised in research [203,204]. The benefit of tracking customer behaviour over collecting customer feedback is that it provides an unbiased view of the consumer. Response bias can skew analysis and warps the decisions made based off of subjective data.
Our data classification reflects the business ethos of cost reduction. Primary data are expensive to collect, especially on a large scale. Even in the customer-centric fields where accurate, up-to-date information on the consumer is essential for successful business operations, we find that instead the researchers opt for web scraped data—sacrificing data quality for data quantity [205]. This sacrifice in quality for quantity might be attributed to the advancements in big data utilisation [206]. Instead of running costly studies and questionnaires that detail the thoughts and feelings of a smaller number of potential customers, a business can base their decisions on lower quality feedback from a large number of potential customers assuming that their data is representative of useful information and knowledge.
In the case of web scraping customer feedback, many data already exist publicly on the Internet. Creating a web scraper automates the collection and organisation process, substantially reducing the cost. While the quality may not be as high as primary data, the quantity often compensates for that [207]. No secondary data sources are used in the customer feedback classification, presumably due to the time-critical nature of customer interactions. A company would not wait until the data already exists to analyse their target market. In addition, the nature of these data is very niche, i.e., it is likely that the data would only be of use to one company.
Webscraped data are seldom used for business intelligence. This is interesting as it highlights the relative distrust companies have for this data regarding the operations of their business. Primary data would be trusted the most, and secondary data sources can at least be validated. However, the unknown nature of online data is enough to prevent companies from deriving actionable intelligence from it unless the data are in the form of customer feedback.
Secondary data sources are far more popular across most fields. Particularly in business ecosystem research, which overwhelmingly uses pre-existing databases—presumably due to the ease by which existing databases can be accessed—but also due to the broad utility of business ecosystem datasets (see Table 5). The data are often used as a case study or proof of concept for visualisation techniques where the emphasis is placed on the visualisation techniques and not the business insight. However, it is still important to observe how the business data are being utilised through visualisation. If the visual design is successful in presenting the data in a meaningful way, then insight should naturally follow.
Table 1 highlights some gaps and trends in the data sources used in the field of business visualisation. The most notable trend shows that customer feedback data are heavily dependent on webscraped sources. The table also shows a significant proportion of the data used in the research is not publicly available. While this may seem disappointing at first, it suggests that the data were explicitly made available to academic researchers or the research was performed by professionals in industry. This increases our confidence that the visual designs were created with the goal of business insight in mind as the work was, at least in part, collaborative.
We planned a classification that identified the target user for each visualisation, however, the majority of the research did not specify who would benefit from interpreting the visual designs. Assumptions could be made, but not without some subjective guesswork. This is interesting because an ill-defined target audience suggests the research to be mostly experimental and in its early stages of maturity. This suggests that, if successful, the field of business visualisation could experience more growth in the future once the effectiveness of the field has been validated.
Other attempted classifications were also stricken with similar issues. We also looked at the different industries with which the data were associated. However, few trends were available using this taxonomy and often the industry was difficult to classify due to vague descriptions—possibly due to businesses wanting to keep details of their data undisclosed. We also attempted a “visualisation type” classification that based the structure of the survey on the visualisation techniques used in each paper. Though the taxonomy was not particularly useful, we observed that older research was more inclined to use 3D visualisations with more recent publications focusing on two-dimensional graphics—although the data are not conclusive. This topic was discussed at the IEEE VIS 2014 conference during the “2D vs 3D” panel [208]. We already observe an increase in visualisation adoption (see Table 5 and Figure 28 on page 44) whereby newer publications are being published in non-visualisation journals, but still focus on visualisation [44,45,52,68,69,72,73]. This is a reliable indicator of adoption as business oriented journals are publishing visualisation centred papers.
5. Future Work
Among the most recently published of the literature, both Roberts et al. [51,53] and Wu et al. [67] visualised telecommunications data. The future work discussions in each of these papers emphasise the need for more features to be added to their software in an attempt to extract all the value from the data. Each additional useful feature provides the user with an advantage over their competition. This feature-rich desire is prevalent throughout the literature. We also observe the desire for deeper, more meaningful data evaluation in the future work of the field—quantitatively evaluating the current visual features and their impact on real-world scenario data [50,77]. The final outstanding action noted in the future work is to improve the current features that have been implemented [35,36].
Another interesting classification of the literature presented here could be based on user-tasks. We have identified this as future work. We also believe that a survey of machine learning techniques combined with visualisation is a promising direction for future work given the rise in popularity of machine learning. At present, commercial breakthroughs appear to be kept secret to provide a competitive edge. However, as the field evolves, it would make a good survey topic in itself.
These directions for future work highlight the differences between the academic and business agenda. Businesses will focus on the development of software with maximised utility, whether that involves focusing on current features and refining them or adding new features that complement the existing system. Academics place more emphasis on brand new ideas as opposed to finding the perfect existing solution to data problems. Therein lies the dichotomy of interest [1]. We also note the lack of literature focusing on company performance—this could be due to the classified nature of business performance whereby the company want to keep this information away from the public. We believe this is a direction rich in future work. As the availability of data increases, businesses will be more inclined to utilise the analytical potential of data visualisation.
As the field of data visualisation matures, we can expect more businesses to begin the adoption process. Early adopters of visualisation such as IBM [209] will enjoy a competitive advantage over the later adopters [210]. As the adoption rate increases, the field should advance at a faster rate due to higher levels of popularity and interest.
6. Conclusions
In this survey, we present a unique overview and insight into the development of business-oriented visualisation in academic research and beyond. We use a novel classification of literature that enables readers to understand the state-of-the-art in this field comprehensively. We have outlined trends in the research and discussed the potential future of visualisation within the business world. The survey provides a valuable resource for both the visualisation community and businesses interested in adopting visualisation approaches.
Author Contributions
R.C.R. researched and wrote this survey, closely supervised by R.S.L.
Funding
We would like to thank KESSII for their financial contributions towards this research. KESSII is part funded by the Welsh Government’s European Social Fund (ESF) convergence programme for West Wales and the Valleys.
Acknowledgments
We would like to thank Gary Smith, Paul Brookes, and Tony D’Cruze at QPC Ltd. for their support in this project both financially and with their business knowledge. Additionally, we would like to thank Dylan Rees, Joss Whittle, Liam McNabb, and Dave Greten for their contributions to the survey.
Conflicts of Interest
The authors declare no conflict of interest.
References
- Roberts, R.; Laramee, R.; Brookes, P.; Smith, G.A.; D’Cruze, T.; Roach, M.J. A Tale of Two Visions—Exploring the Dichotomy of Interest between Academia and Industry in Visualisation. In Proceedings of the 13th International Joint Conference on Computer Vision, Imaging and Computer Graphics Theory and Applications—Volume 3: IVAPP, Funchal, Portugal, 27–29 January 2018; SciTePress: Setúbal, Portugal, 2018; pp. 319–326. [Google Scholar] [CrossRef]
- Gentile, B. The Top 5 Business Benefits of Using Data Visualization. 2014. Available online: http://data-informed.com/top-5-business-benefits-using-data-visualization/ (accessed on 10 September 2018 ).
- Simon, P. The Visual Organization: Data Visualization, Big Data, and the Quest for Better Decisions, 1st ed.; Wiley Publishing: Hoboken, NJ, USA, 2014. [Google Scholar]
- Buja, A.; Cook, D.; Swayne, D.F. Interactive high-dimensional data visualization. J. Comput. Graph. Stat. 1996, 5, 78–99. [Google Scholar]
- Stimpert, J.L.; Duhaime, I.M. Seeing the big picture: The influence of industry, diversification, and business strategy on performance. Acad. Manag. J. 1997, 40, 560–583. [Google Scholar]
- Basole, R.; Drucker, S.; Kohlhammer, J.; Wijk, J.V.; Business. IEEE VIS. 2014. Available online: http://entsci.gatech.edu/businessvis14/ (accessed on 13 November 2018).
- Basole, R.; Drucker, S.; Kohlhammer, J.; Wijk, J.V. From Data to Actionable Business Insights. IEEE VIS. 2015. Available online: http://entsci.gatech.edu/businessvis15/ (accessed on 13 November 2018).
- CG&A, I. Business Intelligence Analytics - [Front cover]. IEEE Comput. Graph. Appl. 2014, 34, c1. [Google Scholar] [CrossRef]
- CG&A, I. New Department: Art on Graphics - IEEE CGA Call for Articles. IEEE Comput. Graph. Appl. 2014, 34, c2. [Google Scholar] [CrossRef]
- Murray, D.G. Tableau Your Data!: Fast and Easy Visual Analysis with Tableau Software; John Wiley & Sons: Hoboken, NJ, USA, 2013. [Google Scholar]
- Sisense. 2004. Available online: https://www.sisense.com/?source=capterra/ (accessed on 13 November 2018).
- Gartner. Gartner Says Business Intelligence and Analytics Need to Scale up to Support Explosive Growth in Data Sources. 2013. Available online: http://www.gartner.com/newsroom/id/2313915 (accessed on 13 November 2018).
- Etzkowitz, H.; Webster, A.; Healey, P. Capitalizing Knowledge: New Intersections of Industry and Academia; Suny Press: Albany, NY, USA, 1998. [Google Scholar]
- Ko, S.; Cho, I.; Afzal, S.; Yau, C.; Chae, J.; Malik, A.; Beck, K.; Jang, Y.; Ribarsky, W.; Ebert, D.S. A Survey on Visual Analysis Approaches for Financial Data. Comput. Graph. Forum 2016, 35, 599–617. [Google Scholar] [CrossRef]
- Grossmann, W.; Rinderle-Ma, S. Fundamentals of Business Intelligence; Springer: New York, NY, USA, 2015. [Google Scholar]
- Sherman, R. The Business Demand for Data, Information, and Analytics. In Business Intelligence Guidebook; Sherman, R., Ed.; Morgan Kaufmann: Boston, MA, USA, 2015; Chapter 1; pp. 3–19. [Google Scholar] [CrossRef]
- Jourdan, Z.; Rainer, R.K.; Marshall, T.E. Business intelligence: An analysis of the literature. Inf. Syst. Manag. 2008, 25, 121–131. [Google Scholar] [CrossRef]
- Kandel, S.; Paepcke, A.; Hellerstein, J.M.; Heer, J. Enterprise data analysis and visualization: An interview study. IEEE Trans. Vis. Comput. Graph. 2012, 18, 2917–2926. [Google Scholar] [CrossRef] [PubMed]
- Hao, M.C.; Keim, D.A.; Dayal, U. VisBiz: A Simplified Visualization of Business Operation. In Proceedings of the IEEE Visualization 2004, Austin, TX, USA, 10–15 October 2004. [Google Scholar] [CrossRef]
- Otsuka, R.; Yano, K.; Sato, N. An organization topographic map for visualizing business hierarchical relationships. In Proceedings of the 2009 IEEE Pacific Visualization Symposium, Beijing, China, 20–23 April 2009; pp. 25–32. [Google Scholar]
- Yaeli, A.; Bak, P.; Feigenblat, G.; Nadler, S.; Roitman, H.; Saadoun, G.; Ship, H.J.; Cohen, D.; Fuchs, O.; Ofek-Koifman, S.; et al. Understanding customer behavior using indoor location analysis and visualization. IBM J. Res. Dev. 2014, 58, 1–12. [Google Scholar] [CrossRef]
- Nagaoka, H.; Nakamura, T.; Nakagawa, T.; Kaneda, M. Development of Methods for Visualizing Customer Value in Terms of People and Management. Hitachi Rev. 2016, 65, 841. [Google Scholar]
- Burkhard, R.A. Strategy visualization: A new research focus in knowledge visualization and a case study. In Proceedings of the I-KNOW, Graz, Austria, 29 June–1 July 2005; Volume 5. [Google Scholar]
- Sedlmair, M.; Isenberg, P.; Baur, D.; Butz, A. Information visualization evaluation in large companies: Challenges, experiences and recommendations. Inf. Vis. 2011, 10, 248–266. [Google Scholar] [CrossRef] [Green Version]
- Aigner, W. Current Work Practice and Users’ Perspectives on Visualization and Interactivity in Business Intelligence. In Proceedings of the 2013 17th International Conference on Information Visualisation, London, UK, 16–18 July 2013; pp. 299–306. [Google Scholar] [CrossRef]
- Lafon, S.; Bouali, F.; Guinot, C.; Venturini, G. 3D and immersive interfaces for Business Intelligence: The case of OLAP. In Proceedings of the 2013 17th International Conference on Information Visualisation, London, UK, 16–18 July 2013; pp. 272–277. [Google Scholar]
- Bresciani, S.; Eppler, M.J. Beyond knowledge visualization usability: Toward a better understanding of business diagram adoption. In Proceedings of the 2009 13th International Conference Information Visualisation, Barcelona, Spain, 15–17 July 2009; pp. 474–479. [Google Scholar]
- Bertschi, S. Knowledge visualization and business analysis: meaning as media. In Proceedings of the 2009 13th International Conference Information Visualisation, Barcelona, Spain, 15–17 July 2009; pp. 480–485. [Google Scholar]
- Keahey, A. Feeding the Needs of Diverse Stakeholders for Enterprise Visualisation Systems. Keynote Talk at the Business Visualization Workshop held in conjunction with the IEEE VIS 2015 Conference, Chicago, IL, USA, 25 October 2015. [Google Scholar]
- Merino, C.S.; Sips, M.; Keim, D.A.; Panse, C.; Spence, R. Task-at-hand interface for change detection in stock market data. In Proceedings of the Working Conference on Advanced Visual Interfaces, Venezia, Italy, 23–26 May 2006; ACM: New York, NY, USA, 2006; pp. 420–427. [Google Scholar]
- Basole, R.C.; Huhtamäki, J.; Still, K.; Russell, M.G. Visual decision support for business ecosystem analysis. Expert Syst. Appl. 2016, 65, 271–282. [Google Scholar] [CrossRef]
- Dou, W.; Cho, I.; ElTayeby, O.; Choo, J.; Wang, X.; Ribarsky, W. DemographicVis: Analyzing demographic information based on user generated content. In Proceedings of the 2015 IEEE Conference on Visual Analytics Science and Technology (VAST), Chicago, IL, USA, 25–30 October 2015; pp. 57–64. [Google Scholar]
- Brodbeck, D.; Girardin, L. Visualization of large-scale customer satisfaction surveys using a parallel coordinate tree. In Proceedings of the IEEE Symposium on Information Visualization 2003 (IEEE Cat. No.03TH8714), Seattle, WA, USA, 19–21 October 2003; pp. 197–201. [Google Scholar] [CrossRef]
- Ramesh, G.; Rajinikanth, T.; Vasumathi, D. Explorative Data Visualization Using Business Intelligence and Data Mining Techniques. Int. J. Appl. Eng. Res. 2017, 12, 14008–14013. [Google Scholar]
- Lu, Y.; Wang, F.; Maciejewski, R. Business intelligence from social media: A study from the VAST box office challenge. IEEE Comput. Graph. Appl. 2014, 34, 58–69. [Google Scholar] [CrossRef] [PubMed]
- Shi, C.; Wu, Y.; Liu, S.; Zhou, H.; Qu, H. LoyalTracker: Visualizing Loyalty Dynamics in Search Engines. IEEE Trans. Vis. Comput. Graph. 2014, 20, 1733–1742. [Google Scholar] [CrossRef] [PubMed] [Green Version]
- Sijtsma, B.; Qvarfordt, P.; Chen, F. Tweetviz: Visualizing tweets for business intelligence. In Proceedings of the 39th International ACM SIGIR Conference on Research and Development in Information Retrieval, Pisa, Italy, 17–21 July 2016; ACM: New York, NY, USA, 2016; pp. 1153–1156. [Google Scholar]
- Chen, C.; Ibekwe-SanJuan, F.; SanJuan, E.; Weaver, C. Visual analysis of conflicting opinions. In Proceedings of the 2006 IEEE Symposium On Visual Analytics Science And Technology, Baltimore, MD, USA, 31 October– 2 November 2006; pp. 59–66. [Google Scholar]
- Ziegler, C.N.; Skubacz, M.; Viermetz, M. Mining and exploring unstructured customer feedback data using language models and treemap visualizations. In Proceedings of the 2008 IEEE/WIC/ACM International Conference on Web Intelligence and Intelligent Agent Technology—Volume 01, Sydney, Australia, 9–12 December 2008; pp. 932–937. [Google Scholar]
- Oelke, D.; Hao, M.; Rohrdantz, C.; Keim, D.A.; Dayal, U.; Haug, L.E.; Janetzko, H. Visual opinion analysis of customer feedback data. In Proceedings of the EEE Symposium on Visual Analytics Science and Technology, Atlantic City, NJ, USA, 12–13 October 2009; pp. 187–194. [Google Scholar]
- Wu, Y.; Wei, F.; Liu, S.; Au, N.; Cui, W.; Zhou, H.; Qu, H. OpinionSeer: Interactive Visualization of Hotel Customer Feedback. IEEE Trans. Vis. Comput. Graph. 2010, 16, 1109–1118. [Google Scholar] [CrossRef] [PubMed]
- Hao, M.C.; Rohrdantz, C.; Janetzko, H.; Keim, D.A.; Dayal, U.; Haug, L.E.; Hsu, M.; Stoffel, F. Visual sentiment analysis of customer feedback streams using geo-temporal term associations. Inf. Vis. 2013, 12, 273–290. [Google Scholar] [CrossRef] [Green Version]
- Saitoh, F. Visualization of online customer reviews and evaluations based on Self-organizing Map. In Proceedings of the 2014 IEEE International Conference on Systems, Man and Cybernetics (SMC), San Diego, CA, USA, 5–8 October 2014; pp. 176–181. [Google Scholar]
- Fayoumi, A.; Jackson, C.; Lewis, C.; Straw, J.; Sharpe, J.; Nicol, D. What They Are Tweeting About Me? Social Media Data Analytics with Geographical Visualisation. Available online: https://www.researchgate.net/publication/314237420_What_They_Are_Tweeting_About_Me_Social_Media_Data_Analytics_with_Geographical_Visualisation (accessed on 17 November 2018).
- Haleem, M.; Sobeih, T.; Liu, Y.; Soroka, A.; Han, L. An Automated Cloud-based Big Data Analytics Platform for Customer Insights. In Proceedings of the Conference on International Conference on Cyber, Physical and Social Computing (CPSCom), Exeter, UK, 21–23 June 2018; pp. 287–292. [Google Scholar]
- Saga, R.; Yagi, T. Network visualization of customer expectation using Web in coffee service. Artif. Life Robot. 2018, 23, 213–217. [Google Scholar] [CrossRef]
- Wright, W. Business visualization applications. IEEE Comput. Graph. Appl. 1997, 17, 66–70. [Google Scholar] [CrossRef]
- Vliegen, R.; van Wijk, J.J.; Van der Linden, E.J. Visualizing business data with generalized treemaps. IEEE Trans. Vis. Comput. Graph. 2006, 12, 789–796. [Google Scholar] [CrossRef] [PubMed]
- Bai, X.; White, D.; Sundaram, D. Context adaptive visualization for effective business intelligence. In Proceedings of the 2013 15th IEEE International Conference on Communication Technology (ICCT), Guilin, China, 17–19 November 2013; pp. 786–790. [Google Scholar]
- Nicholas, M.; Archambault, D.; Laramee, R.S. Interactive Visualisation of Automotive Warranty Data Using Novel Extensions of Chord Diagrams. Comput. Graph. Forum 2014. [Google Scholar] [CrossRef]
- Roberts, R.C.; Tong, C.; Laramee, R.S.; Smith, G.A.; Brookes, P.; D’Cruze, T. Interactive Analytical Treemaps for Visualisation of Call Centre Data. In Proceedings of the Smart Tools and Apps for Graphics-Eurographics Italian Chapter Conference, Genova, Italy, 3–4 October 2016; Pintore, G., Stanco, F., Eds.; The Eurographics Association: Aire-la-Ville, Switzerland, 2016. [Google Scholar] [CrossRef]
- Kumar, S.; Belwal, M. Performance dashboard: Cutting-edge business intelligence and data visualization. In Proceedings of the 2017 International Conference on Smart Technologies For Smart Nation (SmartTechCon), Bangalore, India, 17–19 August 2017; pp. 1201–1207. [Google Scholar]
- Roberts, R.; Laramee, R.S.; Smith, G.A.; Brookes, P.; D’Cruze, T. Smart Brushing for Parallel Coordinates. IEEE Trans. Vis. Comput. Graph. 2018. [Google Scholar] [CrossRef] [PubMed]
- Ferreira, N.; Poco, J.; Vo, H.T.; Freire, J.; Silva, C.T. Visual exploration of big spatio-temporal urban data: A study of new york city taxi trips. IEEE Trans. Vis. Comput. Graph. 2013, 19, 2149–2158. [Google Scholar] [CrossRef] [PubMed]
- Wattenberg, M. Visualizing the stock market. In Proceedings of the CHI’99 Extended Abstracts on Human Factors in Computing Systems, Pittsburgh, PA, USA, 15–20 May 1999; ACM: New York, NY, USA, 1999; pp. 188–189. [Google Scholar]
- Wu, E.; Phillips, P. Financial Markets in Motion: Visualising stock price and news interactions during the 2008 global financial crisis. Procedia Comput. Sci. 2010, 1, 1765–1773. [Google Scholar] [CrossRef]
- Basole, R.C.; Hu, M.; Patel, P.; Stasko, J.T. Visual Analytics for Converging-Business-Ecosystem Intelligence. IEEE Comput. Graph. Appl. 2012, 32, 92–96. [Google Scholar] [CrossRef] [PubMed]
- Basole, R.C.; Clear, T.; Hu, M.; Mehrotra, H.; Stasko, J. Understanding interfirm relationships in business ecosystems with interactive visualization. IEEE Trans. Vis. Comput. Graph. 2013, 19, 2526–2535. [Google Scholar] [CrossRef] [PubMed]
- Deligiannidis, L.; Noyes, E. Interactive Visualization of Business Births and Deaths in the US Economy using a Novel Visualization Technique Called HiFi Pie. In Proceedings of the International Conference on Information and Knowledge Engineering (IKE), Las Vegas, NV, USA, 21–24 July 2014. [Google Scholar]
- Basole, R.C.; Russell, M.G.; Huhtamäki, J.; Rubens, N.; Still, K.; Park, H. Understanding business ecosystem dynamics: A data-driven approach. ACM Trans. Manag. Inf. Syst. 2015, 6, 6. [Google Scholar] [CrossRef]
- Iyer, B.R.; Basole, R.C. Visualization to understand ecosystems. Commun. ACM 2016, 59, 27–30. [Google Scholar] [CrossRef]
- Schotter, A.P.; Buchel, O.; Vashchilko, T. Interactive visualization for research contextualization in international business. J. World Bus. 2017, 53, 356–372. [Google Scholar] [CrossRef]
- Basole, R.C.; Srinivasan, A.; Park, H.; Patel, S. Ecoxight: Discovery, Exploration, and Analysis of Business Ecosystems Using Interactive Visualization. ACM Trans. Manag. Inf. Syst. 2018, 9, 6. [Google Scholar] [CrossRef]
- Woo, J.Y.; Bae, S.M.; Park, S.C. Visualization method for customer targeting using customer map. Expert Syst. Appl. 2005, 28, 763–772. [Google Scholar] [CrossRef]
- Hanafizadeh, P.; Mirzazadeh, M. Visualizing market segmentation using self-organizing maps and Fuzzy Delphi method—ADSL market of a telecommunication company. Expert Syst. Appl. 2011, 38, 198–205. [Google Scholar] [CrossRef]
- Kameoka, Y.; Yagi, K.; Munakata, S.; Yamamoto, Y. Customer segmentation and visualization by combination of self-organizing map and cluster analysis. In Proceedings of the 2015 13th International Conference on ICT and Knowledge Engineering, Bangkok, Thailand, 18–20 November 2015; pp. 19–23. [Google Scholar]
- Wu, W.; Xu, J.; Zeng, H.; Zheng, Y.; Qu, H.; Ni, B.; Yuan, M.; Ni, L.M. TelCoVis: Visual Exploration of Co-occurrence in Urban Human Mobility Based on Telco Data. IEEE Trans. Vis. Comput. Graph. 2016, 22, 935–944. [Google Scholar] [CrossRef] [PubMed]
- Sathiyanarayanan, M.; Turkay, C.; Fadahunsi, O. Design and implementation of small multiples matrix-based visualisation to monitor and compare email socio-organisational relationships. In Proceedings of the 2018 10th International Conference on Communication Systems & Networks (COMSNETS), Bengaluru, India, 3–7 January 2018; pp. 643–648. [Google Scholar]
- Kang, S.; Kim, E.; Shim, J.; Cho, S.; Chang, W.; Kim, J. Mining the relationship between production and customer service data for failure analysis of industrial products. Comput. Ind. Eng. 2017, 106, 137–146. [Google Scholar] [CrossRef]
- Du, X.; Gu, C.; Zhu, N. A survey of business process simulation visualization. In Proceedings of the 2012 International Conference on Quality, Reliability, Risk, Maintenance, and Safety Engineering (ICQR2MSE), Chengdu, China, 15–18 June 2012; pp. 43–48. [Google Scholar]
- Broeksema, B.; Baudel, T.; Telea, A.; Crisafulli, P. Decision exploration lab: A visual analytics solution for decision management. IEEE Trans. Vis. Comput. Graph. 2013, 19, 1972–1981. [Google Scholar] [CrossRef] [PubMed]
- Ghooshchi, N.G.; Van Beest, N.; Governatori, G.; Olivieri, F.; Sattar, A. Visualisation of compliant declarative business processes. In Proceedings of the 2017 IEEE 21st International Enterprise Distributed Object Computing Conference (EDOC), Quebec City, QC, Canada, 10–13 October 2017; pp. 89–94. [Google Scholar]
- Bachhofner, S.; Kis, I.; Di Ciccio, C.; Mendling, J. Towards a Multi-parametric Visualisation Approach for Business Process Analytics. In International Conference on Advanced Information Systems Engineering; Springer: Cham, Switzerland, 2017; pp. 85–91. [Google Scholar]
- Lea, B.R.; Yu, W.B.; Min, H. Data visualization for assessing the biofuel commercialization potential within the business intelligence framework. J. Clean. Prod. 2018, 188, 921–941. [Google Scholar] [CrossRef]
- Hao, M.C.; Keim, D.A.; Dayal, U.; Schneidewind, J. Business process impact visualization and anomaly detection. Inf. Vis. 2006, 5, 15–27. [Google Scholar] [CrossRef]
- Basole, R.C. Visual Business Ecosystem Intelligence: Lessons from the Field. IEEE Comput. Graph. Appl. 2014, 34, 26–34. [Google Scholar] [CrossRef] [PubMed]
- Basole, R.C.; Bellamy, M.A. Visual analysis of supply network risks: Insights from the electronics industry. Decis. Support Syst. 2014, 67, 109–120. [Google Scholar] [CrossRef]
- Gresh, D.L.; Kelton, E.I. Visualization, optimization, business strategy: A case study. In Proceedings of the IEEE Visualization (VIS 2003), Seattle, WA, USA, 19–24 October 2003; pp. 531–538. [Google Scholar]
- Eick, S.G. eBusiness Click Stream Analysis. In Data Visualization; Springer: Boston, MA, USA, 2003; pp. 185–199. [Google Scholar]
- Keim, D.A.; Hao, M.C.; Dayal, U.; Lyons, M. Value-Cell Bar Charts for Visualizing Large Transaction Data Sets. IEEE Trans. Vis. Comput. Graph. 2007, 13, 822–833. [Google Scholar] [CrossRef] [PubMed] [Green Version]
- Liu, D.; Weng, D.; Li, Y.; Bao, J.; Zheng, Y.; Qu, H.; Wu, Y. SmartAdP: Visual Analytics of Large-scale Taxi Trajectories for Selecting Billboard Locations. IEEE Trans. Vis. Comput. Graph. 2016, 23, 1–10. [Google Scholar] [CrossRef] [PubMed]
- Otjacques, B.; Cornil, M.; Feltz, F. Using ellimaps to visualize business data in a local administration. In Proceedings of the 2009 13th International Conference Information Visualisation, Barcelona, Spain, 15–17 July 2009; pp. 235–240. [Google Scholar]
- Ko, S.; Maciejewski, R.; Jang, Y.; Ebert, D.S. MarketAnalyzer: An Interactive Visual Analytics System for Analyzing Competitive Advantage Using Point of Sale Data. Comput. Graph. Forum 2012, 31, 1245–1254. [Google Scholar] [CrossRef]
- Rodden, K. Applying a Sunburst Visualization to Summarize User Navigation Sequences. IEEE Comput. Graph. Appl. 2014, 34, 36–40. [Google Scholar] [CrossRef] [PubMed]
- Nair, S.G.; Abdulla, N.; Gazzali, Z.A.M.; Khade, A.; Nair, S.G.; Abdulla, N.; Gazzali, Z.A.M.; Khade, A. Measure Customer Behaviour Using C4. 5 Decision Tree Mapreduce Implementation in Big Data Analytics and Data Visualization. Int. J. 2015, 1, 228–235. [Google Scholar]
- Moore, J.F. The Death of Competition: Leadership and Strategy in the Age of Business Ecosystems; HarperCollins Publishers: New York, NY, USA, 1996. [Google Scholar]
- Rothschild, M. Bionomics: Economy as Business Ecosystem; Beard Books: Washington, DC, USA, 2004. [Google Scholar]
- Homburg, C.; Workman, J.P.; Jensen, O. Fundamental changes in marketing organization: The movement toward a customer-focused organizational structure. J. Acad. Mark. Sci. 2000, 28, 459–478. [Google Scholar] [CrossRef]
- Rodriguez, J.; Kaczmarek, P. Visualizing Financial Data; John Wiley & Sons: Hoboken, NJ, USA, 2016. [Google Scholar]
- LeHung, H.; Howard, C.; Gaughan, D.; Logan, D. Building a Digital Business Technology Platform; Technical Report. Available online: https://www.gartner.com/binaries/content/assets/events/keywords/symposium/esc28/esc28_digitalbusiness.pdf (accessed on 15 November 2018).
- McAfee, A.; Brynjolfsson, E.; Davenport, T.H.; Patil, D.J.; Barton, D. Big data: The management revolution. Harvard Bus. Rev. 2012, 90, 60–68. [Google Scholar]
- Bean, R. How Companies Say They’re Using Big Data. 2017. Available online: https://hbr.org/2017/04/how-companies-say-theyre-using-big-data (accessed on 13 November 2018).
- Chen, H.; Chiang, R.H.; Storey, V.C. Business intelligence and analytics: From big data to big impact. MIS Q. 2012, 36, 1165–1188. [Google Scholar] [CrossRef]
- Buluswar, M. How Companies Are Using Big Data and Analytics. 2016. Available online: https://www.mckinsey.com/business-functions/mckinsey-analytics/our-insights/how-companies-are-using-big-data-and-analytics (accessed on 13 November 2018).
- Delmater, R.; Hancock, M.; Hankcock, M. Data Mining Explained: A Manager’s Guide to Customer-Centric Business Intelligence; Digital Press Woburn: Boston, MA, USA, 2001. [Google Scholar]
- Linoff, G.S.; Berry, M.J. Data Mining Techniques: For Marketing, Sales, and Customer Relationship Management; John Wiley & Sons: Hoboken, NJ, USA, 2011. [Google Scholar]
- Cohn, D.; Hull, R. Business artifacts: A data-centric approach to modeling business operations and processes. IEEE Data Eng. Bull. 2009, 32, 3–9. [Google Scholar]
- Moore, J.F. Business ecosystems and the view from the firm. Antitrust Bull. 2006, 51, 31–75. [Google Scholar] [CrossRef]
- Hox, J.J.; Boeije, H.R. Data collection, primary vs. secondary. Encycl. Soc. Meas. 2005, 1, 593–599. [Google Scholar]
- Isenberg, P.; Heimerl, F.; Koch, S.; Isenberg, T.; Xu, P.; Stolper, C.; Sedlmair, M.; Chen, J.; Möller, T.; Stasko, J. Visualization Publication Dataset. 2015. Available online: http://vispubdata.org/ (accessed on 13 November 2018).
- Laramee, R.S. How to read a visualization research paper: Extracting the essentials. IEEE Comput. Graph. Appl. 2011, 31, 78–82. [Google Scholar] [CrossRef] [PubMed]
- Ashraf, S.; Khan, S.A. Visualizations-based analysis of Telco data for business intelligence. In Proceedings of the 2015 6th IEEE International Conference on Software Engineering and Service Science (ICSESS), Beijing, China, 23–25 September 2015; pp. 242–246. [Google Scholar]
- Nagai, A.; Tsuboi, T.; Ito, T. Prototype of New Business Process Visualization Tool. In Proceedings of the 2012 IEEE/WIC/ACM International Joint Conferences on Web Intelligence and Intelligent Agent Technology—Volume 03, Macau, China, 4–7 December 2012; pp. 367–372. [Google Scholar]
- Wu, Y.; Liu, S.; Yan, K.; Liu, M.; Wu, F. Opinionflow: Visual analysis of opinion diffusion on social media. IEEE Trans. Vis. Comput. Graph. 2014, 20, 1763–1772. [Google Scholar] [CrossRef] [PubMed]
- Wanner, F.; Stoffel, A.; Jäckle, D.; Kwon, B.; Weiler, A.; Keim, D.A. State-of-the-Art Report of Visual Analysis for Event Detection in Text Data Streams. In Proceedings of the EuroVis 2014: The Eurographics Conference on Visualization, Swansea, UK, 9–13 June 2014; Eurographics Association: Aire-la-Ville, Switzerland, 2014; pp. 125–139. [Google Scholar] [CrossRef]
- McNabb, L.; Laramee, R.S. Survey of Surveys (SoS)—Mapping The Landscape of Survey Papers in Information Visualization. Comput. Graph. Forum 2017, 36, 589–617. [Google Scholar] [CrossRef]
- Zhang, L.; Stoffel, A.; Behrisch, M.; Mittelstadt, S.; Schreck, T.; Pompl, R.; Weber, S.; Last, H.; Keim, D. Visual analytics for the big data era—A comparative review of state-of-the-art commercial systems. In Proceedings of the 2012 IEEE Conference on Visual Analytics Science and Technology (VAST), Seattle, WA, USA, 14–19 October 2012; pp. 173–182. [Google Scholar]
- Thomas, J.J.; Cook, K.A. A visual analytics agenda. IEEE Comput. Graph. Appl. 2006, 26, 10–13. [Google Scholar] [CrossRef] [PubMed]
- Keim, D.; Kohlhammer, J.; Ellis, G.; Mansmann, F. Mastering the Information Age Solving Problems with Visual Analytics; Eurographics Associatio: Goslar, Germany, 2010; Volume 2, p. 5. [Google Scholar]
- Jankun-Kelly, T.; Ma, K.L. MoireGraphs: Radial focus+ context visualization and interaction for graphs with visual nodes. In Proceedings of the IEEE Symposium on Information Visualization (INFOVIS 2003), Seattle, WA, USA, 19–21 October 2003; pp. 59–66. [Google Scholar]
- Furnas, G.W.; Zacks, J. Multitrees: Enriching and reusing hierarchical structure. In Proceedings of the SIGCHI Conference on Human Factors in Computing Systems, Boston, MA, USA, 24–28 April 1994; ACM: New York, NY, USA, 1994; pp. 330–336. [Google Scholar]
- Robertson, G.G.; Mackinlay, J.D.; Card, S.K. Cone trees: Animated 3D visualizations of hierarchical information. In Proceedings of the SIGCHI Conference on Human Factors in Computing Systems, New Orleans, LA, USA, 27 April–2 May 1991; ACM: New York, NY, USA, 1991; pp. 189–194. [Google Scholar]
- Adar, E. GUESS: A language and interface for graph exploration. In Proceedings of the SIGCHI Conference on Human Factors in Computing Systems, Montréal, QC, Canada, 22–27 April 2006; ACM: New York, NY, USA, 2006; pp. 791–800. [Google Scholar]
- Heer, J.; Boyd, D. Vizster: Visualizing online social networks. In Proceedings of the IEEE Symposium on Information Visualization (INFOVIS 2005), Minneapolis, MN, USA, 23–25 October 2005; pp. 32–39. [Google Scholar]
- Tory, M.; Staub-French, S. Qualitative analysis of visualization: A building design field study. In Proceedings of the 2008 Workshop on BEyond Time and Errors: Novel Evaluation Methods for Information Visualization, Florence, Italy, 5 April 2008; ACM: New York, NY, USA, 2008; p. 7. [Google Scholar]
- González, V.; Kobsa, A. A workplace study of the adoption of information visualization systems. In Proceedings of the I-KNOW, Graz, Austria, 2003; Volume 3, pp. 92–102. [Google Scholar]
- González, V.; Kobsa, A. Benefits of information visualization systems for administrative data analysts. In Proceedings of the Seventh International Conference on Information Visualization (IV 2003), London, UK, 18 July 2003; pp. 331–336. [Google Scholar] [Green Version]
- chul Kwon, B.; Fisher, B.; Yi, J.S. Visual analytic roadblocks for novice investigators. In Proceedings of the 2011 IEEE Conference on Visual Analytics Science and Technology (VAST), Providence, RI, USA, 23–28 October 2011; pp. 3–11. [Google Scholar]
- Chin, G., Jr.; Kuchar, O.A.; Wolf, K.E. Exploring the analytical processes of intelligence analysts. In Proceedings of the SIGCHI Conference on Human Factors in Computing Systems, Boston, MA, USA, 4–9 April 2009; ACM: New York, NY, USA, 2009; pp. 11–20. [Google Scholar]
- Kang, Y.a.; Gorg, C.; Stasko, J. Evaluating visual analytics systems for investigative analysis: Deriving design principles from a case study. In Proceedings of the IEEE Symposium on Visual Analytics Science and Technology (VAST 2009), Atlantic City, NJ, USA, 12–13 October 2009; pp. 139–146. [Google Scholar]
- Kaplan, R.S.; Norton, D.P. Strategy Maps: Converting Intangible Assets Into Tangible Outcomes; Harvard Business Press: Cambridge, MA, USA, 2004. [Google Scholar]
- La Rooy, G. Charting Performance. NZ Business 2000, 14, 14–17. Available online: https://search-proquest-com.openathens-proxy.swan.ac.uk/docview/204494978?accountid=14680 (accessed on 17 November 2018).
- Harris, R.L. Information Graphics: A Comprehensive Illustrated Reference; Oxford University Press: Oxford, UK, 1996. [Google Scholar]
- Johnson, B.; Shneiderman, B. Tree-maps: A space-filling approach to the visualization of hierarchical information structures. In Proceedings of the IEEE Conference on Visualization’91, San Diego, CA, USA, 22–25 October 1991; pp. 284–291. [Google Scholar]
- Balzer, M.; Deussen, O.; Lewerentz, C. Voronoi treemaps for the visualization of software metrics. In Proceedings of the 2005 ACM Symposium on Software Visualization, St. Louis, MO, USA, 14–15 May 2005; ACM: New York, NY, USA, 2005; pp. 165–172. [Google Scholar]
- Bruls, M.; Huizing, K.; van Wijk, J. Squarified Treemaps. In Data Visualization; de Leeuw, W., van Liere, R., Eds.; Springer: Vienna, Austria, 2000; pp. 33–42. [Google Scholar] [CrossRef]
- Bederson, B.B.; Shneiderman, B.; Wattenberg, M. Ordered and quantum treemaps: Making effective use of 2D space to display hierarchies. ACM Trans. Graph. 2002, 21, 833–854. [Google Scholar] [CrossRef] [Green Version]
- Bostock, M.; Ogievetsky, V.; Heer, J. D3 data-driven documents. IEEE Trans. Vis. Comput. Graph. 2011, 17, 2301–2309. [Google Scholar] [CrossRef] [PubMed]
- Kerren, A.; Jusufi, I. A novel radial visualization approach for undirected hypergraphs. In Proceedings of the Eurographics Conference on Visualisation (EuroVis’13), Leipzig, Germany, 17–21 Jun 2013; Short Paper. The Eurographics Association: Leipzig, Germany, 2013. [Google Scholar]
- Raja, A.; Mohsin, W.; Ehsan, N.; Mirza, E.; Saud, M. Impact of Emotional Intelligence and Work Attitude on Quality of Service in the Call Centre Industry of Pakistan. In Proceedings of the 2010 IEEE International Conference on Management of Innovation and Technology (ICMIT), Singapore, 2–5 June 2010; pp. 402–407. [Google Scholar]
- Bennington, L.; Cummane, J.; Conn, P. Customer satisfaction and call centers: An Australian study. Int. J. Serv. Ind. Manag. 2000, 11, 162–173. [Google Scholar] [CrossRef]
- Blanch, R.; Lecolinet, E. Browsing zoomable treemaps: Structure-aware multi-scale navigation techniques. IEEE Trans. Vis. Comput. Graph. 2007, 13, 1248–1253. [Google Scholar] [CrossRef] [PubMed]
- Zizi, M.; Beaudouin-Lafon, M. Accessing hyperdocuments through interactive dynamic maps. In Proceedings of the 1994 ACM European Conference on Hypermedia Technology, Edinburgh, UK, 19–23 September 1994; ACM: New York, NY, USA, 1994; pp. 126–135. [Google Scholar]
- Savikhin, A.; Lam, H.C.; Fisher, B.; Ebert, D.S. An experimental study of financial portfolio selection with visual analytics for decision support. In Proceedings of the 2011 44th Hawaii International Conference on System Sciences (HICSS), Kauai, HI, USA, 4–7 January 2011; pp. 1–10. [Google Scholar]
- Savikhin, A.; Maciejewski, R.; Ebert, D.S. Applied visual analytics for economic decision-making. In Proceedings of the IEEE Symposium on Visual Analytics Science and Technology, VAST’08, Columbus, OH, USA, 19–24 October 2008; pp. 107–114. [Google Scholar]
- Stolte, C.; Tang, D.; Hanrahan, P. Polaris: A system for query, analysis, and visualization of multidimensional relational databases. IEEE Trans. Vis. Comput. Graph. 2002, 8, 52–65. [Google Scholar] [CrossRef]
- Bosch, R.; Stolte, C.; Tang, D.; Gerth, J.; Rosenblum, M.; Hanrahan, P. Rivet: A flexible environment for computer systems visualization. ACM SIGGRAPH Comput. Graph. 2000, 34, 68–73. [Google Scholar] [CrossRef]
- Keim, D.; Kriegel, H.P. VisDB: Database exploration using multidimensional visualization. IEEE Comput. Graph. Appl. 1994, 14, 40–49. [Google Scholar] [CrossRef] [Green Version]
- Keim, D.; Hao, M.C.; Ladisch, J.; Hsu, M.; Dayal, U. Pixel bar charts: a new technique for visualizing large multi-attribute data sets without aggregation. In Proceedings of the IEEE Symposium on Information Visualization 2001, San Diego, CA, USA, 22–23 October 2001; pp. 113–120. [Google Scholar] [CrossRef] [Green Version]
- Ge, Y.; Xiong, H.; Tuzhilin, A.; Xiao, K.; Gruteser, M.; Pazzani, M. An energy-efficient mobile recommender system. In Proceedings of the 16th ACM SIGKDD International Conference on Knowledge Discovery and Data Mining, Washington, DC, USA, 25–28 July 2010; ACM: New York, NY, USA, 2010; pp. 899–908. [Google Scholar] [Green Version]
- Peng, C.; Jin, X.; Wong, K.C.; Shi, M.; Liò, P. Collective human mobility pattern from taxi trips in urban area. PLoS ONE 2012, 7, e34487. [Google Scholar]
- Phan, D.; Xiao, L.; Yeh, R.; Hanrahan, P. Flow map layout. In Proceedings of the IEEE Symposium on Information Visualization 2005, Minneapolis, MN, USA, 23–25 October 2005; pp. 219–224. [Google Scholar]
- Wood, J.; Dykes, J.; Slingsby, A. Visualisation of origins, destinations and flows with OD maps. Cartogr. J. 2010, 47, 117–129. [Google Scholar] [CrossRef]
- Malczewski, J. GIS-based multicriteria decision analysis: A survey of the literature. Int. J. Geogr. Inf. Sci. 2006, 20, 703–726. [Google Scholar] [CrossRef]
- Liu, H.; Gao, Y.; Lu, L.; Liu, S.; Qu, H.; Ni, L.M. Visual analysis of route diversity. In Proceedings of the 2011 IEEE Conference on Visual Analytics Science and Technology, Providence, RI, USA, 23–28 October 2011; pp. 171–180. [Google Scholar]
- Huang, X.; Zhao, Y.; Ma, C.; Yang, J.; Ye, X.; Zhang, C. TrajGraph: A graph-based visual analytics approach to studying urban network centralities using taxi trajectory data. IEEE Trans. Vis. Comput. Graph. 2016, 22, 160–169. [Google Scholar] [CrossRef] [PubMed]
- Chen, W.; Guo, F.; Wang, F.Y. A survey of traffic data visualization. IEEE Trans. Intell. Transp. Syst. 2015, 16, 2970–2984. [Google Scholar] [CrossRef]
- Keim, D.A. Information visualization and visual data mining. IEEE Trans. Vis. Comput. Graph. 2002, 8, 1–8. [Google Scholar] [CrossRef]
- Zhou, M.X.; Feiner, S.K. Visual task characterization for automated visual discourse synthesis. In Proceedings of the SIGCHI Conference on Human Factors in Computing Systems, Los Angeles, CA, USA, 18–23 April 1998; ACM Press/Addison-Wesley Publishing Co.: New York, NY, USA, 1998; pp. 392–399. [Google Scholar]
- IMDb—Internet Movie Database. Available online: https://www.imdb.com/ (accessed on 27 October 2018).
- Simonoff, J.S.; Sparrow, I.R. Predicting movie grosses: Winners and losers, blockbusters and sleepers. Chance 2000, 13, 15–24. [Google Scholar] [CrossRef]
- Zhang, W.; Skiena, S. Improving movie gross prediction through news analysis. In Proceedings of the 2009 IEEE/WIC/ACM International Joint Conference on Web Intelligence and Intelligent Agent Technology—Volume 01, Milan, Italy, 15–18 September 2009; pp. 301–304. [Google Scholar]
- Asur, S.; Huberman, B. Predicting the future with social media. In Proceedings of the 2010 IEEE/WIC/ACM International Conference on Web Intelligence and Intelligent Agent Technology (WI-IAT), Toronto, ON, Canada, 31 August–3 September 2010; Volume 1, pp. 492–499. [Google Scholar]
- Lux, M. Visualization of financial information. In Proceedings of the 1997 Workshop on New Paradigms in Information Visualization and Manipulation, Las Vegas, NV, USA, 10–14 November 1997; ACM: New York, NY, USA, 1997; pp. 58–61. [Google Scholar]
- Keim, D.A.; Nietzschmann, T.; Schelwies, N.; Schneidewind, J.; Schreck, T.; Ziegler, H. A Spectral Visualization System for Analyzing Financial Time Series Data. In Proceedings of the Eighth Joint Eurographics/IEEE VGTC Conference on Visualization, EUROVIS’06, Lisbon, Portugal, 8–10 May 2006; Eurographics Association: Aire-la-Ville, Switzerland, 2006; pp. 195–202. [Google Scholar] [CrossRef]
- Bastian, M.; Heymann, S.; Jacomy, M. Gephi: An open source software for exploring and manipulating networks. ICWSM 2009, 8, 361–362. [Google Scholar]
- Suntinger, M.; Obweger, H.; Schiefer, J.; Gröller, M.E. The event tunnel: Interactive visualization of complex event streams for business process pattern analysis. In Proceedings of the 2008 Visualization Symposium, PacificVIS’08, Kyoto, Japan, 5–7 March 2008; pp. 111–118. [Google Scholar]
- Burkhard, R.A. Towards a framework and a model for knowledge visualization: Synergies between information and knowledge visualization. In Knowledge and Information Visualization; Springer: Berlin/Heidelberg, Germany, 2005; pp. 238–255. [Google Scholar]
- Chung, W.; Chen, H.; Nunamaker, J. A visual knowledge map framework for the discovery of business intelligence on the web. J. Manag. Inf. Syst. 2005, 21, 57–84. [Google Scholar] [CrossRef]
- Lam, H.; Bertini, E.; Isenberg, P.; Plaisant, C.; Carpendale, S. Empirical studies in information visualization: Seven scenarios. IEEE Trans. Vis. Comput. Graph. 2012, 18, 1520–1536. [Google Scholar] [CrossRef] [PubMed]
- Airoldi, E.M.; Bai, X.; Carley, K.M. Network sampling and classification: An investigation of network model representations. Decis. Support Syst. 2011, 51, 506–518. [Google Scholar] [CrossRef] [PubMed] [Green Version]
- Bajaj, A.; Russell, R. AWSM: Allocation of workflows utilizing social network metrics. Decis. Support Syst. 2010, 50, 191–202. [Google Scholar] [CrossRef]
- Kiss, C.; Bichler, M. Identification of influencers—Measuring influence in customer networks. Decis. Support Syst. 2008, 46, 233–253. [Google Scholar] [CrossRef]
- Kuhlman, C.J.; Kumar, V.A.; Marathe, M.V.; Ravi, S.; Rosenkrantz, D.J. Finding critical nodes for inhibiting diffusion of complex contagions in social networks. In Machine Learning and Knowledge Discovery in Databases; Springer: Berlin/Heidelberg, Germany, 2010; pp. 111–127. [Google Scholar]
- Basole, R.C.; Bellamy, M.A. Global supply network health: Analysis and visualization. Manuf. Glob. Enterp. 2012, 11, 59–76. [Google Scholar]
- Edwards, R.D.; Magee, J.; Bassetti, W. Technical Analysis of Stock Trends; CRC Press: Boca Raton, FL, USA, 2007. [Google Scholar]
- Murphy, J.J. Technical Analysis of the Financial Markets: A Comprehensive Guide to Trading Methods and Applications; New York Institute of Finance: New York, NY, USA, 1999. [Google Scholar]
- Keim, D.A. Designing pixel-oriented visualization techniques: Theory and applications. IEEE Trans. Vis. Comput. Graph. 2000, 6, 59–78. [Google Scholar] [CrossRef]
- Borgo, R.; Proctor, K.; Chen, M.; Jänicke, H.; Murray, T.; Thornton, I.M. Evaluating the impact of task demands and block resolution on the effectiveness of pixel-based visualization. IEEE Trans. Vis. Comput. Graph. 2010, 16, 963–972. [Google Scholar] [CrossRef] [PubMed] [Green Version]
- Yada, K. String analysis technique for shopping path in a supermarket. J. Intell. Inf. Syst. 2011, 36, 385–402. [Google Scholar] [CrossRef]
- Takai, K.; Yada, K. A framework for analysis of the effect of time on shopping behavior. J. Intell. Inf. Syst. 2013, 41, 91–107. [Google Scholar] [CrossRef]
- Kosara, R.; Bendix, F.; Hauser, H. Parallel sets: Interactive exploration and visual analysis of categorical data. IEEE Trans. Vis. Comput. Graph. 2006, 12, 558–568. [Google Scholar] [CrossRef] [PubMed]
- Dou, W.; Wang, X.; Chang, R.; Ribarsky, W. Paralleltopics: A probabilistic approach to exploring document collections. In Proceedings of the 2011 IEEE Conference on Visual Analytics Science and Technology (VAST), Providence, RI, USA, 23–28 October 2011; pp. 231–240. [Google Scholar]
- Munroe, R. A History of United States Congress. 2018. Available online: https://xkcd.com/1127/ (accessed on 6 November 2018).
- Card, S.K.; Pirolli, P.; Van Der Wege, M.; Morrison, J.B.; Reeder, R.W.; Schraedley, P.K.; Boshart, J. Information scent as a driver of Web behavior graphs: Results of a protocol analysis method for Web usability. In Proceedings of the SIGCHI Conference on Human Factors in Computing Systems, Seattle, WA, USA, 2001; pp. 498–505. [Google Scholar]
- Pitkow, J.; Bharat, K.A. Webviz: A Tool For World-Wide Web Access Log Analysis. In Proceedings of the First International World-Wide Web Conference, Geneva, Switzerland, 1994; pp. 271–277. [Google Scholar]
- Waterson, S.J.; Hong, J.I.; Sohn, T.; Landay, J.A.; Heer, J.; Matthews, T. What did they do? understanding clickstreams with the WebQuilt visualization system. In Proceedings of the Working Conference on Advanced Visual Interfaces, Trento, Italy, 22–24 May 2002; ACM: New York, NY, USA, 2002; pp. 94–102. [Google Scholar]
- Guo, Q.; White, R.W.; Zhang, Y.; Anderson, B.; Dumais, S.T. Why searchers switch: understanding and predicting engine switching rationales. In Proceedings of the 34th International ACM SIGIR Conference on Research and Development in Information Retrieval, Beijing, China, 24–28 July 2011; ACM: New York, NY, USA, 2011; pp. 335–344. [Google Scholar]
- White, R.W.; Kapoor, A.; Dumais, S.T. Modeling Long-Term Search Engine Usage. In User Modeling, Adaptation, and Personalization; De Bra, P., Kobsa, A., Chin, D., Eds.; Springer: Berlin/Heidelberg, Germany, 2010; pp. 28–39. [Google Scholar]
- Diakopoulos, N.; Naaman, M.; Kivran-Swaine, F. Diamonds in the rough: Social media visual analytics for journalistic inquiry. In Proceedings of the 2010 IEEE Symposium on Visual Analytics Science and Technology (VAST), Salt Lake City, UT, USA, 25–26 October 2010; pp. 115–122. [Google Scholar]
- O’Connor, B.; Krieger, M.; Ahn, D. TweetMotif: Exploratory Search and Topic Summarization for Twitter. In Proceedings of the ICWSM, Washington, DC, USA, 23–26 May 2010; pp. 384–385. [Google Scholar]
- Deboeck, G.; Kohonen, T. Visual Explorations in Finance: With Self-Organizing Maps; Springer Science & Business Media: Berlin, Germany, 1998. [Google Scholar]
- Iacobucci, D.; Calder, B.J. Kellogg on Integrated Marketing; John Wiley & Sons: Hoboken, NJ, USA, 2003. [Google Scholar]
- Kohonen, T. Self-organized formation of topologically correct feature maps. Biol. Cybern. 1982, 43, 59–69. [Google Scholar] [CrossRef]
- Okoli, C.; Pawlowski, S.D. The Delphi method as a research tool: an example, design considerations and applications. Inf. Manag. 2004, 42, 15–29. [Google Scholar] [CrossRef] [Green Version]
- Deville, P.; Linard, C.; Martin, S.; Gilbert, M.; Stevens, F.R.; Gaughan, A.E.; Blondel, V.D.; Tatem, A.J. Dynamic population mapping using mobile phone data. Proc. Natl. Acad. Sci. USA 2014, 111, 15888–15893. [Google Scholar] [CrossRef] [PubMed] [Green Version]
- Krisp, J.M. Planning fire and rescue services by visualizing mobile phone density. J. Urban Technol. 2010, 17, 61–69. [Google Scholar] [CrossRef]
- Wang, Z.; Lu, M.; Yuan, X.; Zhang, J.; Van De Wetering, H. Visual traffic jam analysis based on trajectory data. IEEE Trans. Vis. Comput. Graph. 2013, 19, 2159–2168. [Google Scholar] [CrossRef] [PubMed]
- Inselberg, A.; Dimsdale, B. Parallel coordinates. In Human-Machine Interactive Systems; Springer: New York, NY, USA, 1991; pp. 199–233. [Google Scholar]
- Kleiberg, E.; van de Wetering, H.; Van Wijk, J.J. Botanical Visualization of Huge Hierarchies. In Proceedings of the IEEE Symposium on Information Visualization 2001 (INFOVIS’01), San Diego, CA, USA, 22–23 October 2001; IEEE Computer Society: Washington, DC, USA, 2001; p. 87. [Google Scholar]
- Becker, R.A.; Cleveland, W.S. Brushing scatterplots. Technometrics 1987, 29, 127–142. [Google Scholar] [CrossRef]
- Ponte, J.M.; Croft, W.B. A language modeling approach to information retrieval. In Proceedings of the 21st Annual International ACM SIGIR Conference on Research and Development in Information Retrieval, Melbourne, Australia, 24–28 August 1998; ACM: New York, NY, USA, 1998; pp. 275–281. [Google Scholar] [Green Version]
- Gamon, M.; Aue, A.; Corston-Oliver, S.; Ringger, E. Pulse: Mining customer opinions from free text. In Advances in Intelligent Data Analysis VI; Springer: Berlin/Heidelberg, Germany, 2005; pp. 121–132. [Google Scholar]
- Gregory, M.L.; Chinchor, N.; Whitney, P.; Carter, R.; Hetzler, E.; Turner, A. User-directed sentiment analysis: Visualizing the affective content of documents. In Proceedings of the Workshop on Sentiment and Subjectivity in Text, Sydney, Australia, 22 July 2006; Association for Computational Linguistics: Stroudsburg, PA, USA, 2006; pp. 23–30. [Google Scholar]
- Liu, B.; Hu, M.; Cheng, J. Opinion Observer: Analyzing and Comparing Opinions on the Web. In Proceedings of the 14th International Conference on World Wide Web, WWW ’05, Chiba, Japan, 10–14 May 2005; ACM: New York, NY, USA, 2005; pp. 342–351. [Google Scholar] [CrossRef]
- Pang, B.; Lee, L. Opinion Mining and Sentiment Analysis. Found. Trends Inf. Retr. 2008, 2, 1–135. [Google Scholar] [CrossRef] [Green Version]
- Rohrdantz, C.; Hao, M.C.; Dayal, U.; Haug, L.E.; Keim, D.A. Feature-based visual sentiment analysis of text document streams. ACM Trans. Intell. Syst. Technol. 2012, 3, 26. [Google Scholar] [CrossRef]
- Bifet, A.; Frank, E. Sentiment knowledge discovery in twitter streaming data. In International Conference on Discovery Science; Springer: Berlin/Heidelberg, Germany, 2010; pp. 1–15. [Google Scholar]
- Ding, X.; Liu, B.; Yu, P.S. A holistic lexicon-based approach to opinion mining. In Proceedings of the 2008 International Conference on Web Search and Data Mining, Palo Alto, CA, USA, 11–12 February 2008; ACM: New York, NY, USA, 2008; pp. 231–240. [Google Scholar]
- Popescu, A.M.; Etzioni, O. Extracting product features and opinions from reviews. In Natural Language Processing and Text Mining; Springer: London, UK, 2007; pp. 9–28. [Google Scholar]
- Ng, V.; Dasgupta, S.; Arifin, S. Examining the role of linguistic knowledge sources in the automatic identification and classification of reviews. In Proceedings of the COLING/ACL on Main Conference Poster Sessions, Sydney, Australia, 17–18 July 2006; Association for Computational Linguistics: Stroudsburg, PA, USA, 2006; pp. 611–618. [Google Scholar] [Green Version]
- Kisilevich, S.; Rohrdantz, C.; Keim, D. ’Beautiful picture of an ugly place”. Exploring photo collections using opinion and sentiment analysis of user comments. In Proceedings of the International Multiconference on Computer Science and Information Technology, Wisla, Poland, 18–20 October 2010; pp. 419–428. [Google Scholar] [CrossRef]
- Mok, E.; Retscher, G.; Wen, C. Initial test on the use of GPS and sensor data of modern smartphones for vehicle tracking in dense high rise environments. In Proceedings of the 2012 Ubiquitous Positioning, Indoor Navigation, and Location Based Service (UPINLBS), Helsinki, Finland, 3–4 October 2012; pp. 1–7. [Google Scholar] [CrossRef]
- Hwang, S.; Yu, D. GPS localization improvement of smartphones using built-in sensors. Int. J. Smart Home 2012, 6, 1–8. [Google Scholar]
- Granello, D.H.; Wheaton, J.E. Online data collection: Strategies for research. J. Couns. Dev. 2004, 82, 387–393. [Google Scholar] [CrossRef]
- Kaisler, S.; Armour, F.; Espinosa, J.A.; Money, W. Big Data: Issues and Challenges Moving Forward. In Proceedings of the 2013 46th Hawaii International Conference on System Sciences, Wailea, HI, USA, 7–10 January 2013; pp. 995–1004. [Google Scholar] [CrossRef]
- Johnson, T.; Dasu, T. Data Quality and Data Cleaning: An Overview. In Proceedings of the 2003 ACM SIGMOD International Conference on Management of Data, SIGMOD ’03, San Diego, CA, USA, 9–12 June 2003; ACM: New York, NY, USA, 2003; p. 681. [Google Scholar] [CrossRef]
- Hansen, C.; Laramee, R.S.; Miksch, S.; Meuller, K.; Preim, B.; Ware, C. 2D vs 3D [Panel]. Panel at IEEE VIS, 9–14 November 2014. Available online: http://ieeevis.org/year/2014/info/overview-amp-topics/accepted-panels (accessed on 15 November 2018).
- Viegas, F.B.; Wattenberg, M.; Van Ham, F.; Kriss, J.; McKeon, M. Manyeyes: A site for visualization at internet scale. IEEE Trans. Vis. Comput. Graph. 2007, 13, 1121–1128. [Google Scholar] [CrossRef] [PubMed]
- Brown, S.A.; Venkatesh, V. Model of adoption of technology in households: A baseline model test and extension incorporating household life cycle. MIS Q. 2005, 29, 399–426. [Google Scholar] [CrossRef]
Figure 1.
The top level hierarchical classification of the literature survey. Green classifications represent leaf nodes, while yellow represents umbrella classifications (see Section 1.1). Financial visualisation (red) is closely linked to this field, but has been published as a survey by Ko et al. [14].

Figure 2.
The differences between primary and secondary data sources in visualisation. Research involving primary data proposes the visualisation hypothesis before the data is collected (a priori hypothesis), hereas research involving secondary data proposes the visualisation hypothesis with the knowledge that the data has already been collected (a posteriori hypothesis). The hybrid pipeline contains two stages of data collection pre and post hypothesis. The initial creation of the data is often in the context of social media. At this point, the data are not collected to support the hypothesis posed by the visualisation research. Once the visualisation hypothesis is formulated, the data can then be scraped and collated into a second structured dataset for the purpose of visual research.

Figure 3.
The dendrographic representation of the hierarchical relationship. The higher up the member is, the closer to the centre their node is drawn. Clusters of users are highlighted in green. The dots represent individuals and are also given unique identification numbers. The dots are coloured by the role classification of the employee and the definition of the contours around the dots within each group highlight how well the group integrates. Image courtesy of Otsuka et al. [20].

Figure 4.
The transformation of the treemaps into other shapes: (a) the original treemap; (b) the original transformed into a pyramid but without density uniformity; (c) the modified version of (b) now adjusted to show uniform density; and (d) the transformation of the original into a pie chart. Image courtesy of Vliegen et al. [48].

Figure 5.
The extended chord diagram where glyphs are added to show the relationship between automotive component failure rates and customer satisfaction. Image courtesy of Nicholas et al. [50].
Figure 5.
The extended chord diagram where glyphs are added to show the relationship between automotive component failure rates and customer satisfaction. Image courtesy of Nicholas et al. [50].

Figure 6.
A focus + context treemap visualisation of call centre data: (a) all callers who have waited longer than 15 min in the queue but spoke to an agent for less than that period of time; (b) a combination of temporal and event based filters; (c) the increased queue time at the start of 13:00; and (d) all abandoned calls during the hour. Image courtesy of Roberts et al. [51].

Figure 7.
The sketch brush placement with the dynamic brush interval range glyphs which were automatically placed at 1 standard deviation from the mean. Image courtesy of Roberts et al. [53].
Figure 7.
The sketch brush placement with the dynamic brush interval range glyphs which were automatically placed at 1 standard deviation from the mean. Image courtesy of Roberts et al. [53].

Figure 8.
The decision map as an interactive analysis of variables of interest: (a) the analysts has selected the complete list of available attributes associated with drivers and then selected the age group bar chart to show where the clusters of age groups sit in the plot; (b) the simplified version where all non-contributing variables are removed; and (c) a breakdown of the decision process and classification of the “students” demographic. Image courtesy of Broeksema et al. [71].

Figure 9.
The Value-Cell bar chart. Each bar represents a month worth of sales. Within the bar, tiered sales values for each month are shown. The red tips of some bars represent outlying large sales during that time period. The colour legend shows the value of the transactions. The tiers blend together to create a gradation effect. Image courtesy of Keim et al. [80].

Figure 10.
The stakeholder visualisation requirements map. The x-axis ranges from “effective” to “attractive” and the y axis ranges from “simple” to “complex”. The marketing departments expectations of a visualisation rank highly in both complexity and attractiveness, but indicate less interest about its effectiveness. Image courtesy of Keahey [29].

Figure 11.
Taxi activity in Manhattan during the week of Hurricane Irene. Image courtesy of Ferreira et al. [54].
Figure 11.
Taxi activity in Manhattan during the week of Hurricane Irene. Image courtesy of Ferreira et al. [54].

Figure 12.
The BizViz visualisation. The left side of the circle shows each geographical region the data was collected from. Lines are drawn from each region to the centre line which holds a range denoting fraud value. From there, the line crosses over to the right axis where the fraud count is tallied. The user can select a region to drill down into and reveal comparisons of the fraud value vs. fraud count. Image courtesy of Hao et al. [19].

Figure 13.
The results table for the task evaluation. The “Charts” category scores highly, whereas the “Parallel Coordinates” scores relatively poorly. Evaluation criteria such as “Correlations” only scores highly in the “Charts” category. This shows the limitations of more elaborate visualisations, and the value of simplicity. Image courtesy of Merino et al. [30].

Figure 14.
The results of the study. Network outperforms the other two methods, but the matrix method provides a consistently quick and useful visual tool as well. Image courtesy of Basole et al. [31].
Figure 14.
The results of the study. Network outperforms the other two methods, but the matrix method provides a consistently quick and useful visual tool as well. Image courtesy of Basole et al. [31].

Figure 15.
The dotlink360 application. This network clusters firms by industry. The position of the nodes is based on the weight of their involvement within each of the industries listed around the perimeter. The user can select a firm to see their involvement with other companies within their ecosystem. Image courtesy of Basole et al. [57].

Figure 16.
The Path view in the connectivity perspective of the software. Clusters of companies can be seen as market segments where the links between nodes signify the company agreements. Image courtesy of Basole et al. [58].
Figure 16.
The Path view in the connectivity perspective of the software. Clusters of companies can be seen as market segments where the links between nodes signify the company agreements. Image courtesy of Basole et al. [58].

Figure 17.
The force-directed network visualisation of ecosystem convergence. The nodes represent market segments and edges show inter-firm relationships between the segments. Image courtesy of Basole [76].
Figure 17.
The force-directed network visualisation of ecosystem convergence. The nodes represent market segments and edges show inter-firm relationships between the segments. Image courtesy of Basole [76].

Figure 18.
A three tier supply network of a major electronics manufacturer. The inner layer represents the primary supply dependants of the manufacturer, the middle layer represents the secondary dependants (primary dependants for the inner circle of dependants), and the third layer represents the tertiary dependants (primary dependants of the middle layer of dependants). Image courtesy of Basole and Bellamy [77].

Figure 19.
The main window of MarketAnalyser. The left panel contains all the filtering options and colour legends. The main screen space conveys the pixel based comparisons, and the right ride panel contains the geographical view. The bottom panel contains the stacked bar view and time sliders. Image courtesy of Ko et al. [83].

Figure 20.
These designs show the path taken for typical high value and low value customers. It is immediately evident that high value customers are more methodical in their walking path, possibly with a specific product to purchase in mind. Low value customers are more likely to randomly choose the next route direction. Image courtesy of Yaeli et al. [21].

Figure 21.
(a) Parallel set + word cloud visualisation; and (b) the User Cluster visualisation. Image courtesy of Dou et al. [32].
Figure 21.
(a) Parallel set + word cloud visualisation; and (b) the User Cluster visualisation. Image courtesy of Dou et al. [32].

Figure 22.
The Flow View of the LoyalTracker software. The depth of each layer represents the level of loyalty the users portray. Curved lines are used to convey the inflow and outflow of customers for each loyalty layer. The flow shows a weeks worth of data for each cycle in the visual design. Image courtesy of Shi et al. [36].

Figure 23.
The contour-based treemap view: (a) the circular segmentation of time throughout the day; (b) the temporal contour of visits to a given location.; and (c) each sector represents a home location of the visitors during the time frame. Image courtesy of Wu et al. [67].
Figure 23.
The contour-based treemap view: (a) the circular segmentation of time throughout the day; (b) the temporal contour of visits to a given location.; and (c) each sector represents a home location of the visitors during the time frame. Image courtesy of Wu et al. [67].

Figure 24.
The three parallel coordinates represent each layer of the hierarchy. The file system tree-view below shows the data selection system where the user can choose subsets of the data to visualise [33]. Image courtesy of Broadbeck and Girardin [33].

Figure 25.
The treemap visualisation of the textual clusters. On the right are the treemap user options that modify the parameters of the treemap generation. The colour of each node represents the positive or negative sentiment of the customers. Image courtesy of Ziegler et al. [39].
Figure 25.
The treemap visualisation of the textual clusters. On the right are the treemap user options that modify the parameters of the treemap generation. The colour of each node represents the positive or negative sentiment of the customers. Image courtesy of Ziegler et al. [39].

Figure 26.
The visual summary report. Each row represents a product (in this case, printers), and each column represents an attribute of the product. The internal square in each of the matrix compartments show how many reviewers commented on this attribute. Image courtesy of Oelke et al. [40].
Figure 26.
The visual summary report. Each row represents a product (in this case, printers), and each column represents an attribute of the product. The internal square in each of the matrix compartments show how many reviewers commented on this attribute. Image courtesy of Oelke et al. [40].

Figure 27.
(a) The OpinionSeer temporal rings at different scales. Each layer represents a year and the colour depicts the feedback. (b) The reviewer location linked in with the time of year the review is made. The user selects the location from the outside ring to see the feedback from that country. Image courtesy of Wu et al. [41].

Figure 28.
This figure shows the growth of the Business Visualisation literature included in this survey.
Figure 28.
This figure shows the growth of the Business Visualisation literature included in this survey.


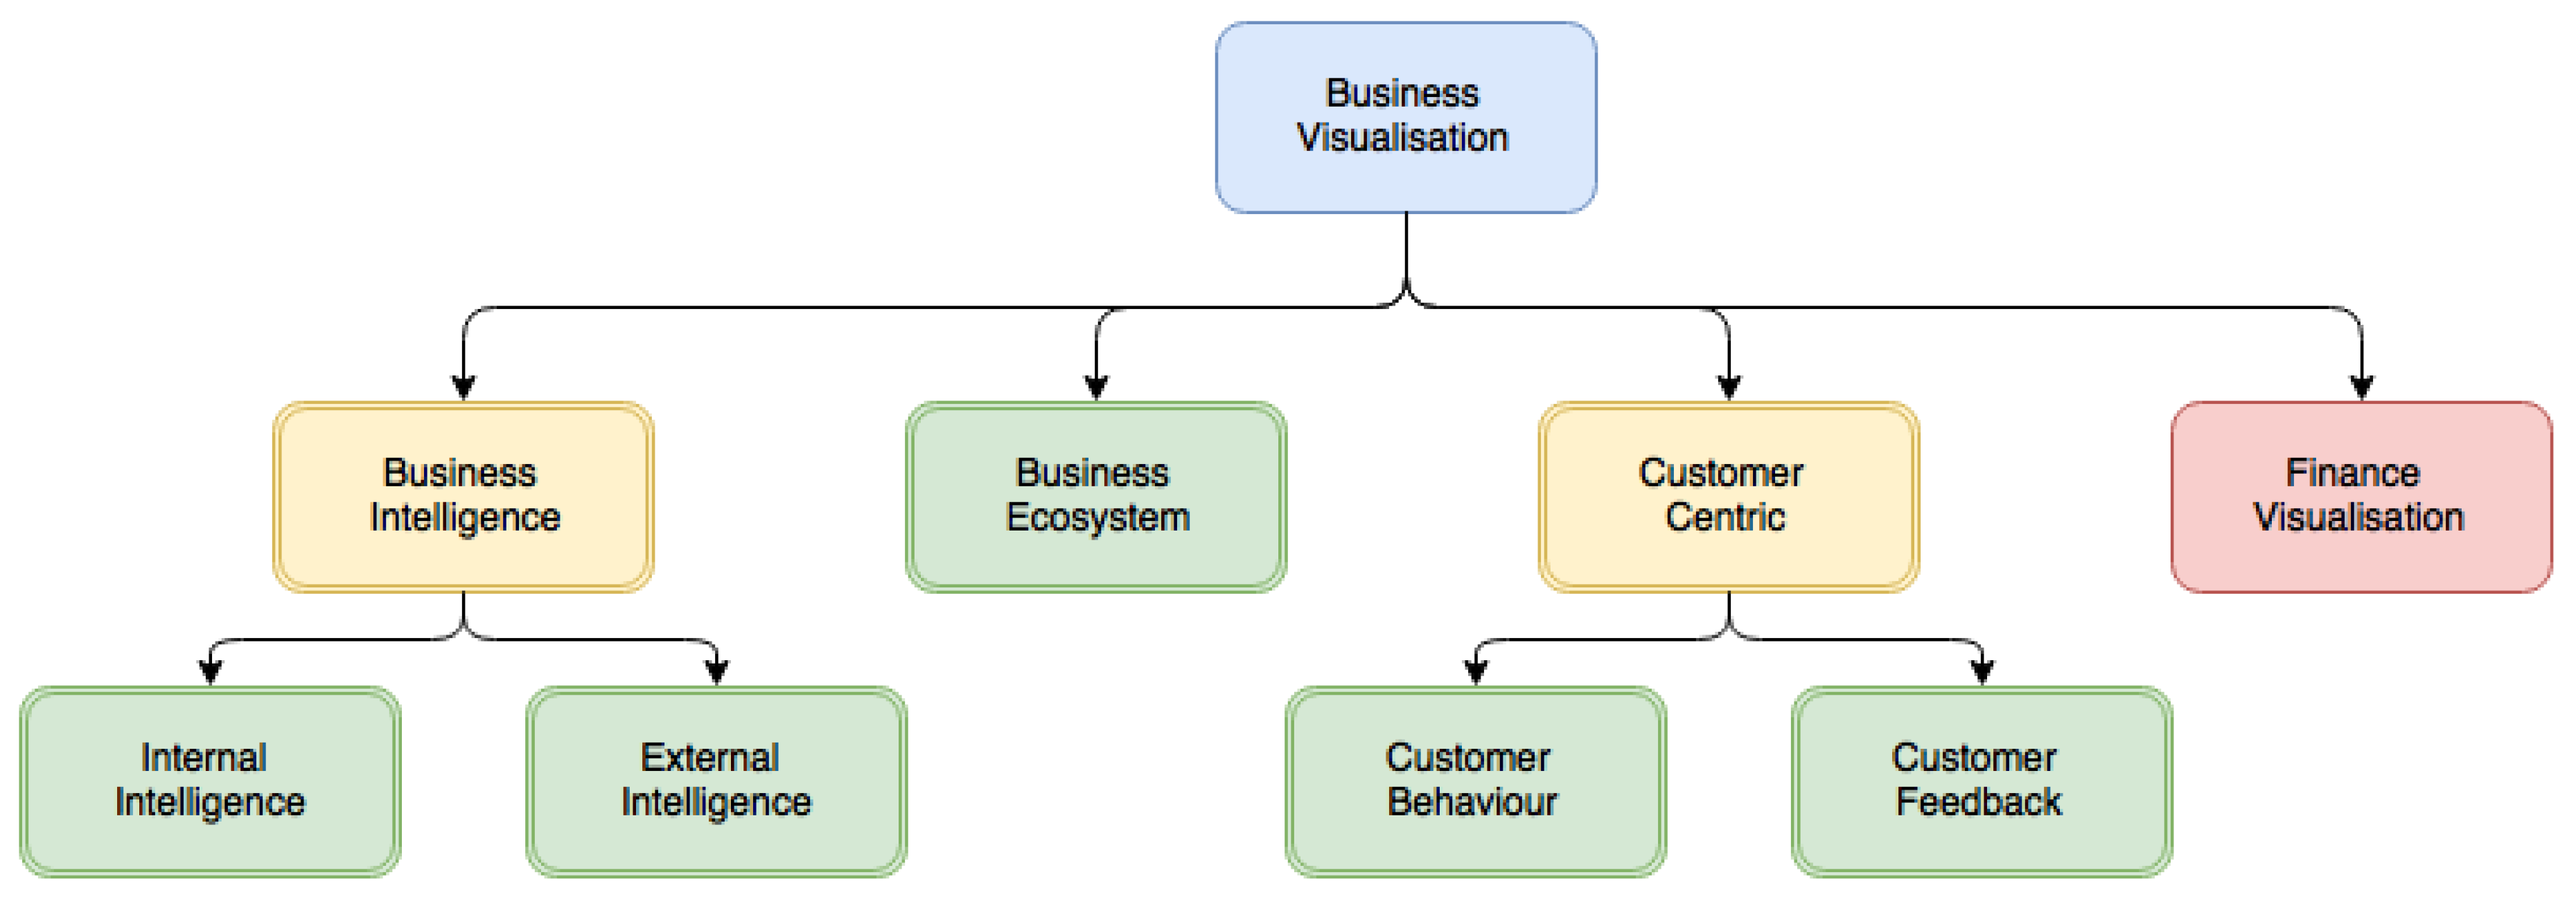
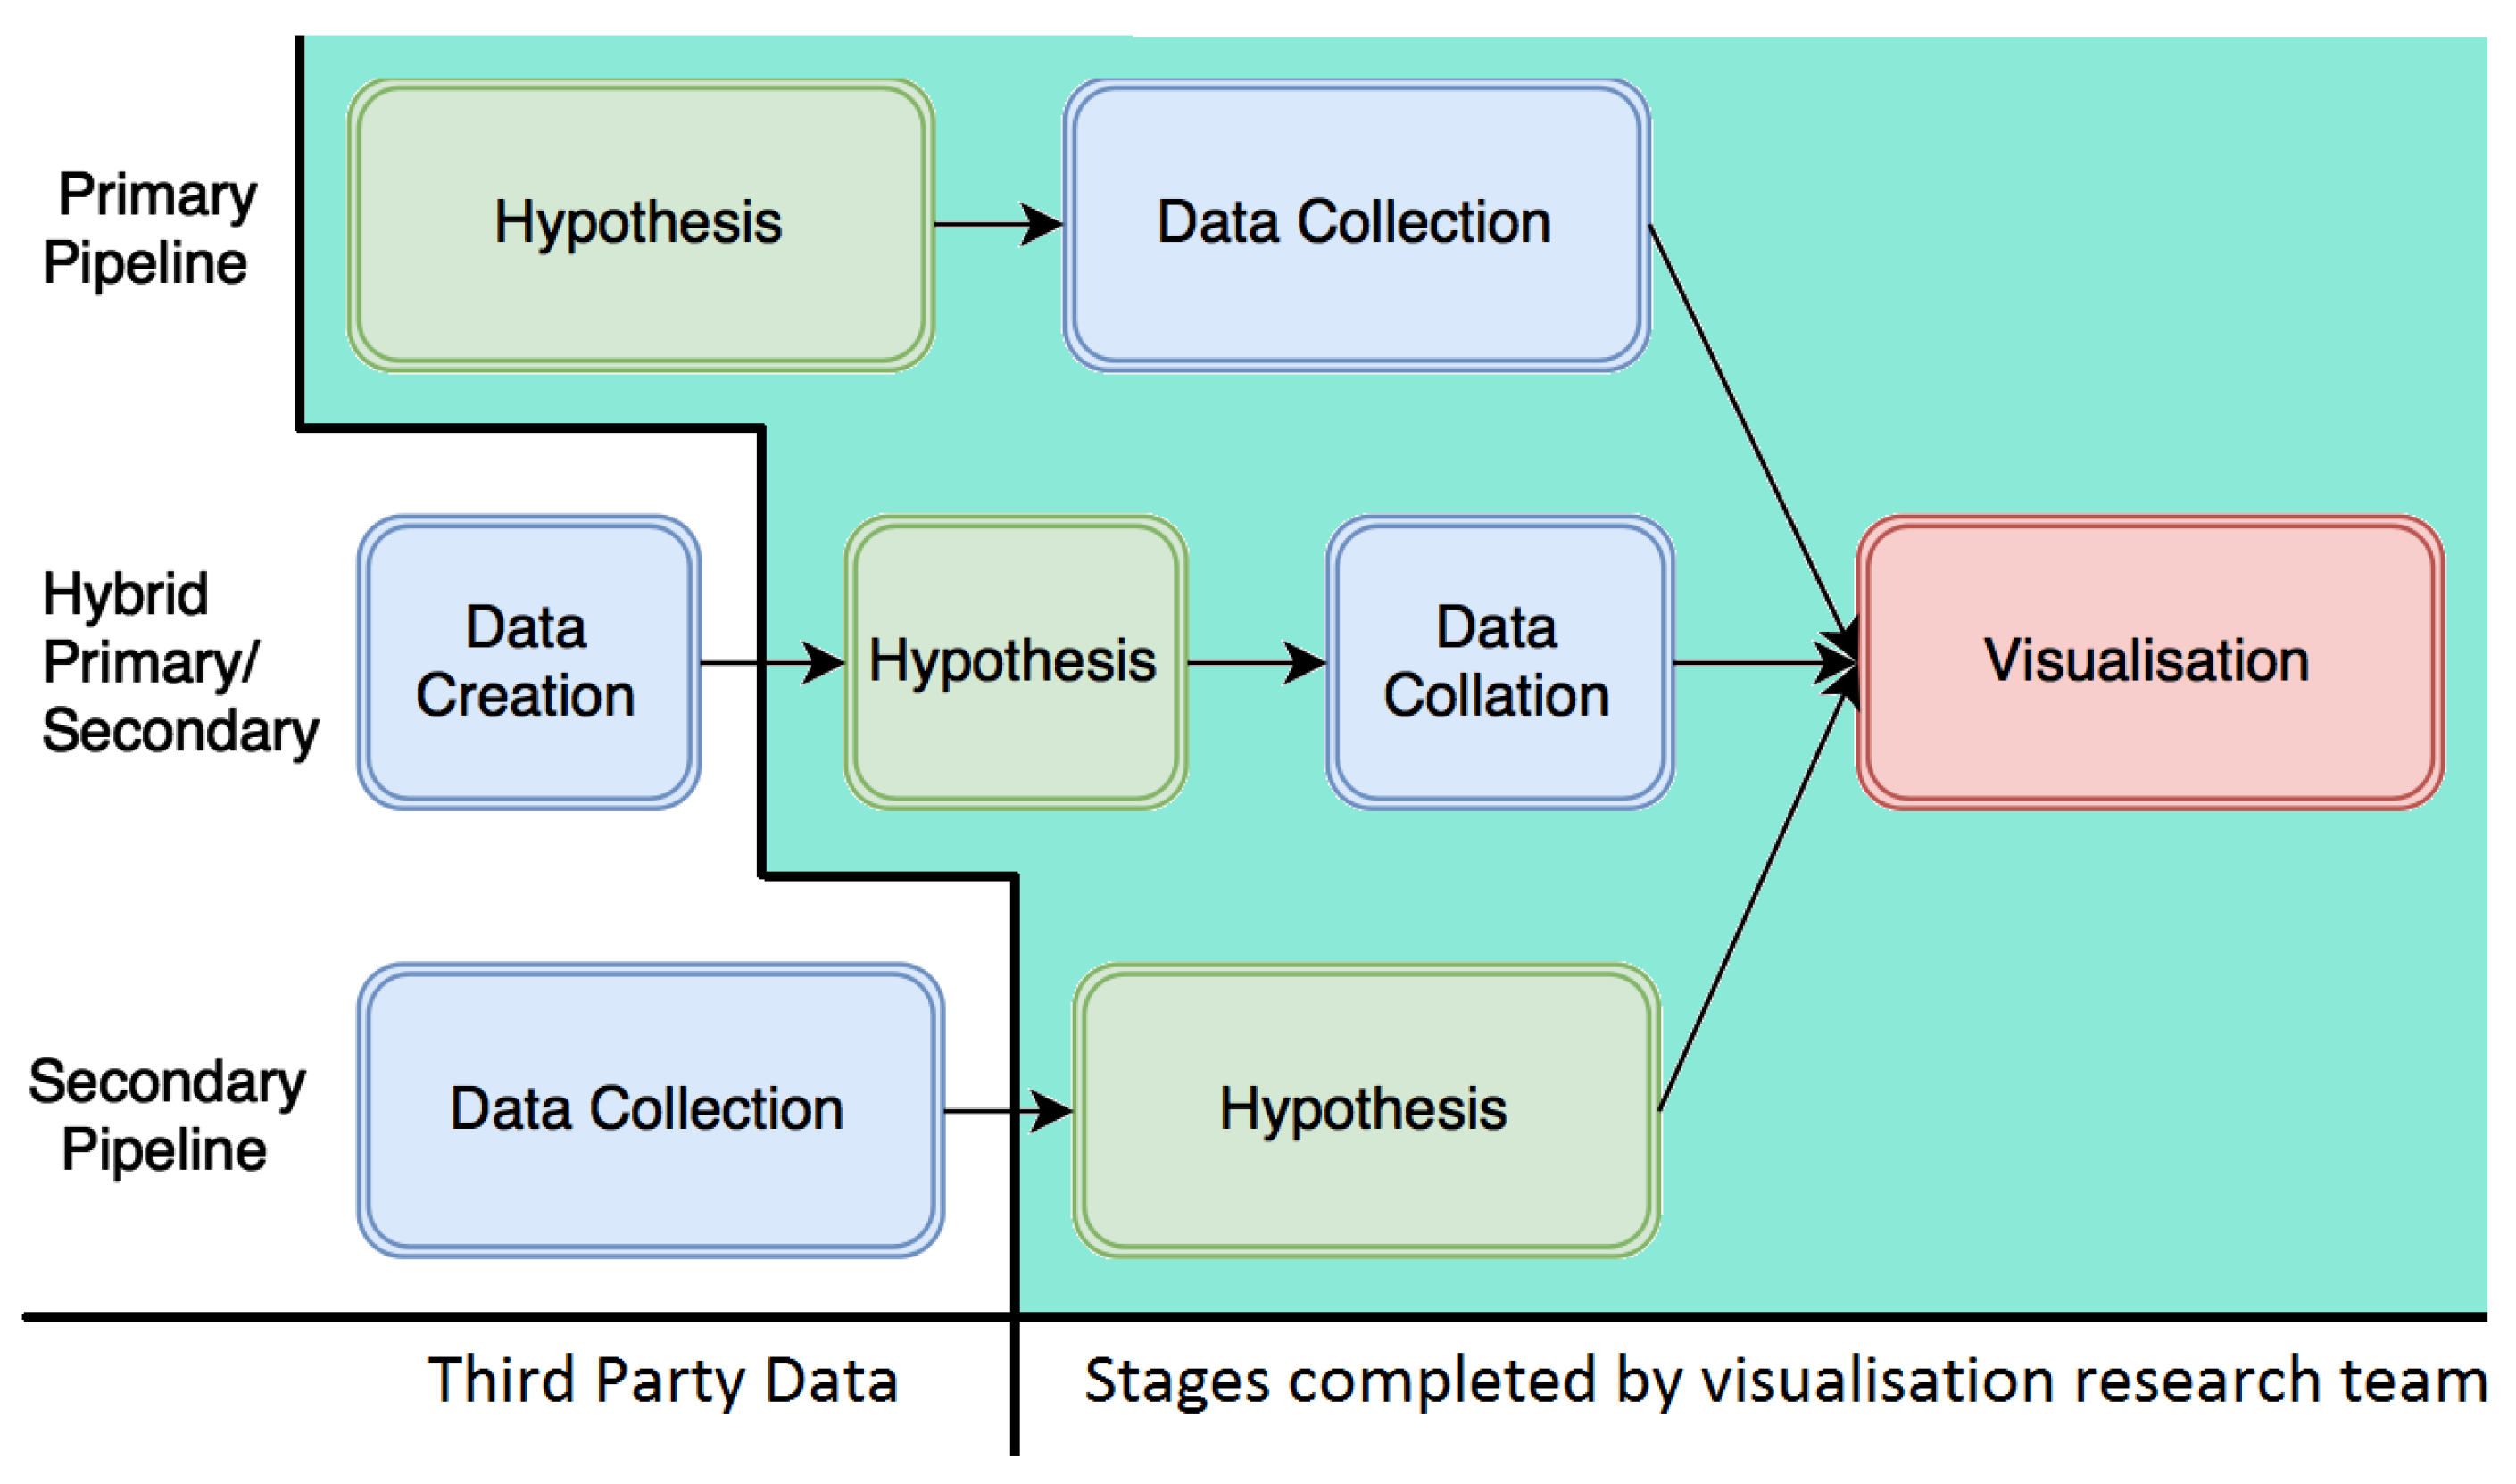
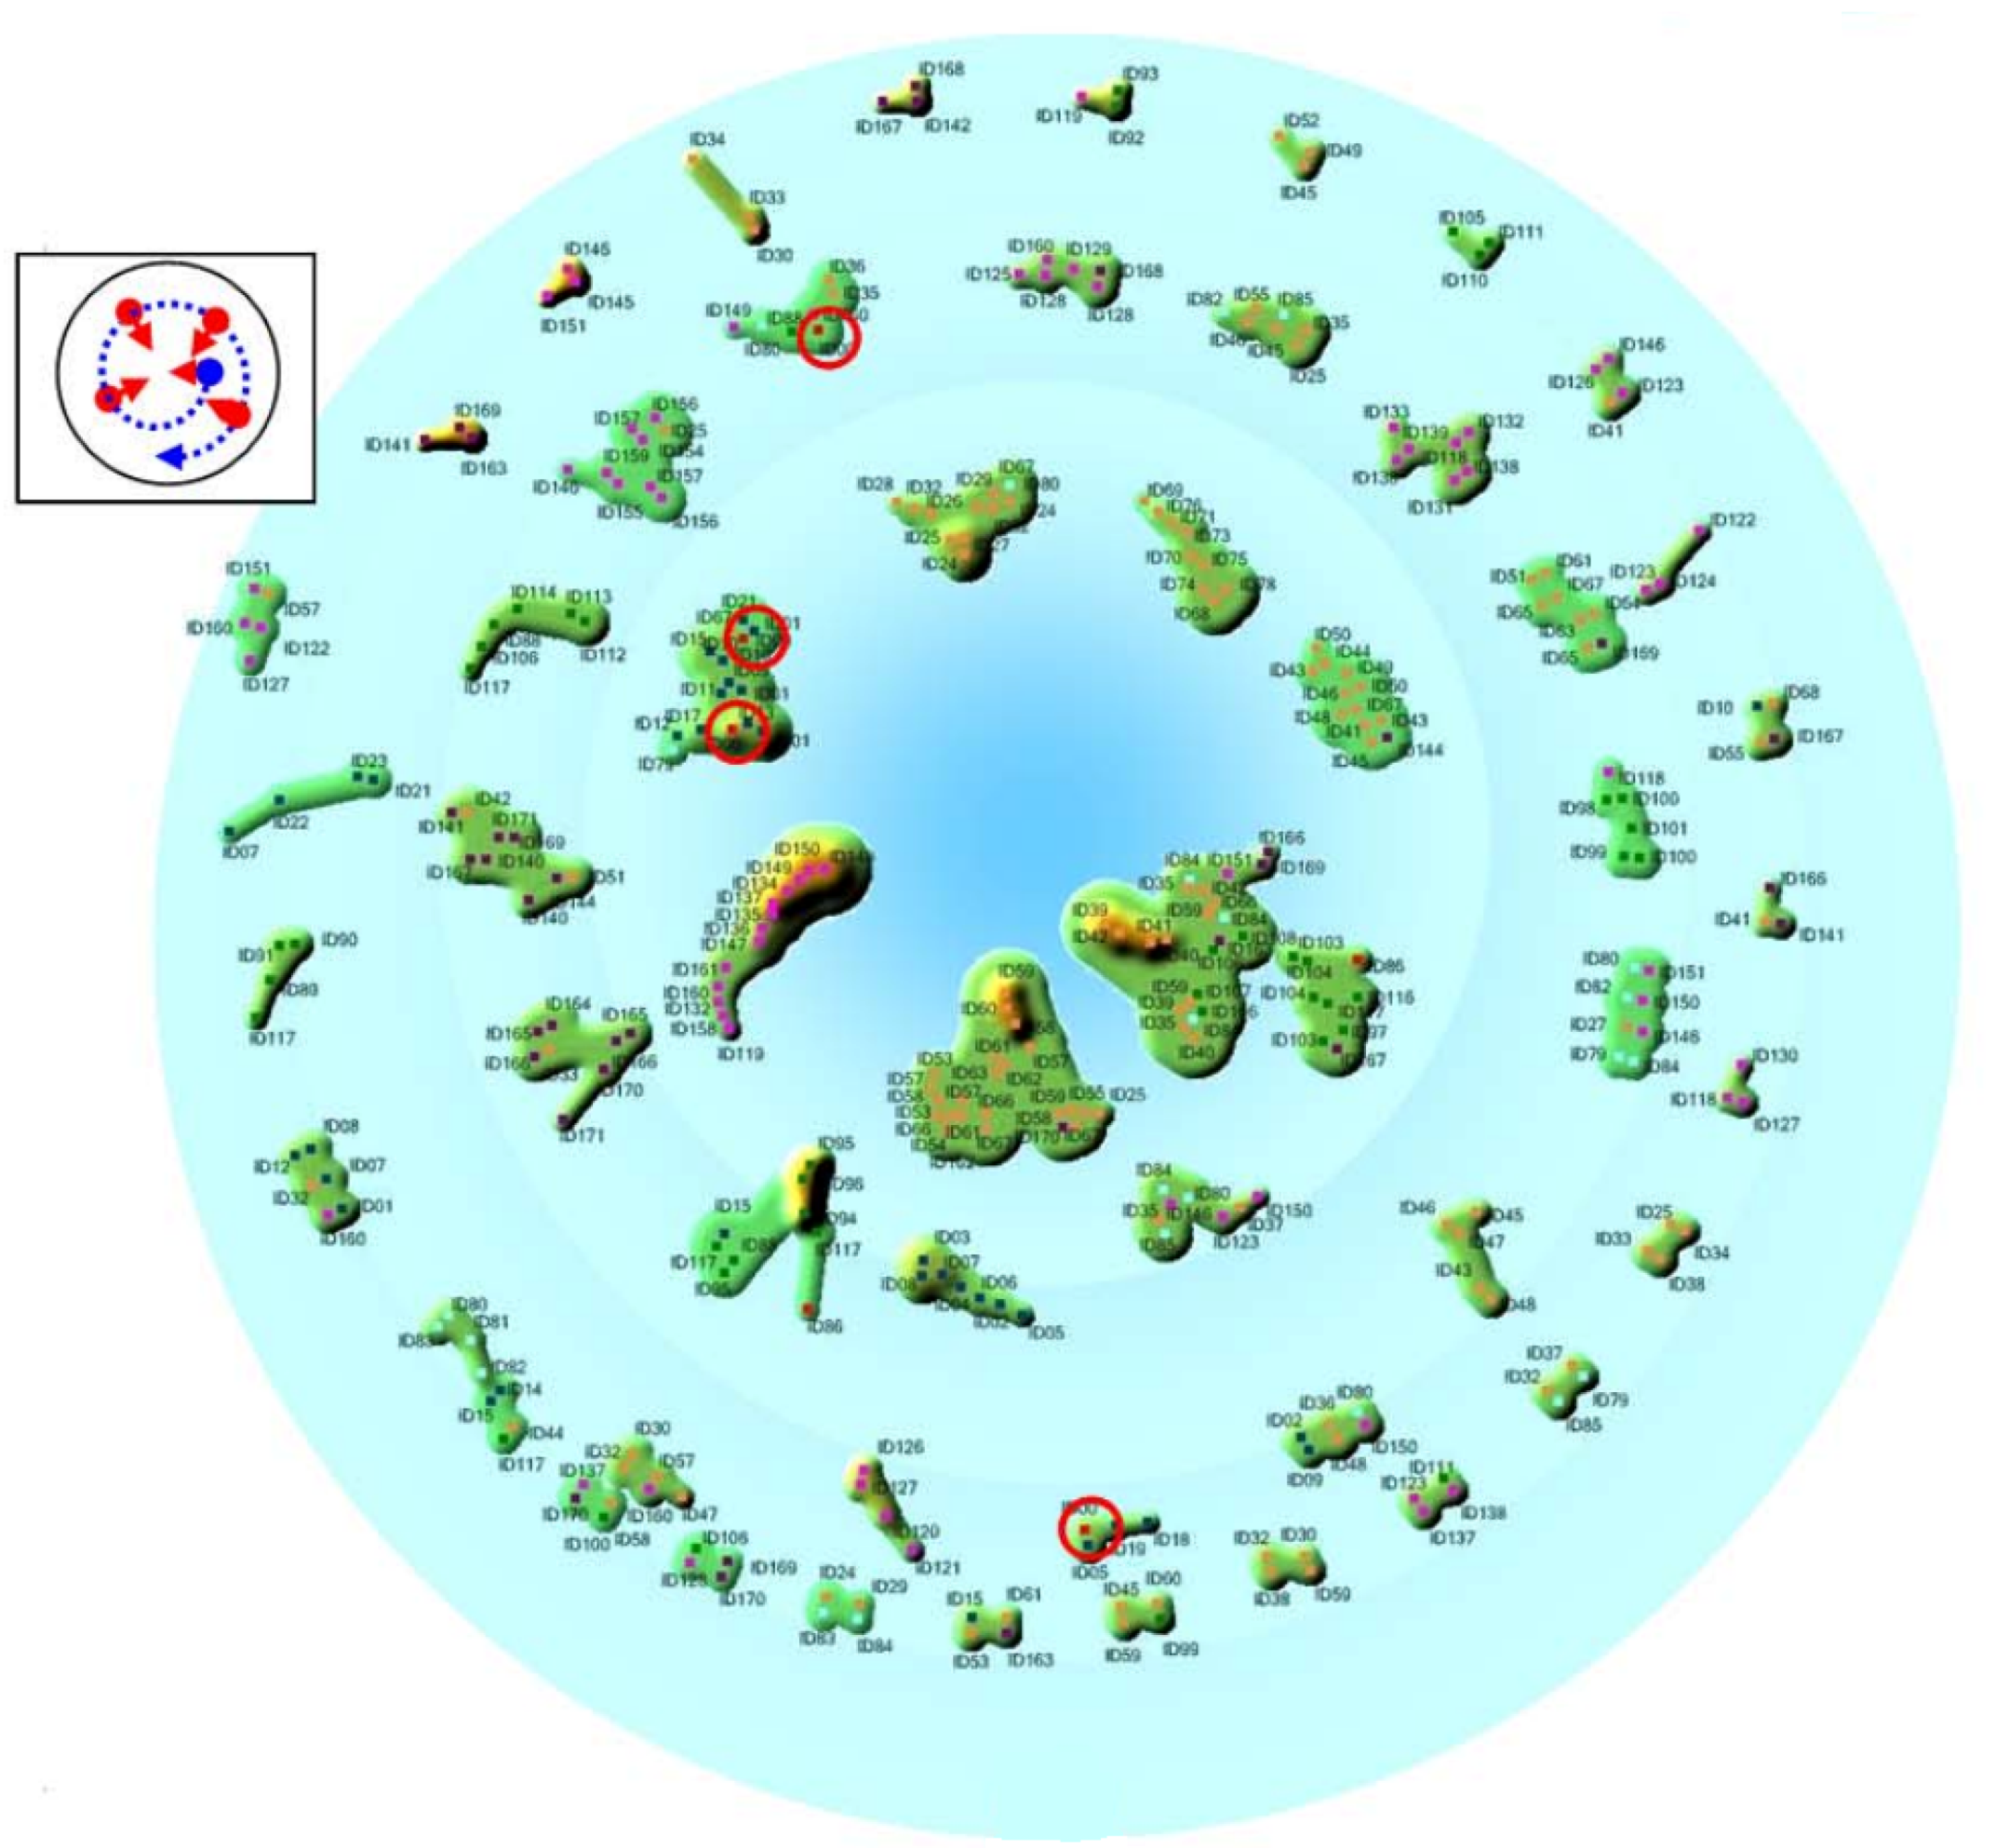
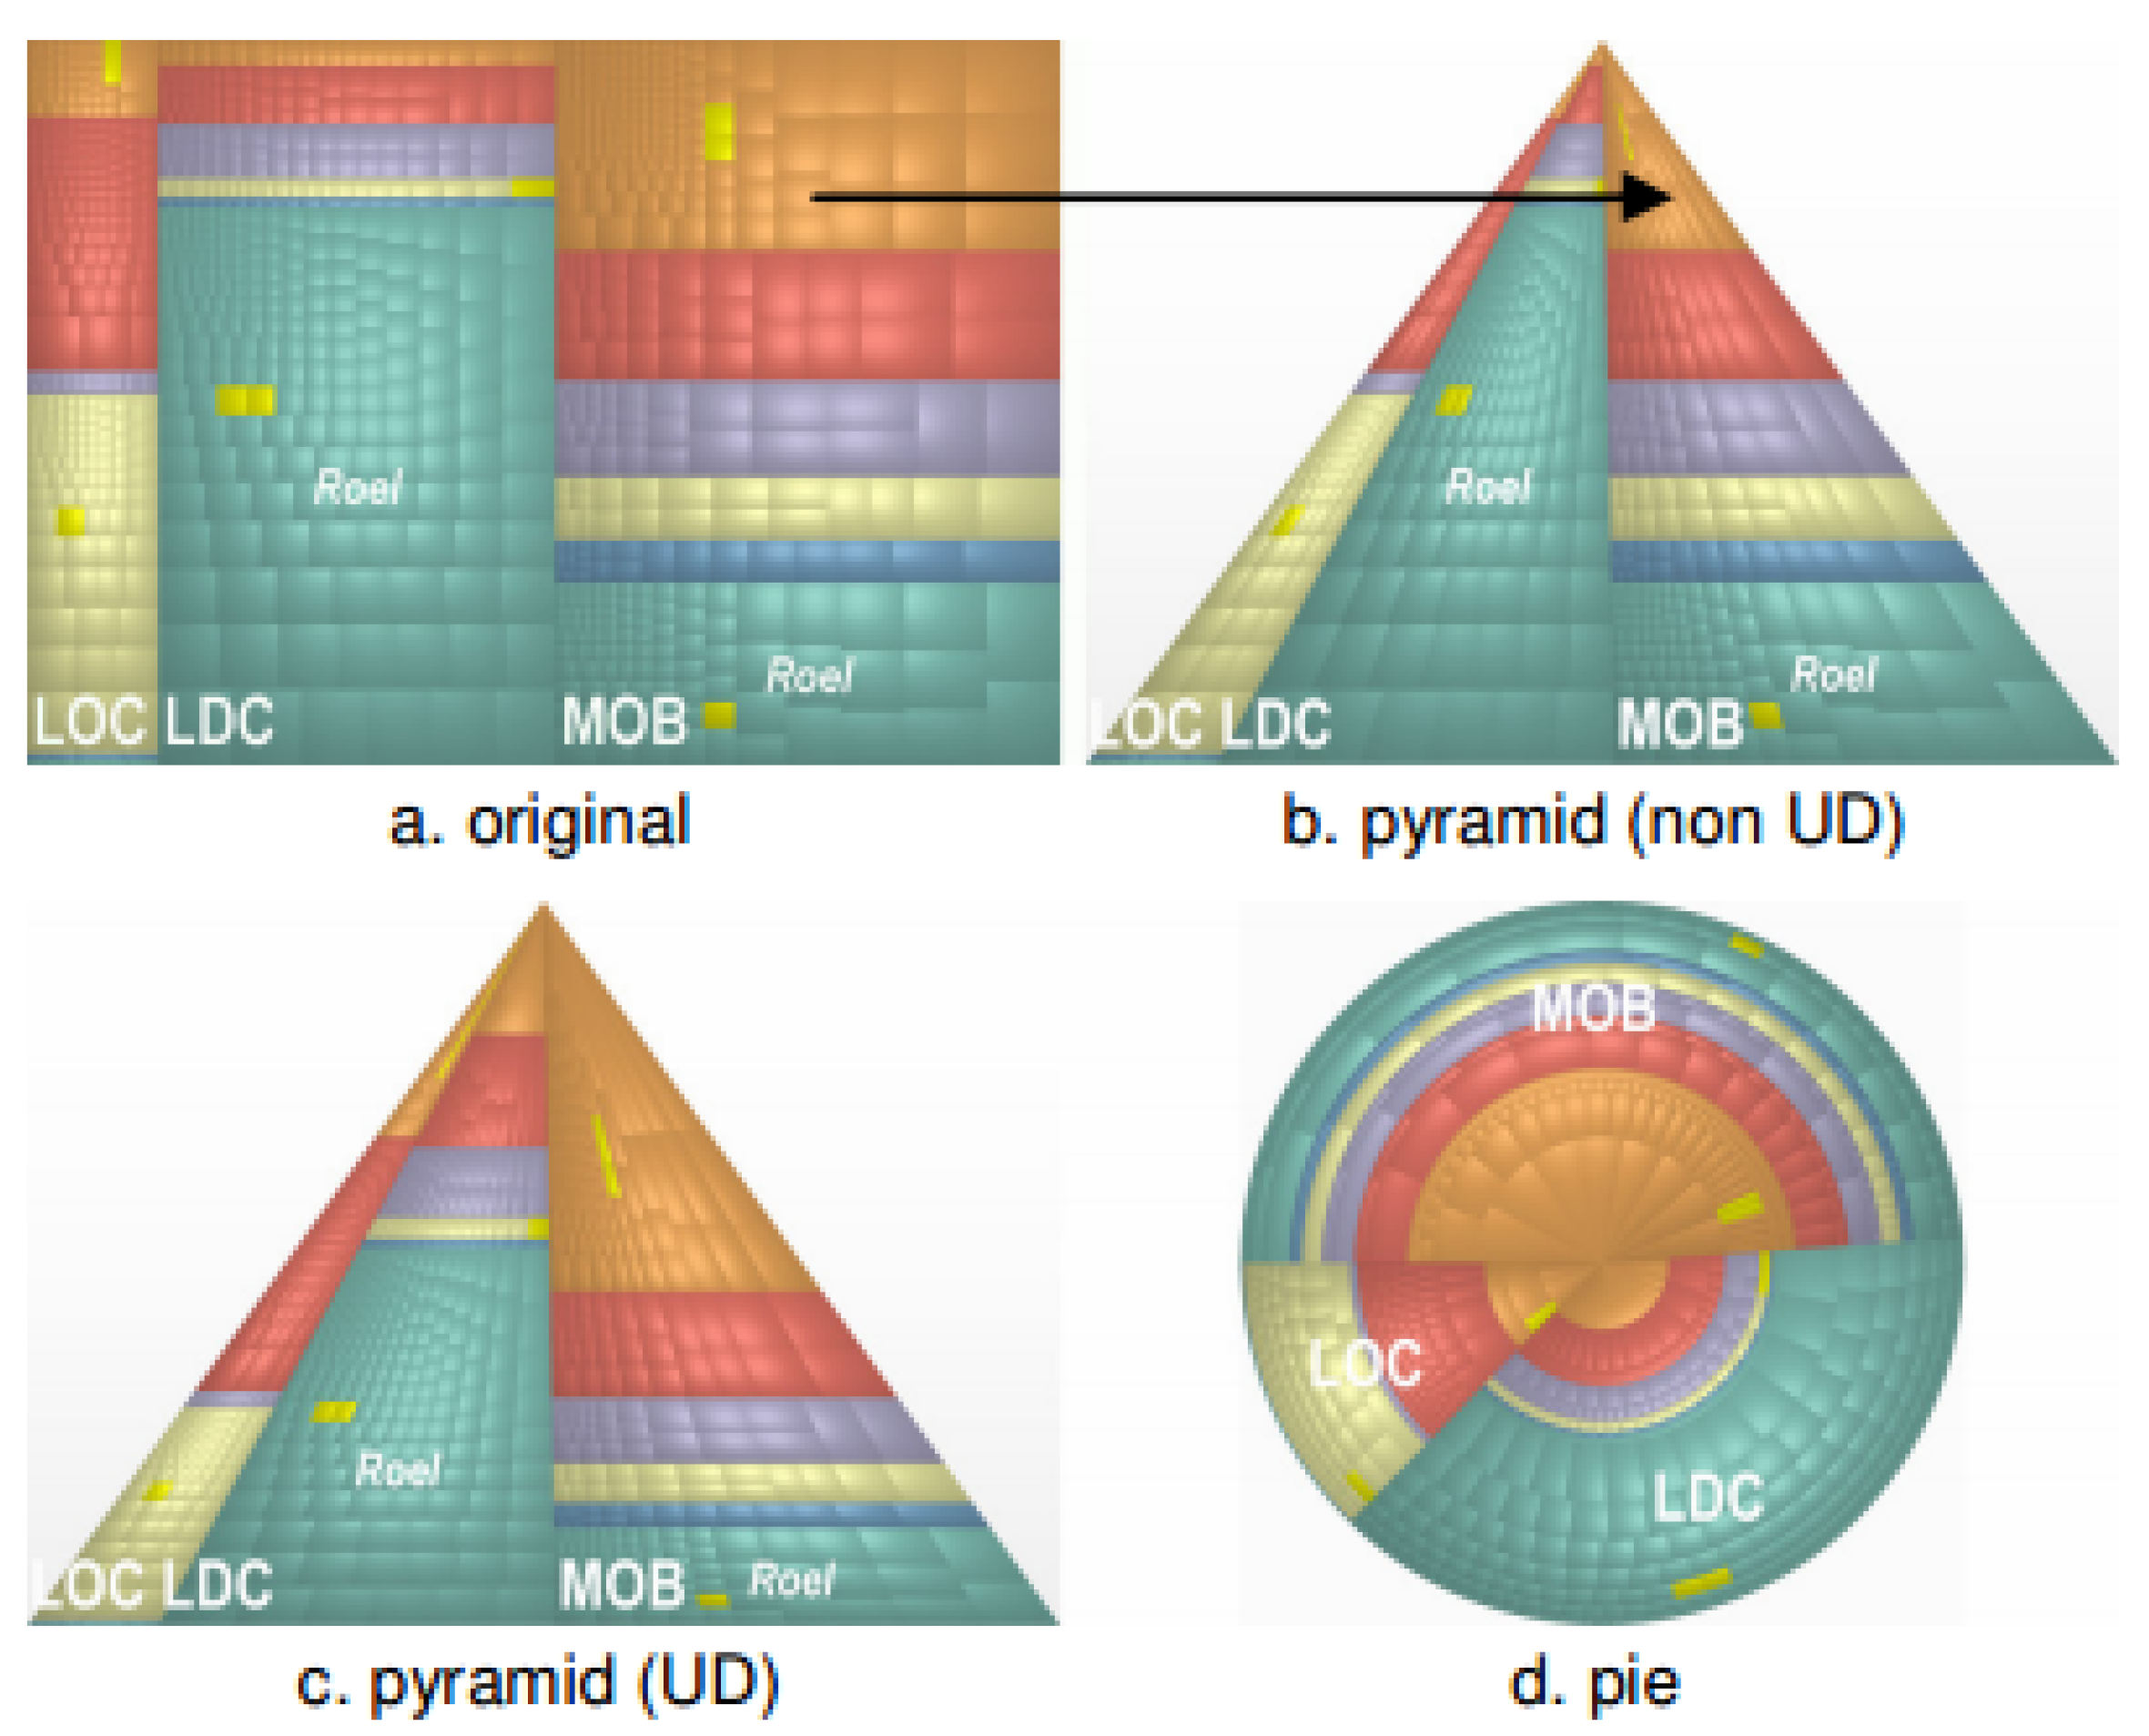
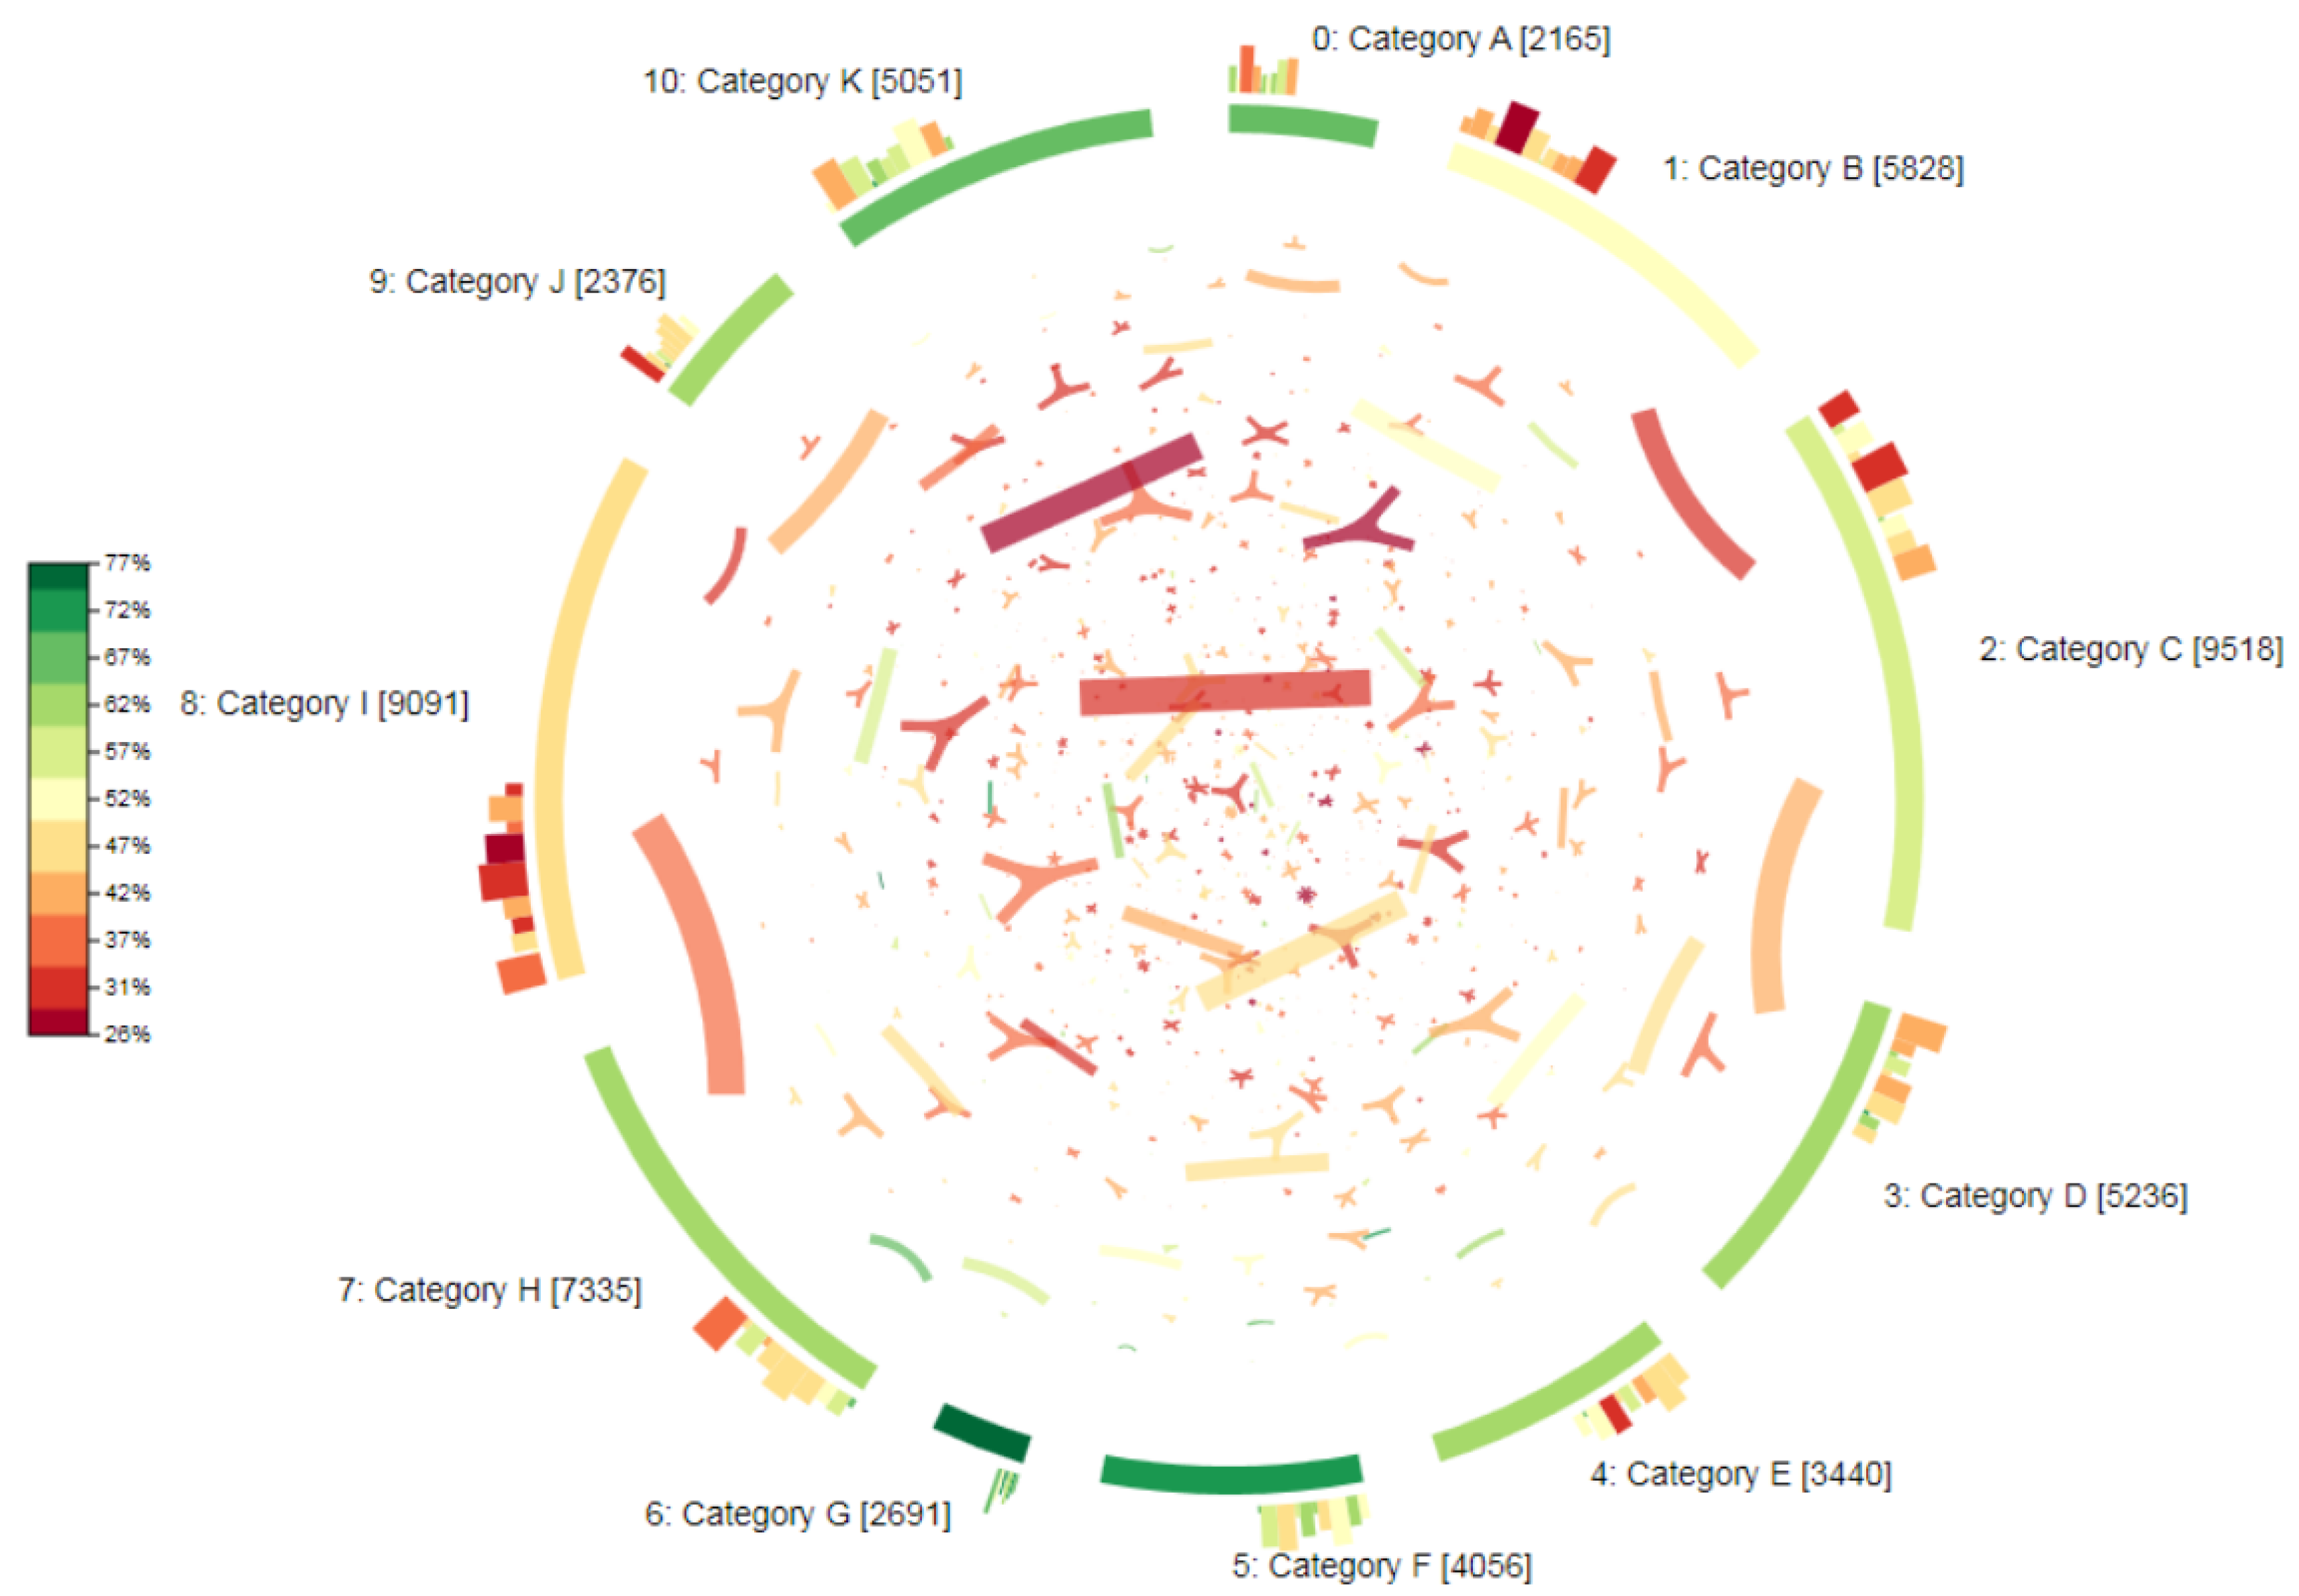
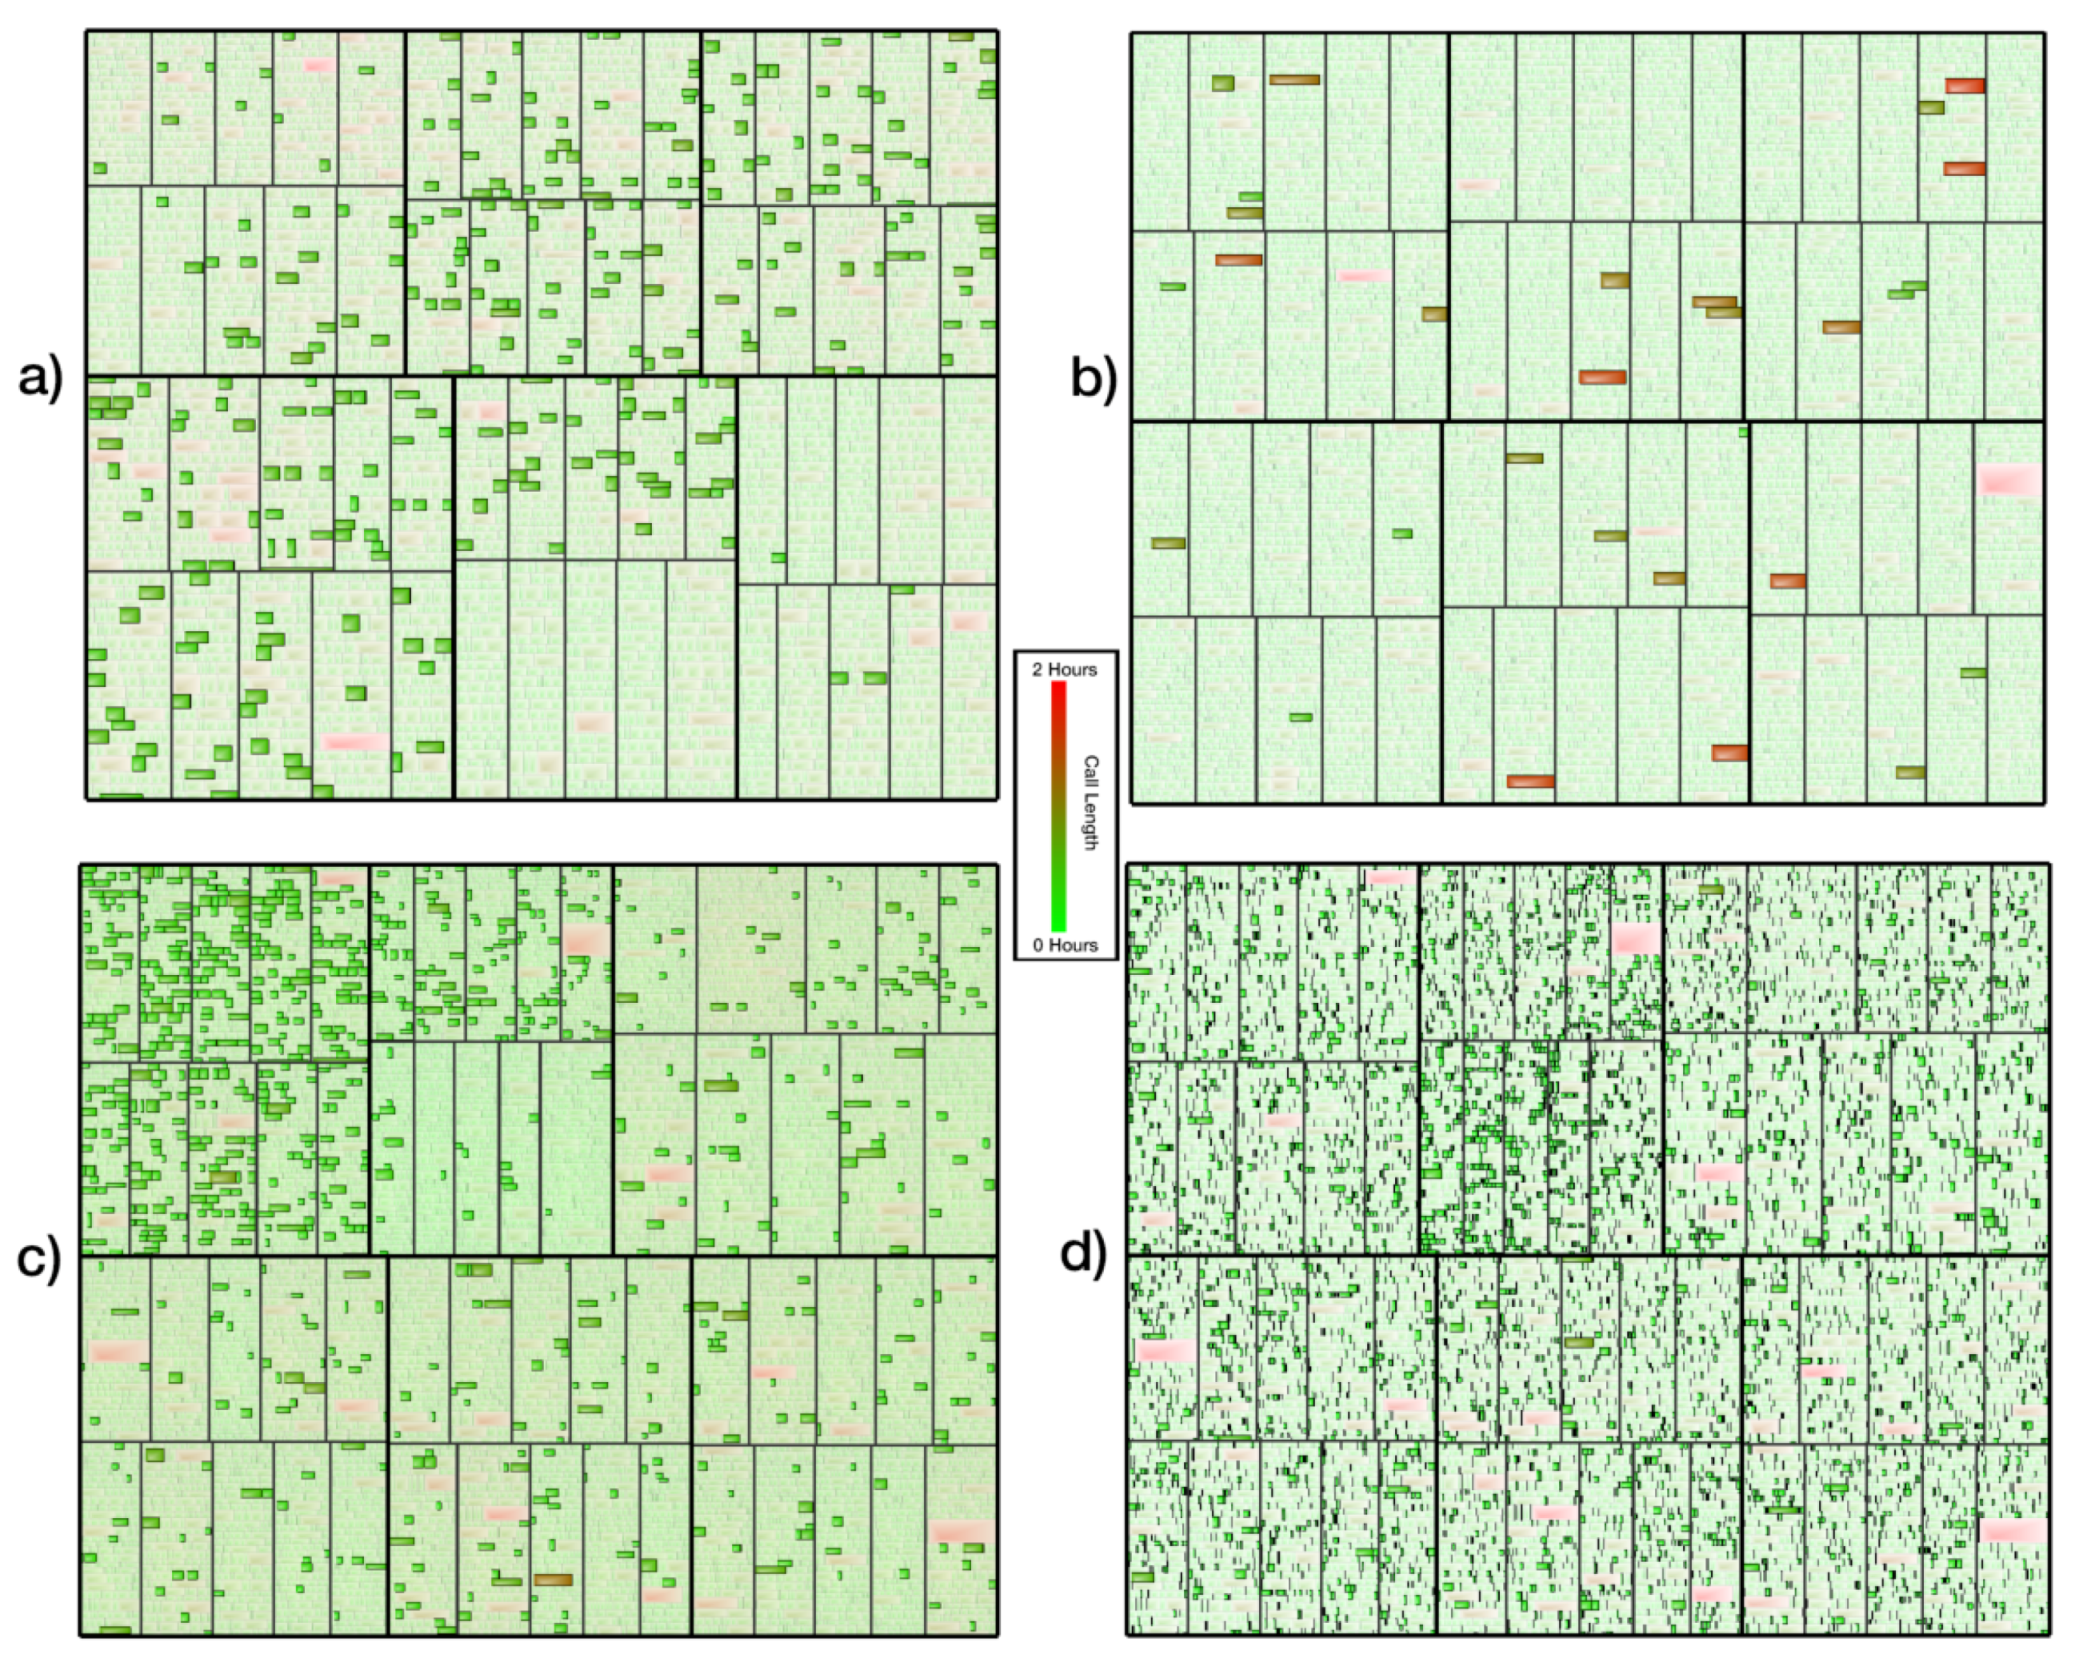
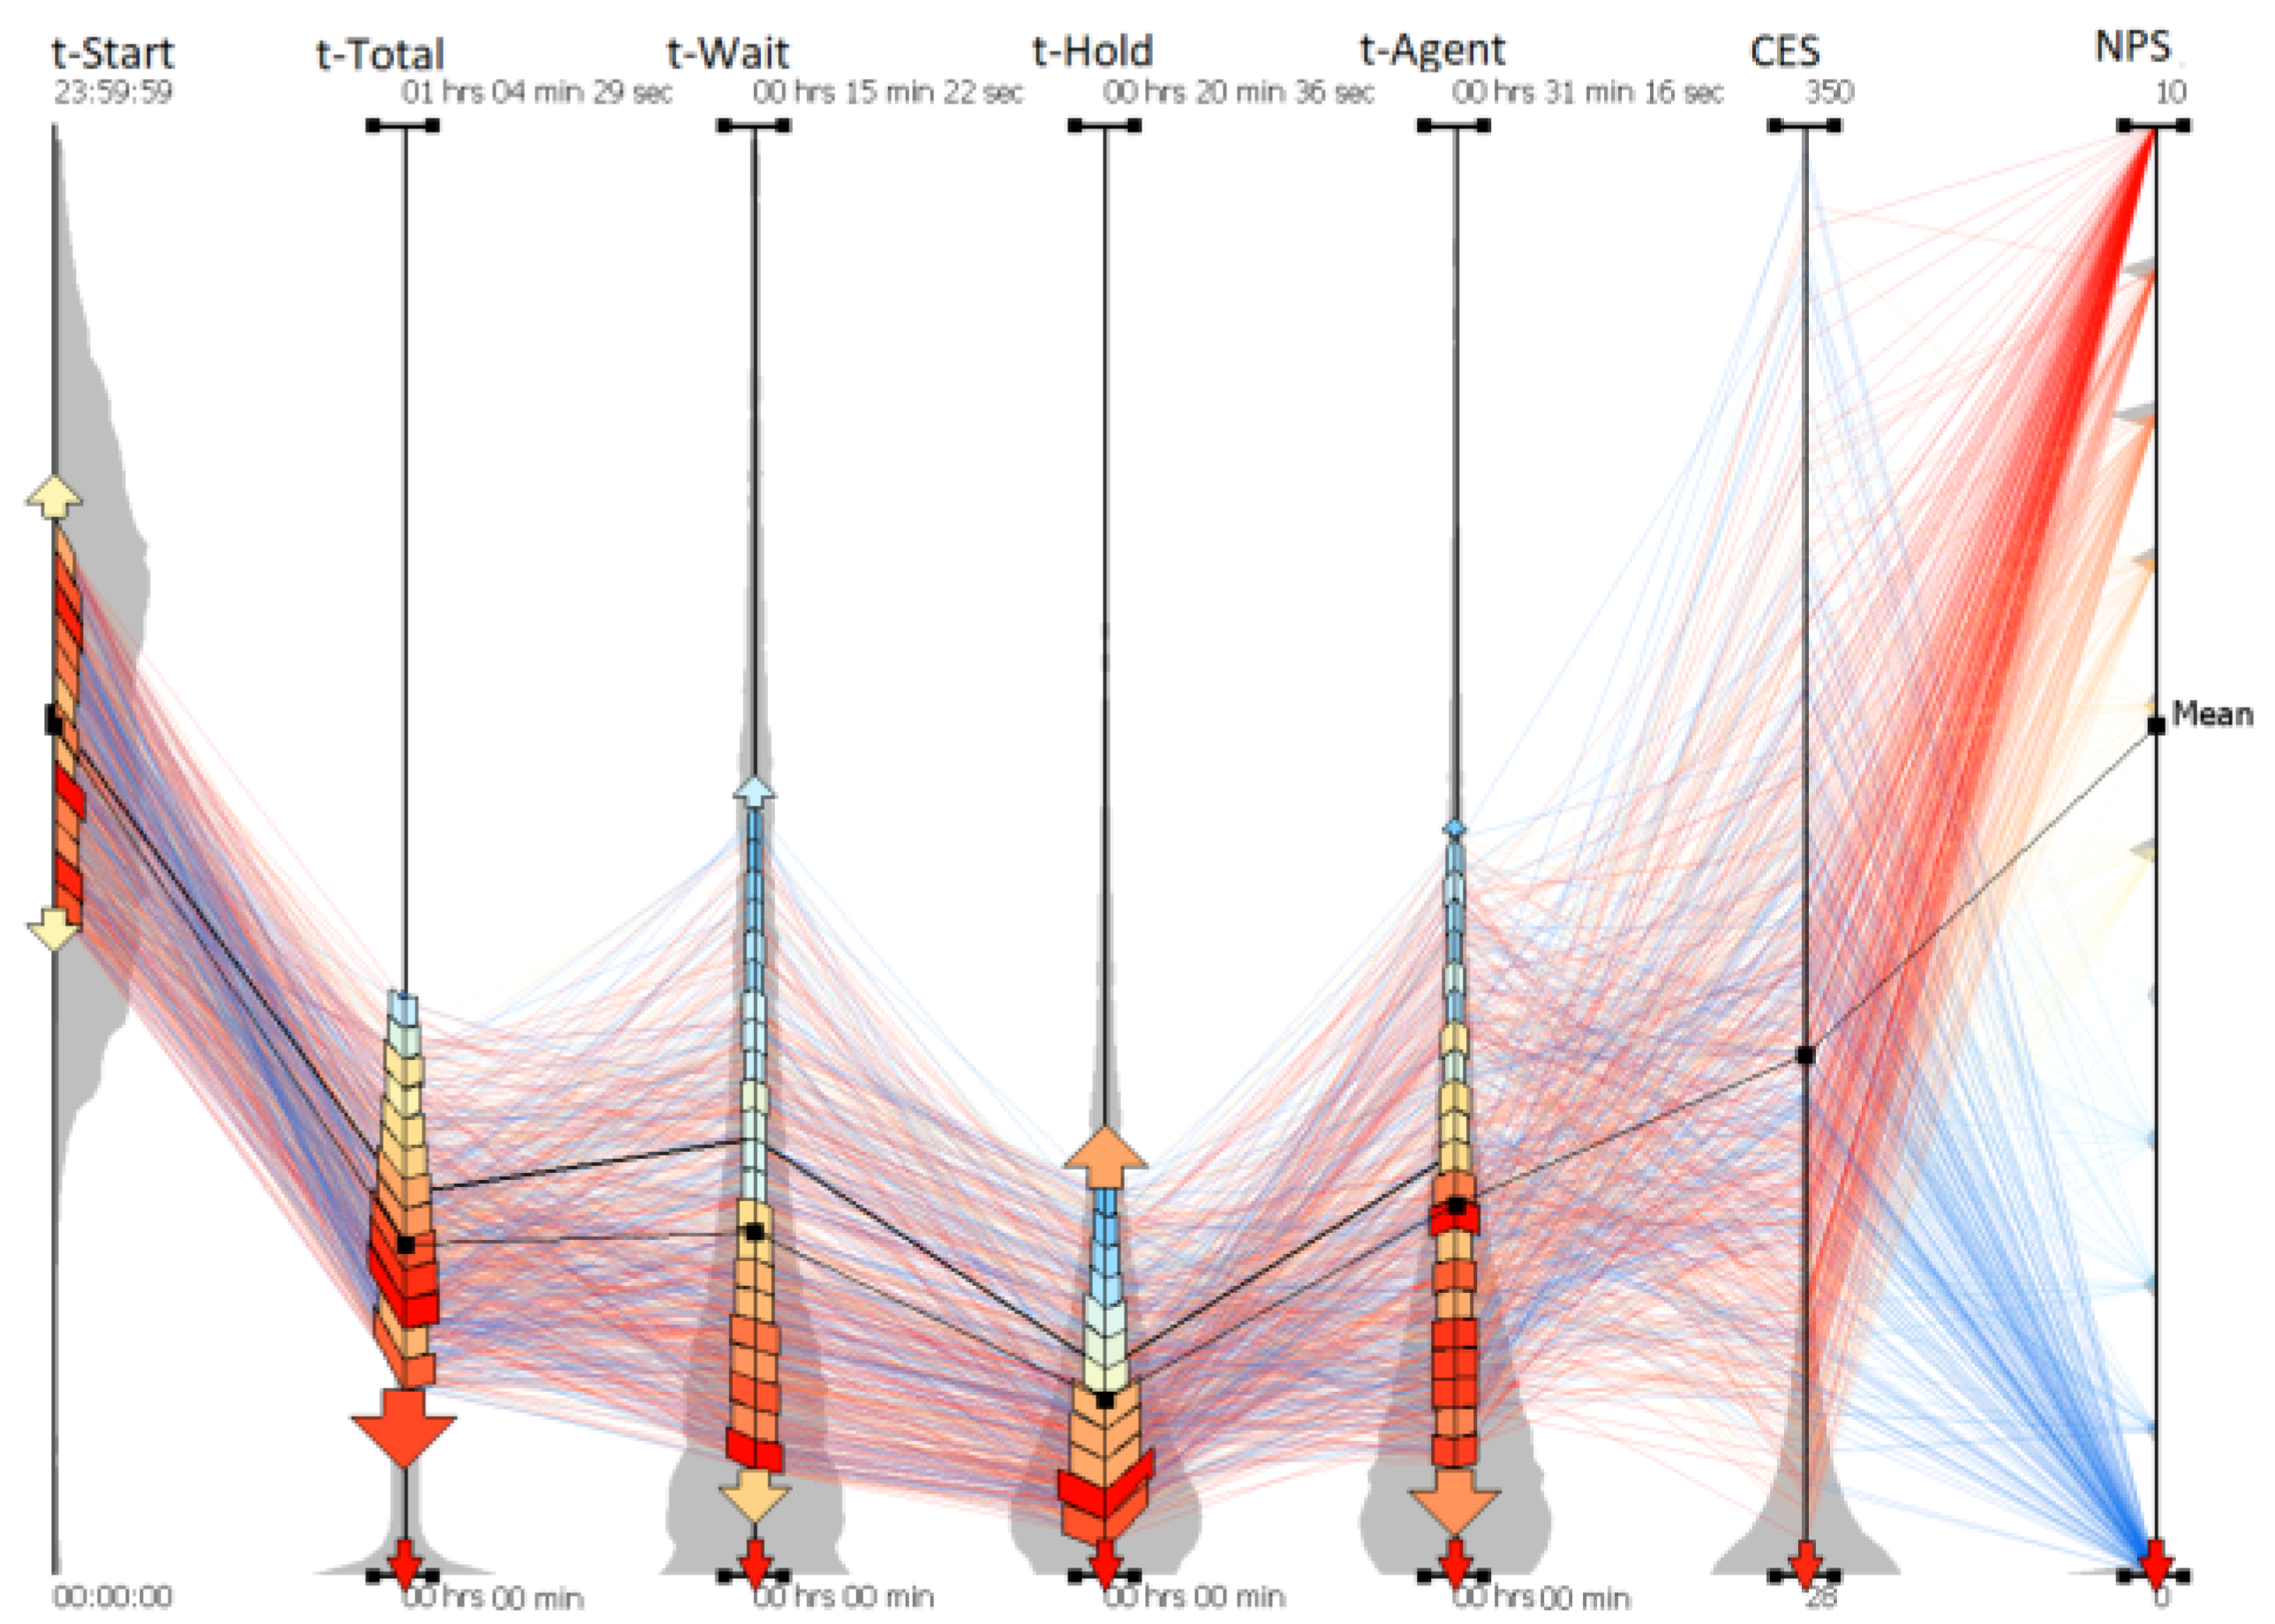
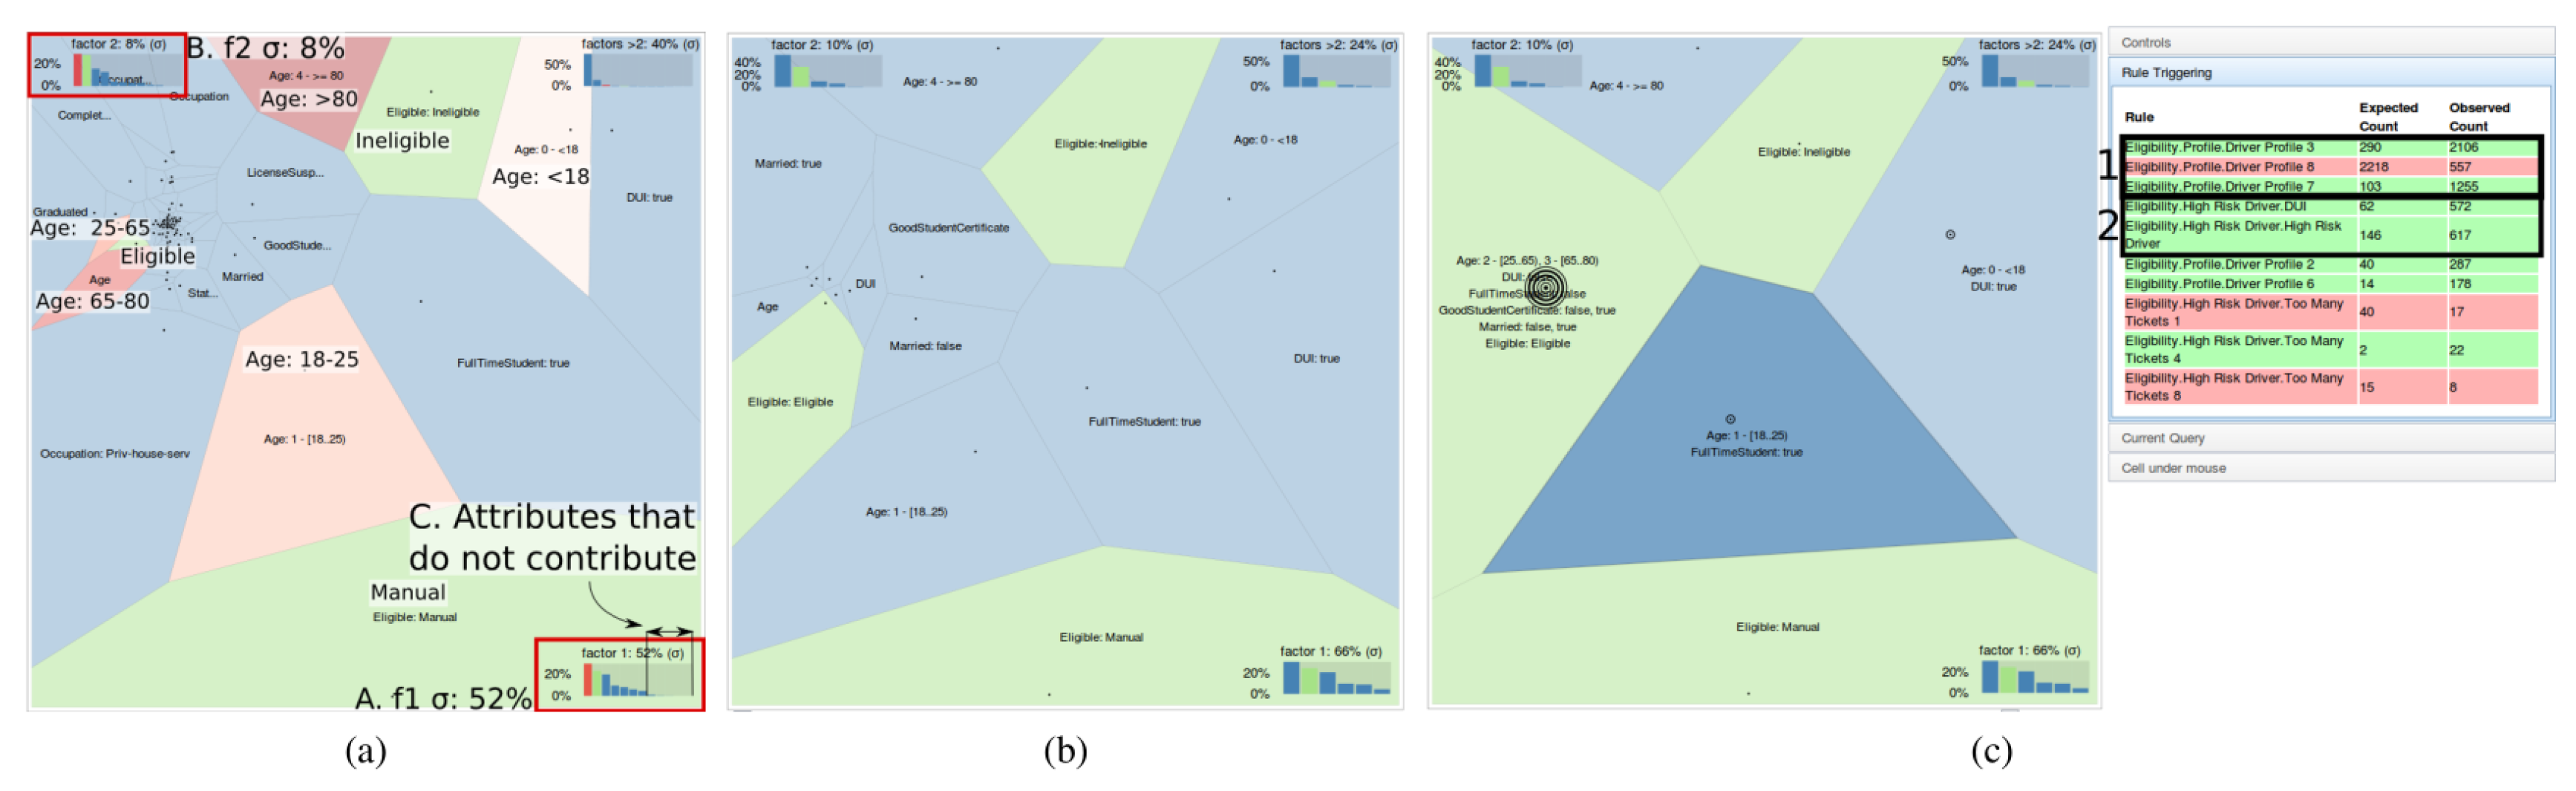
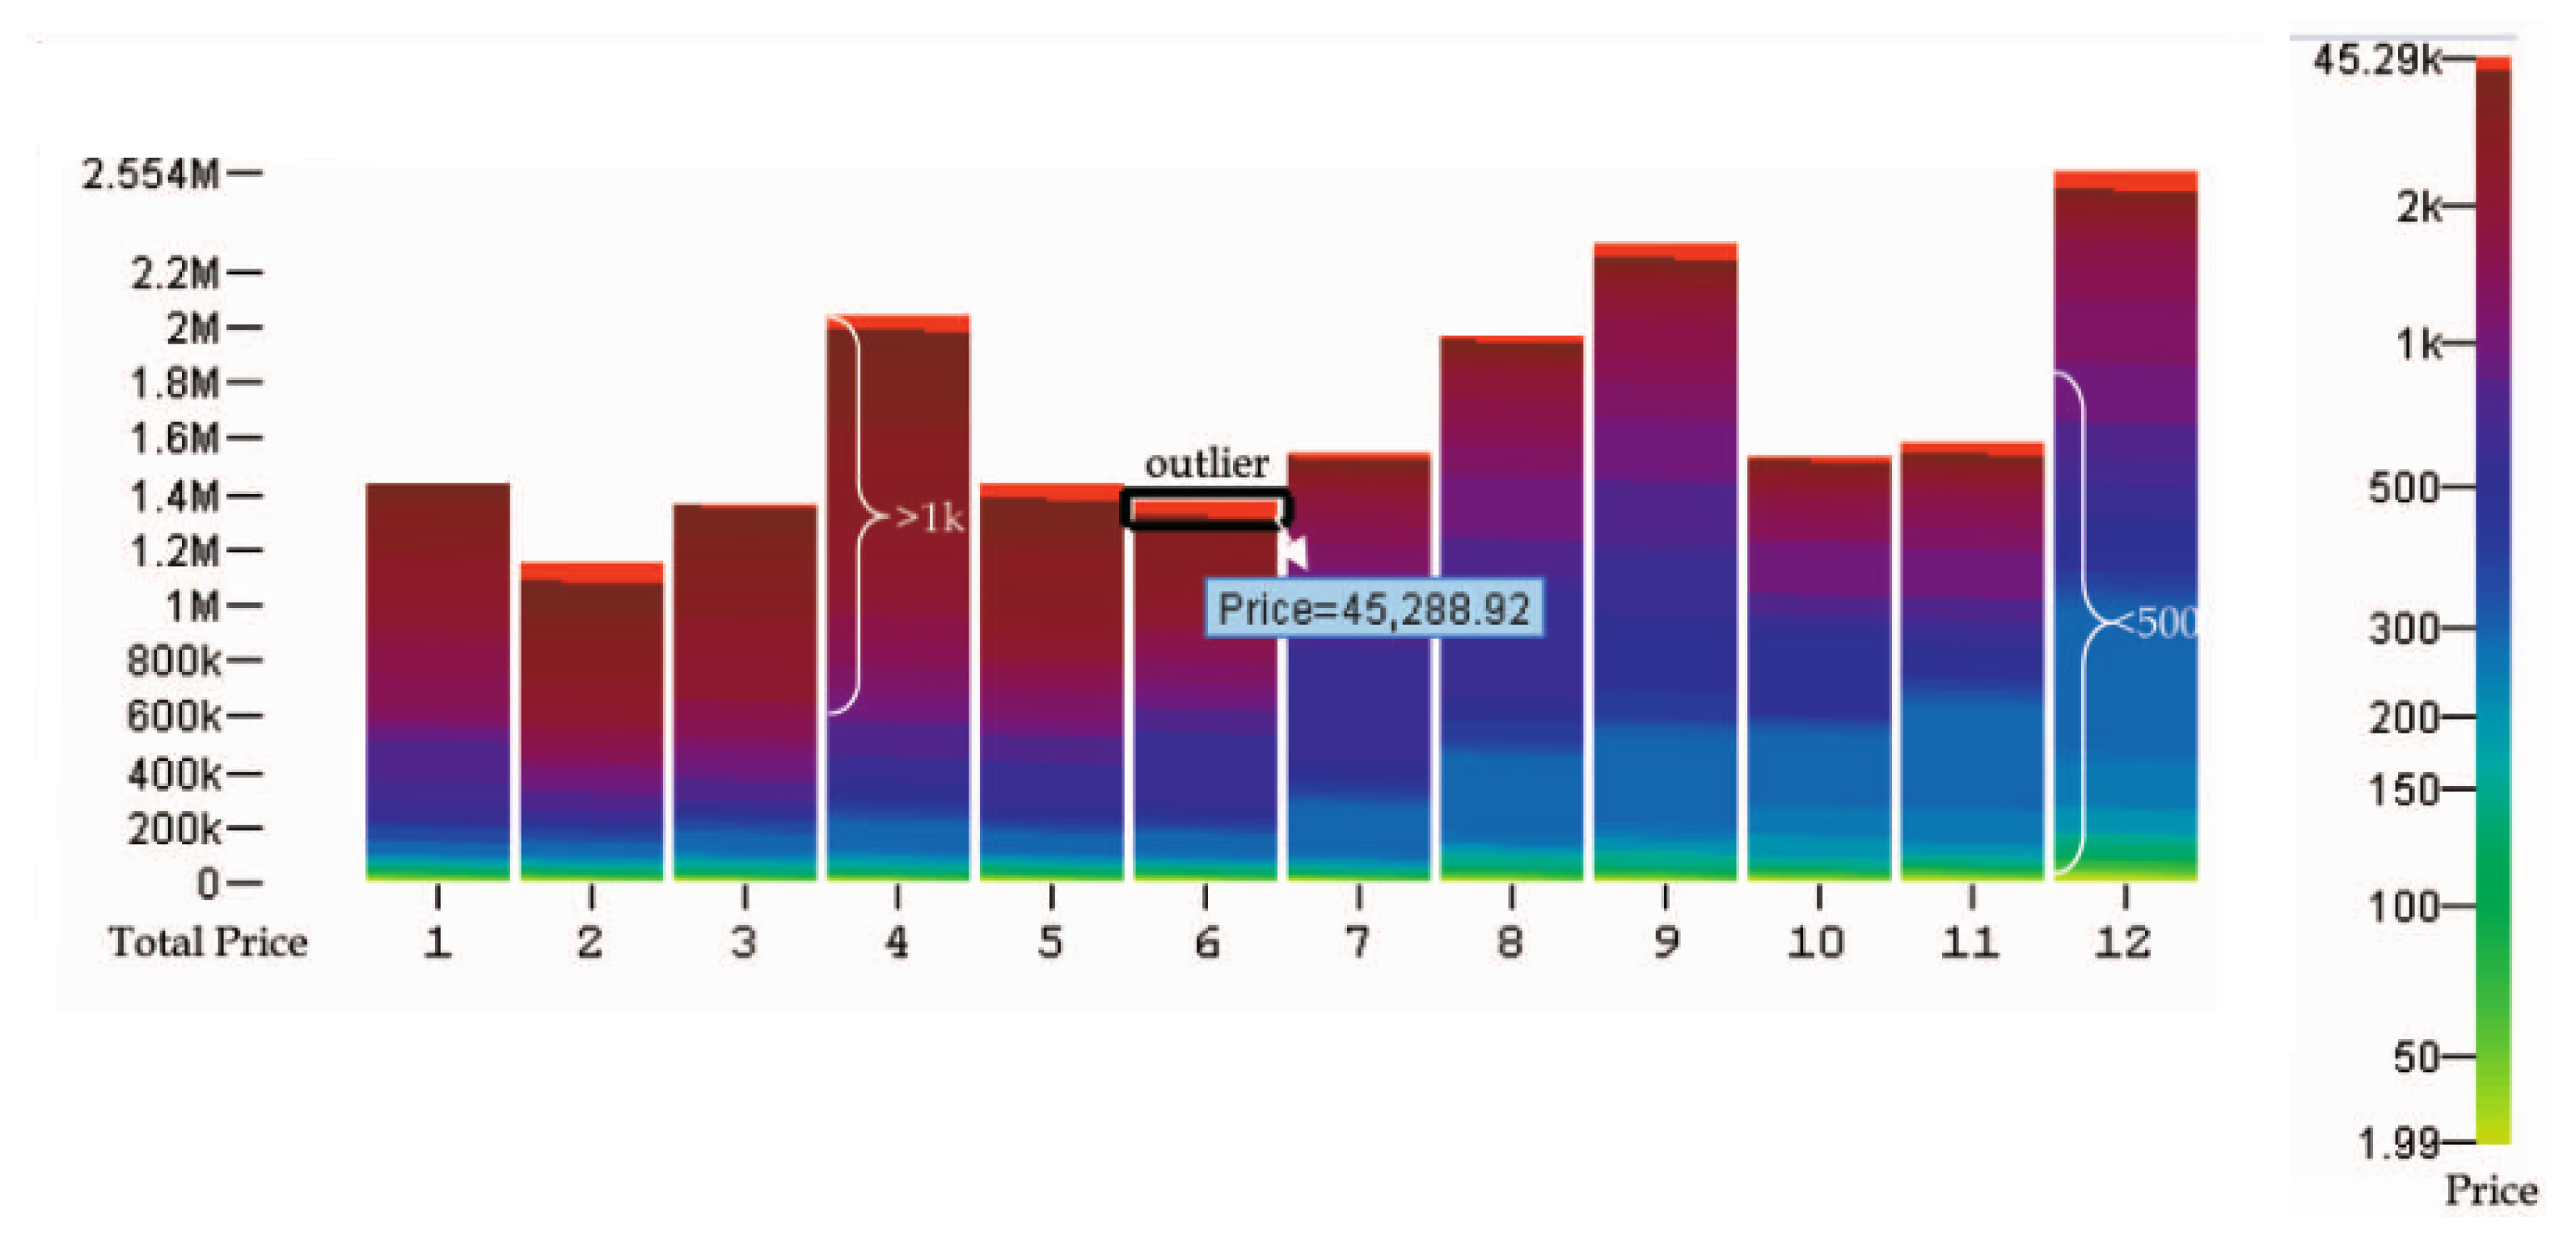
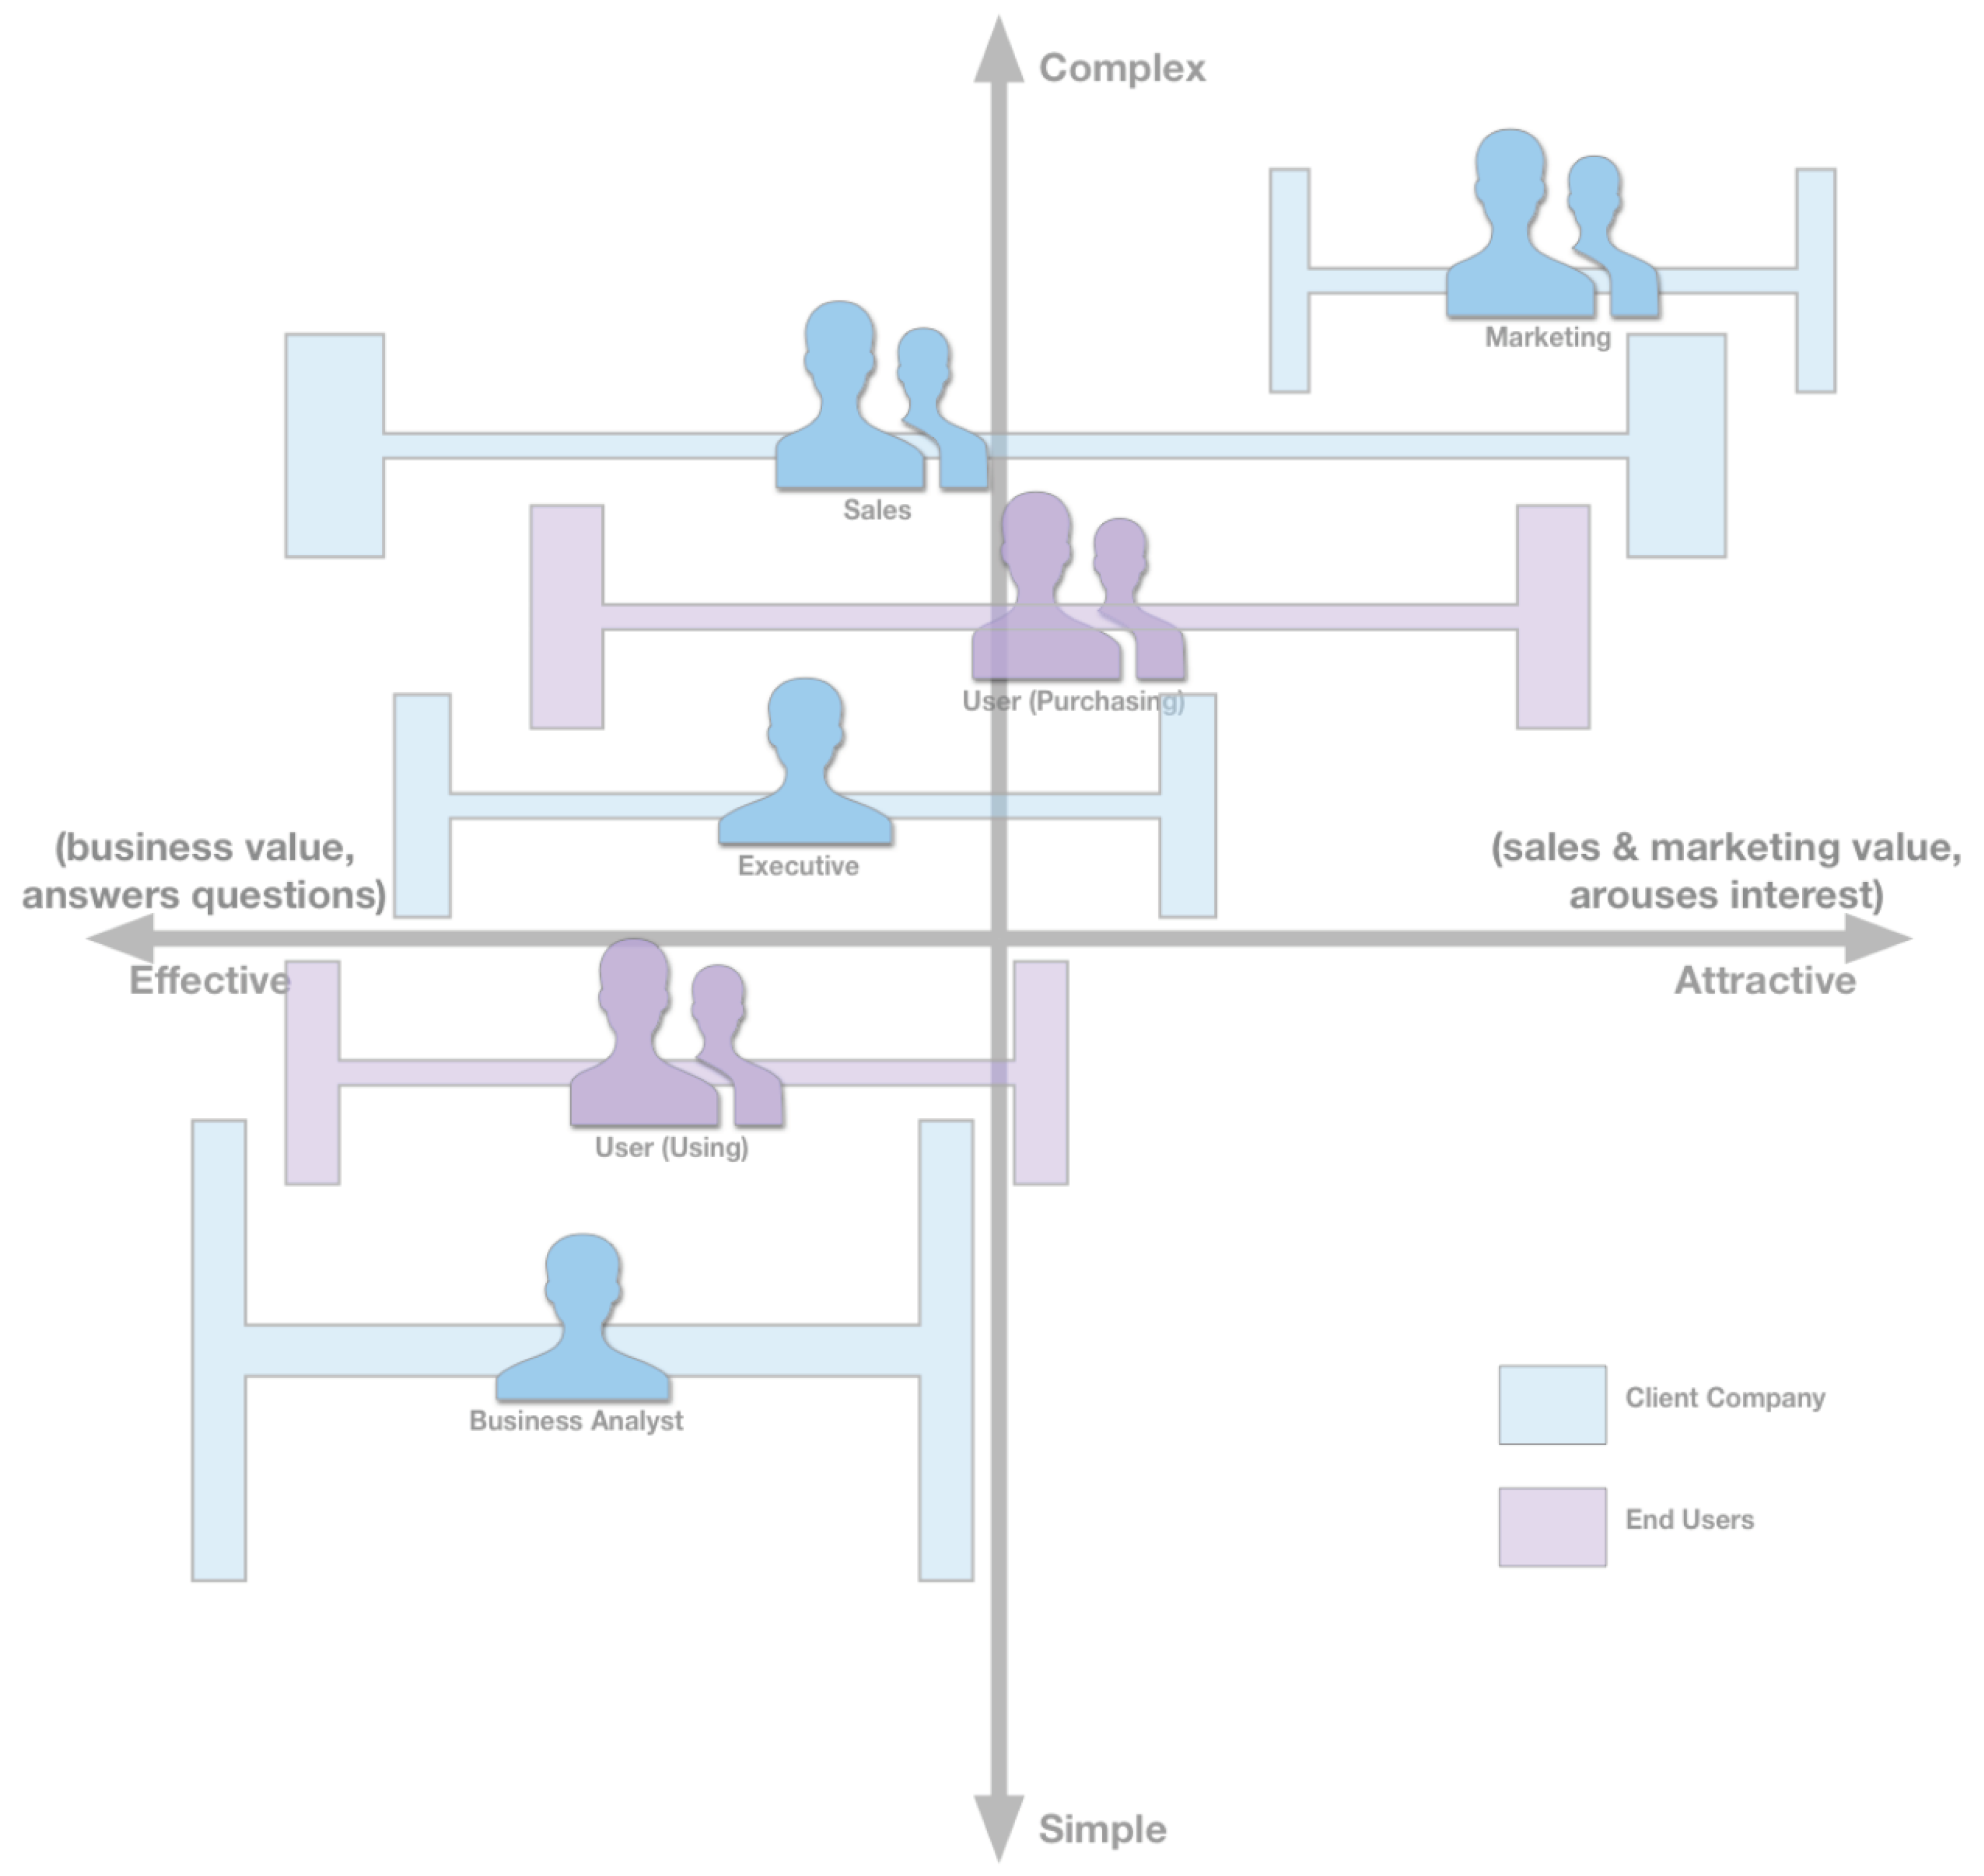
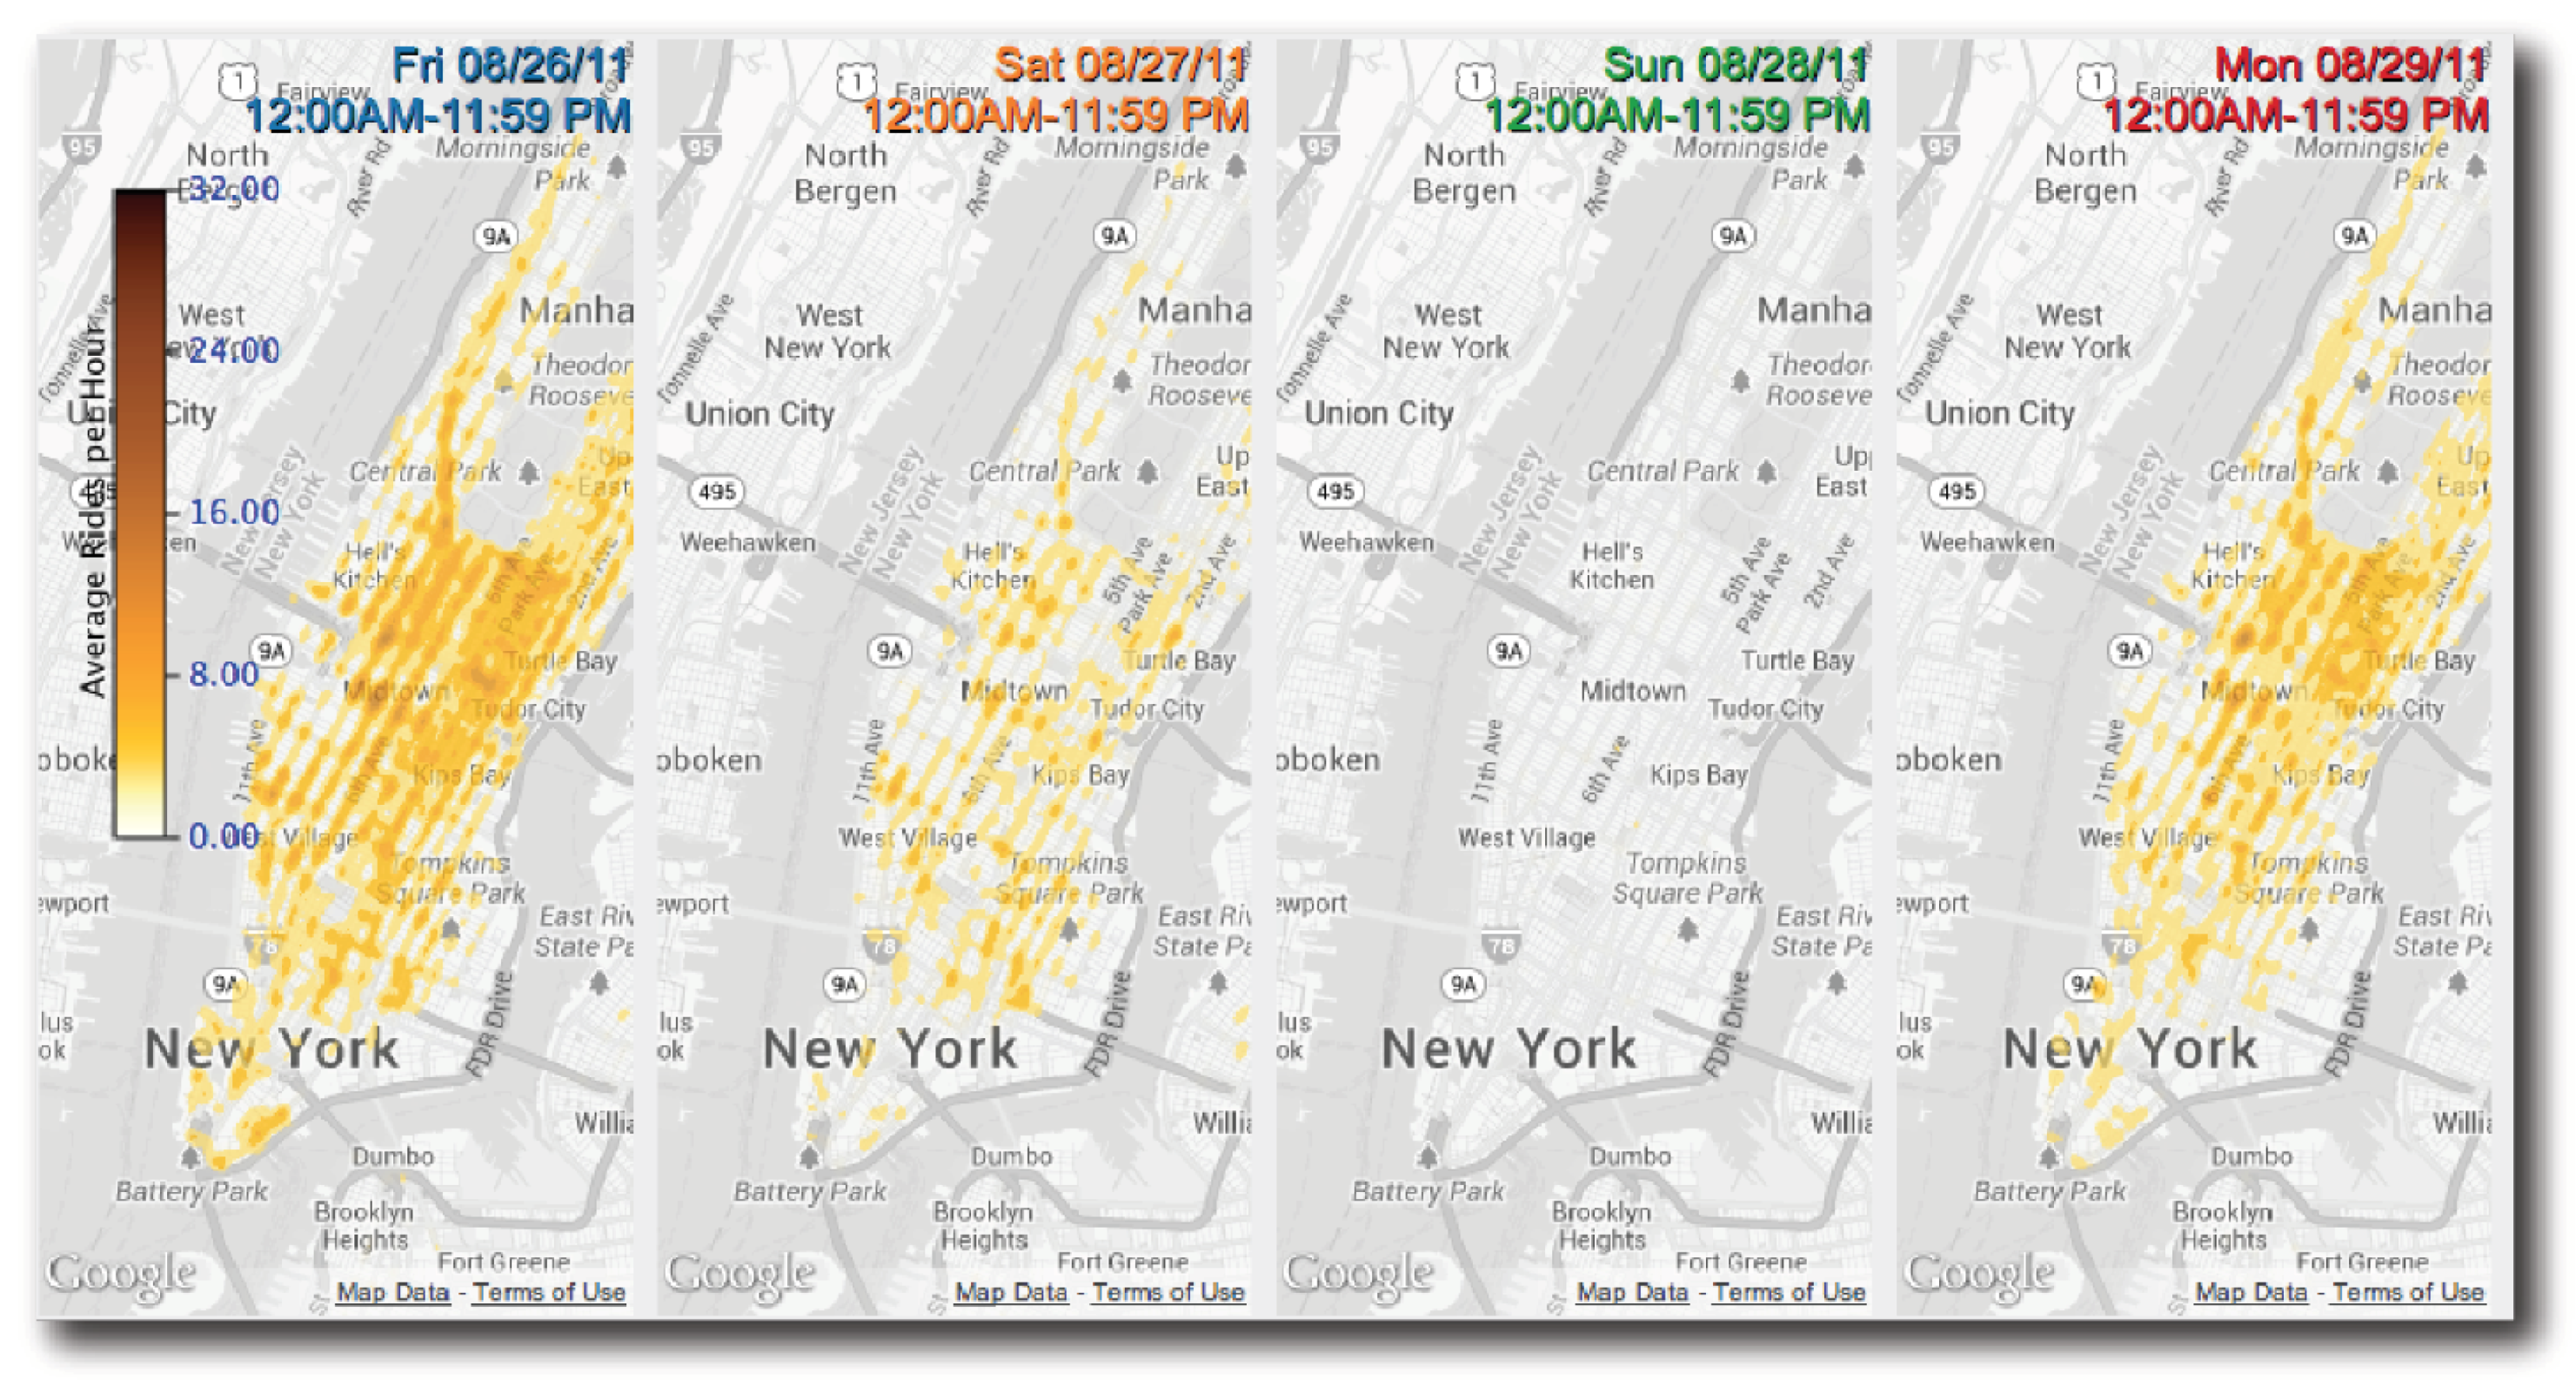
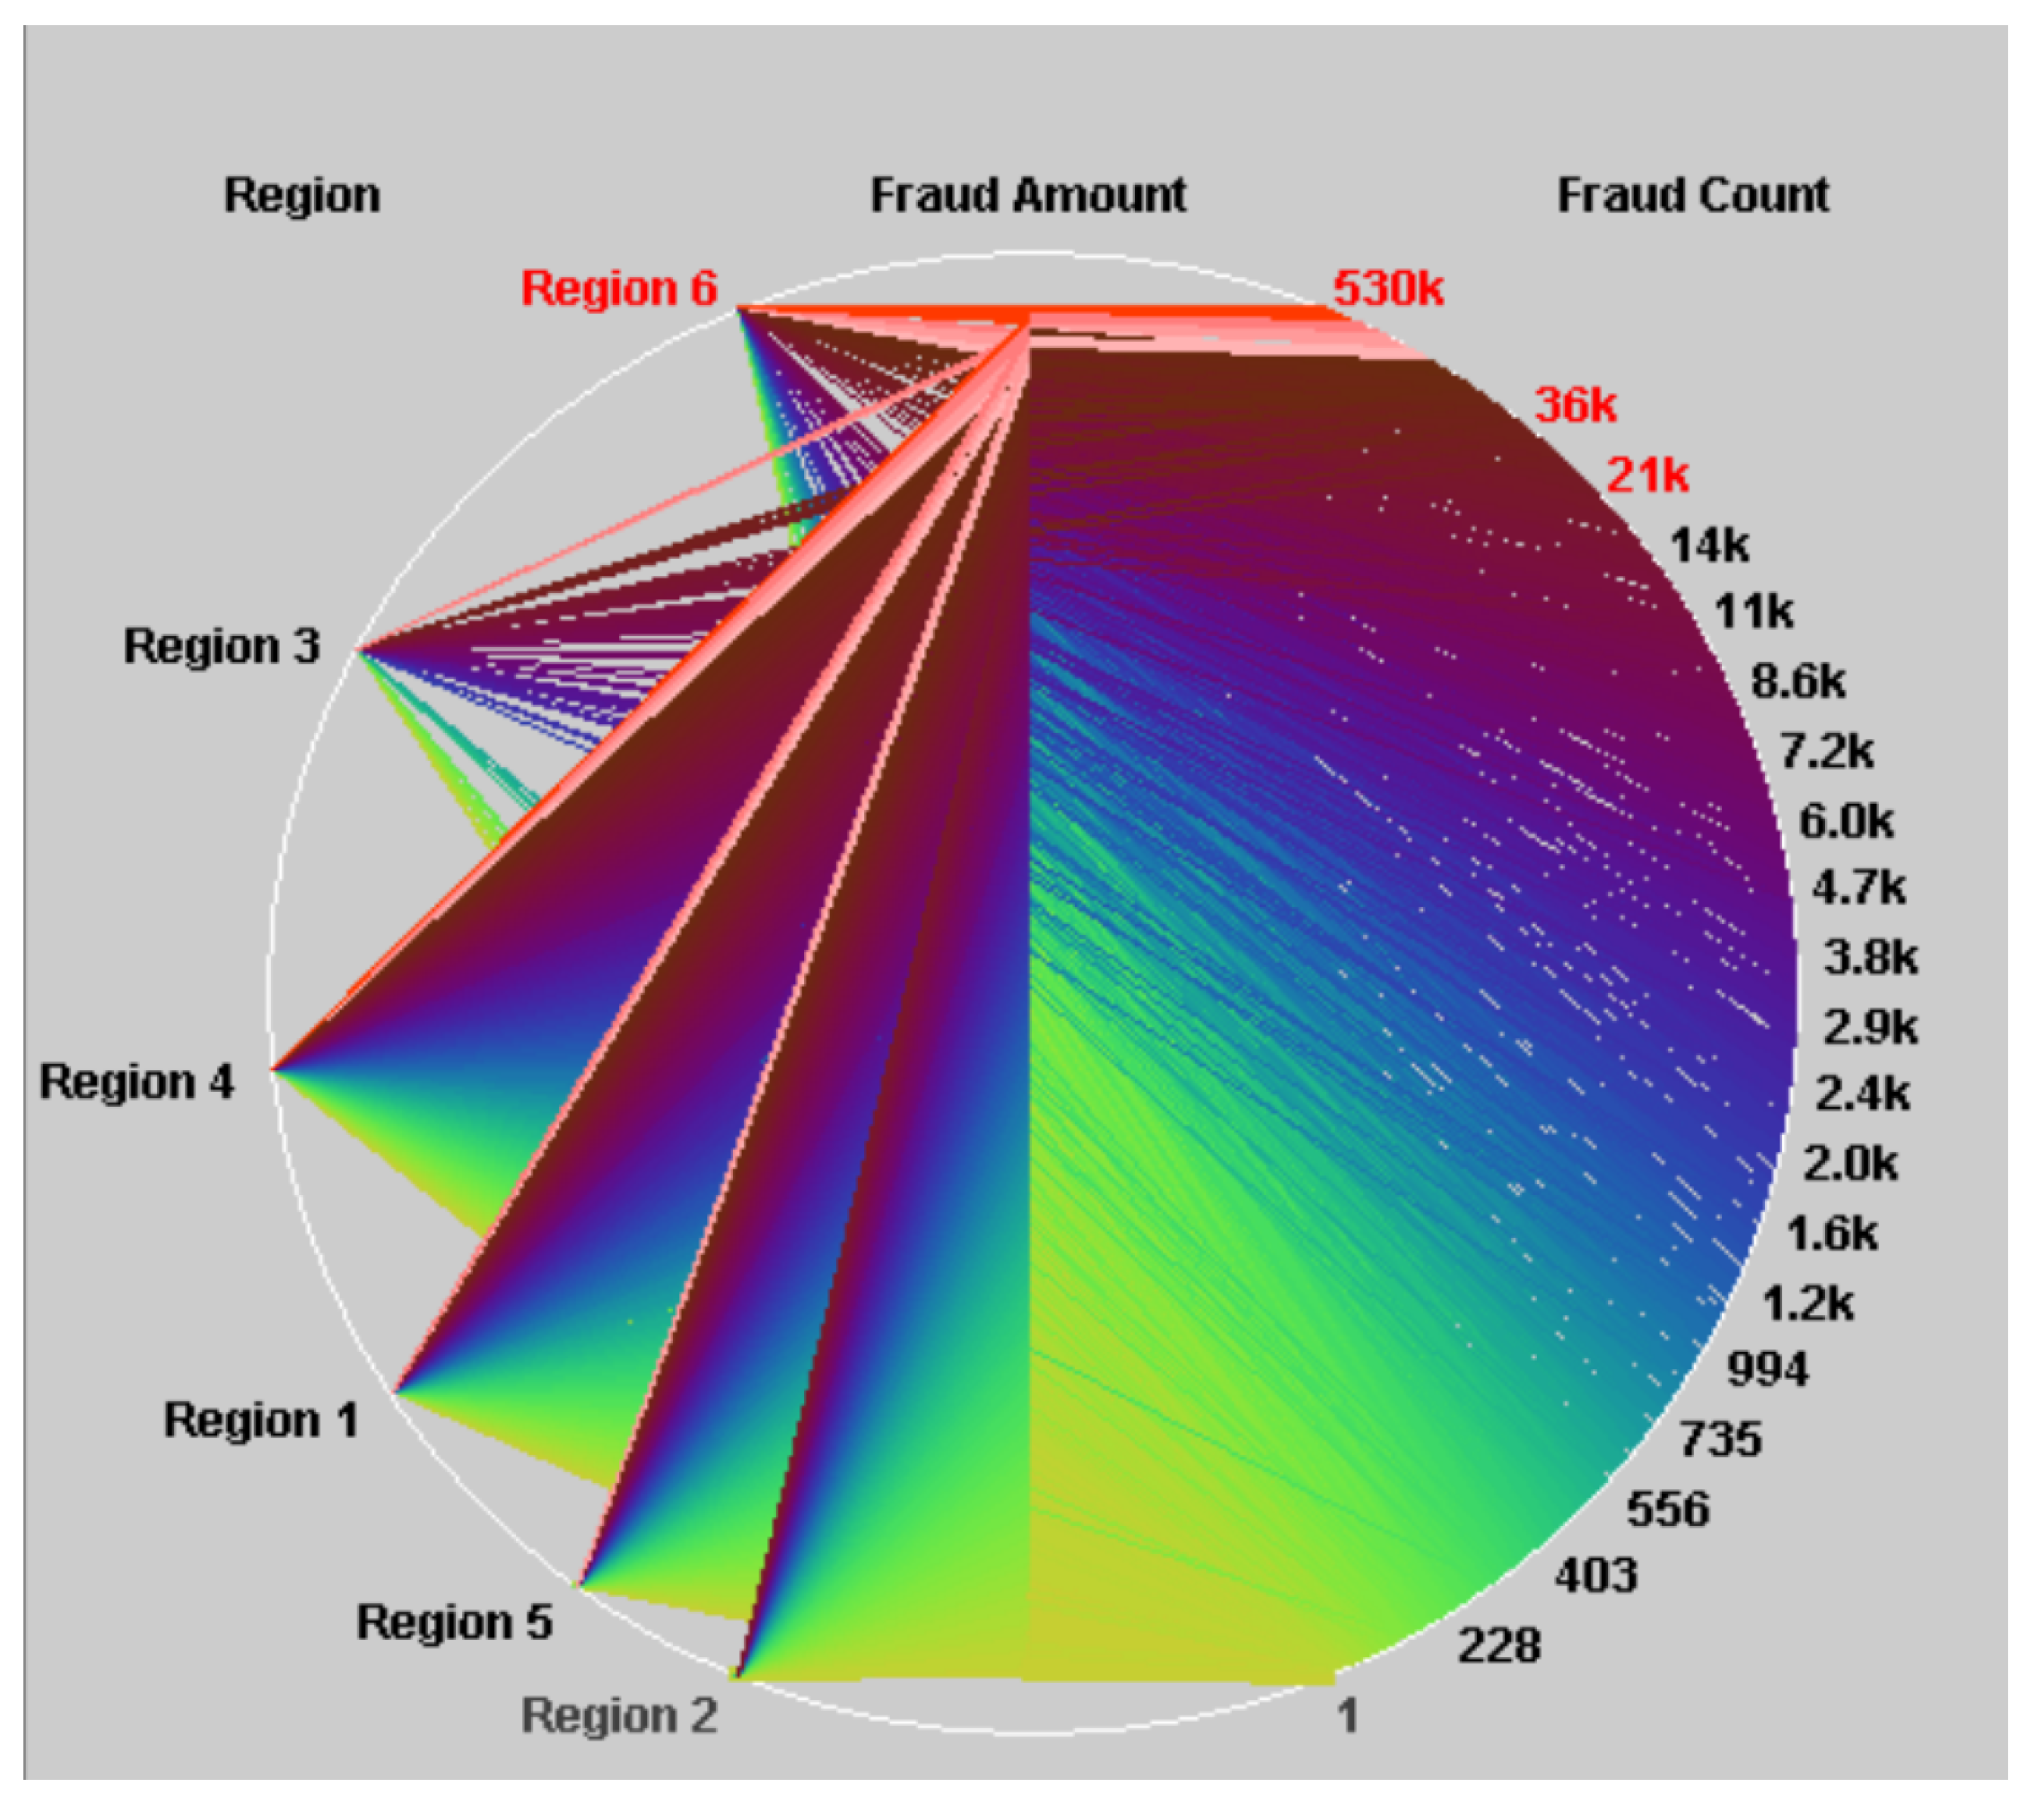
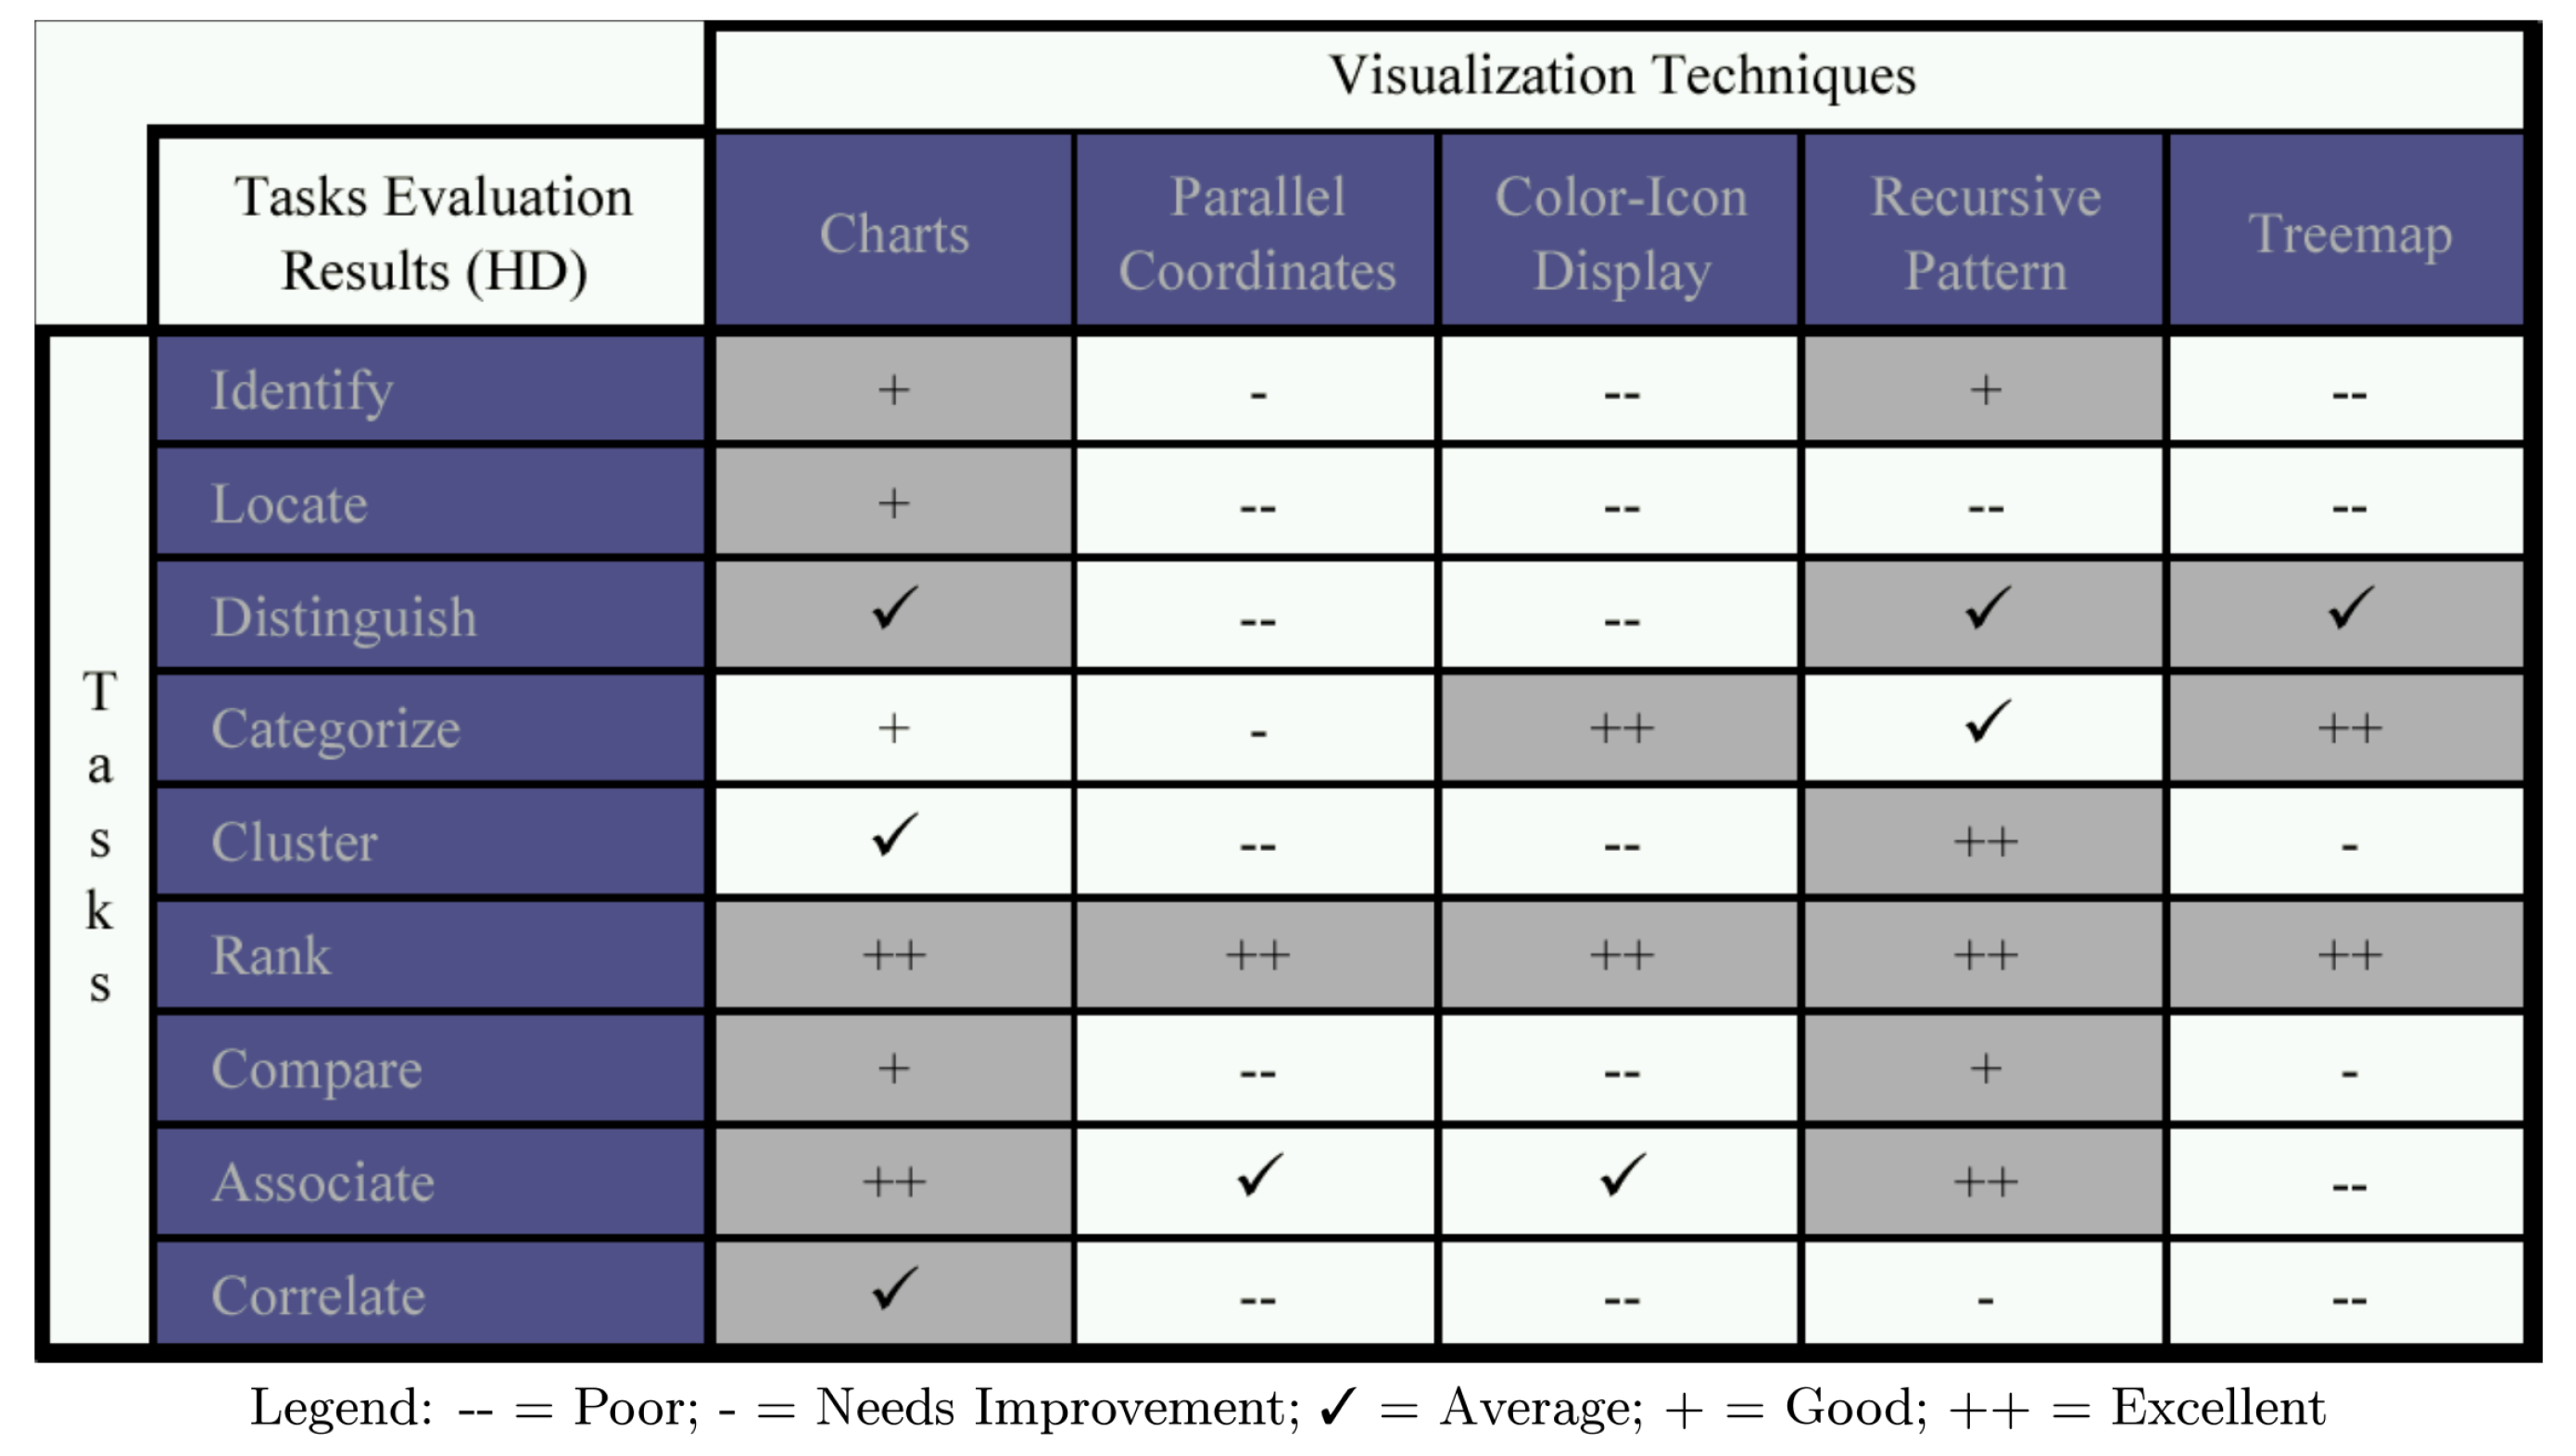
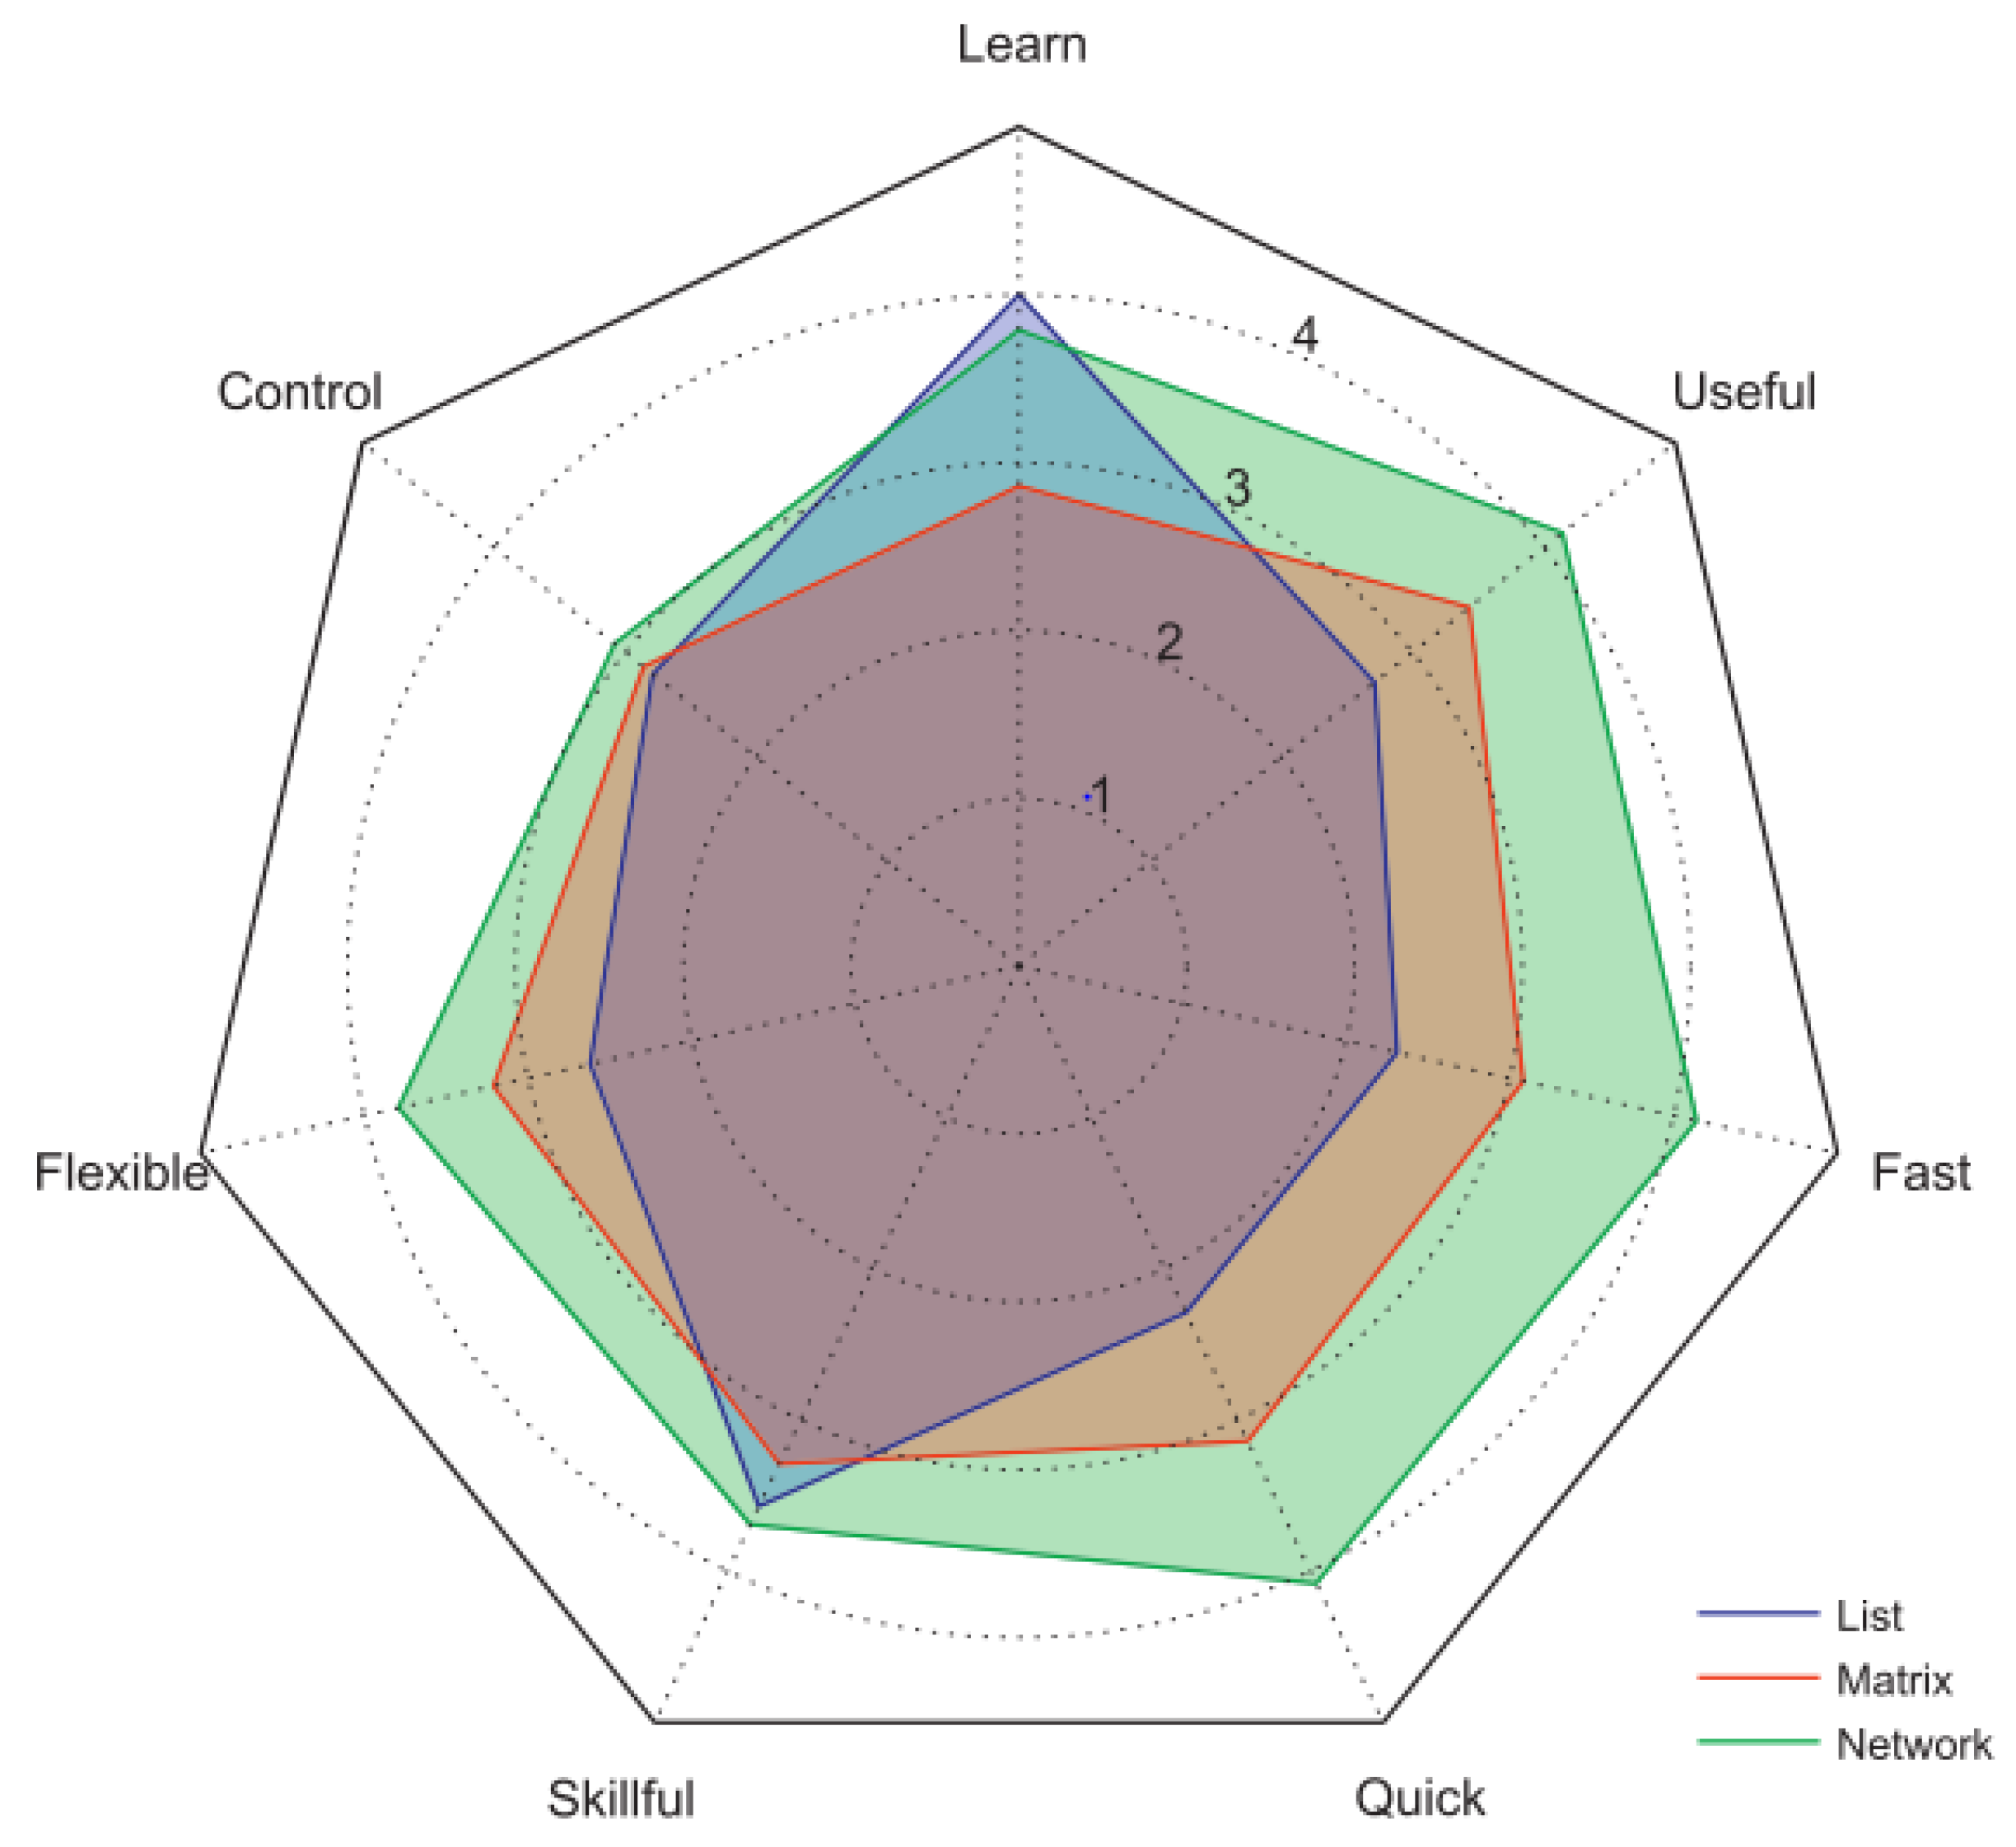
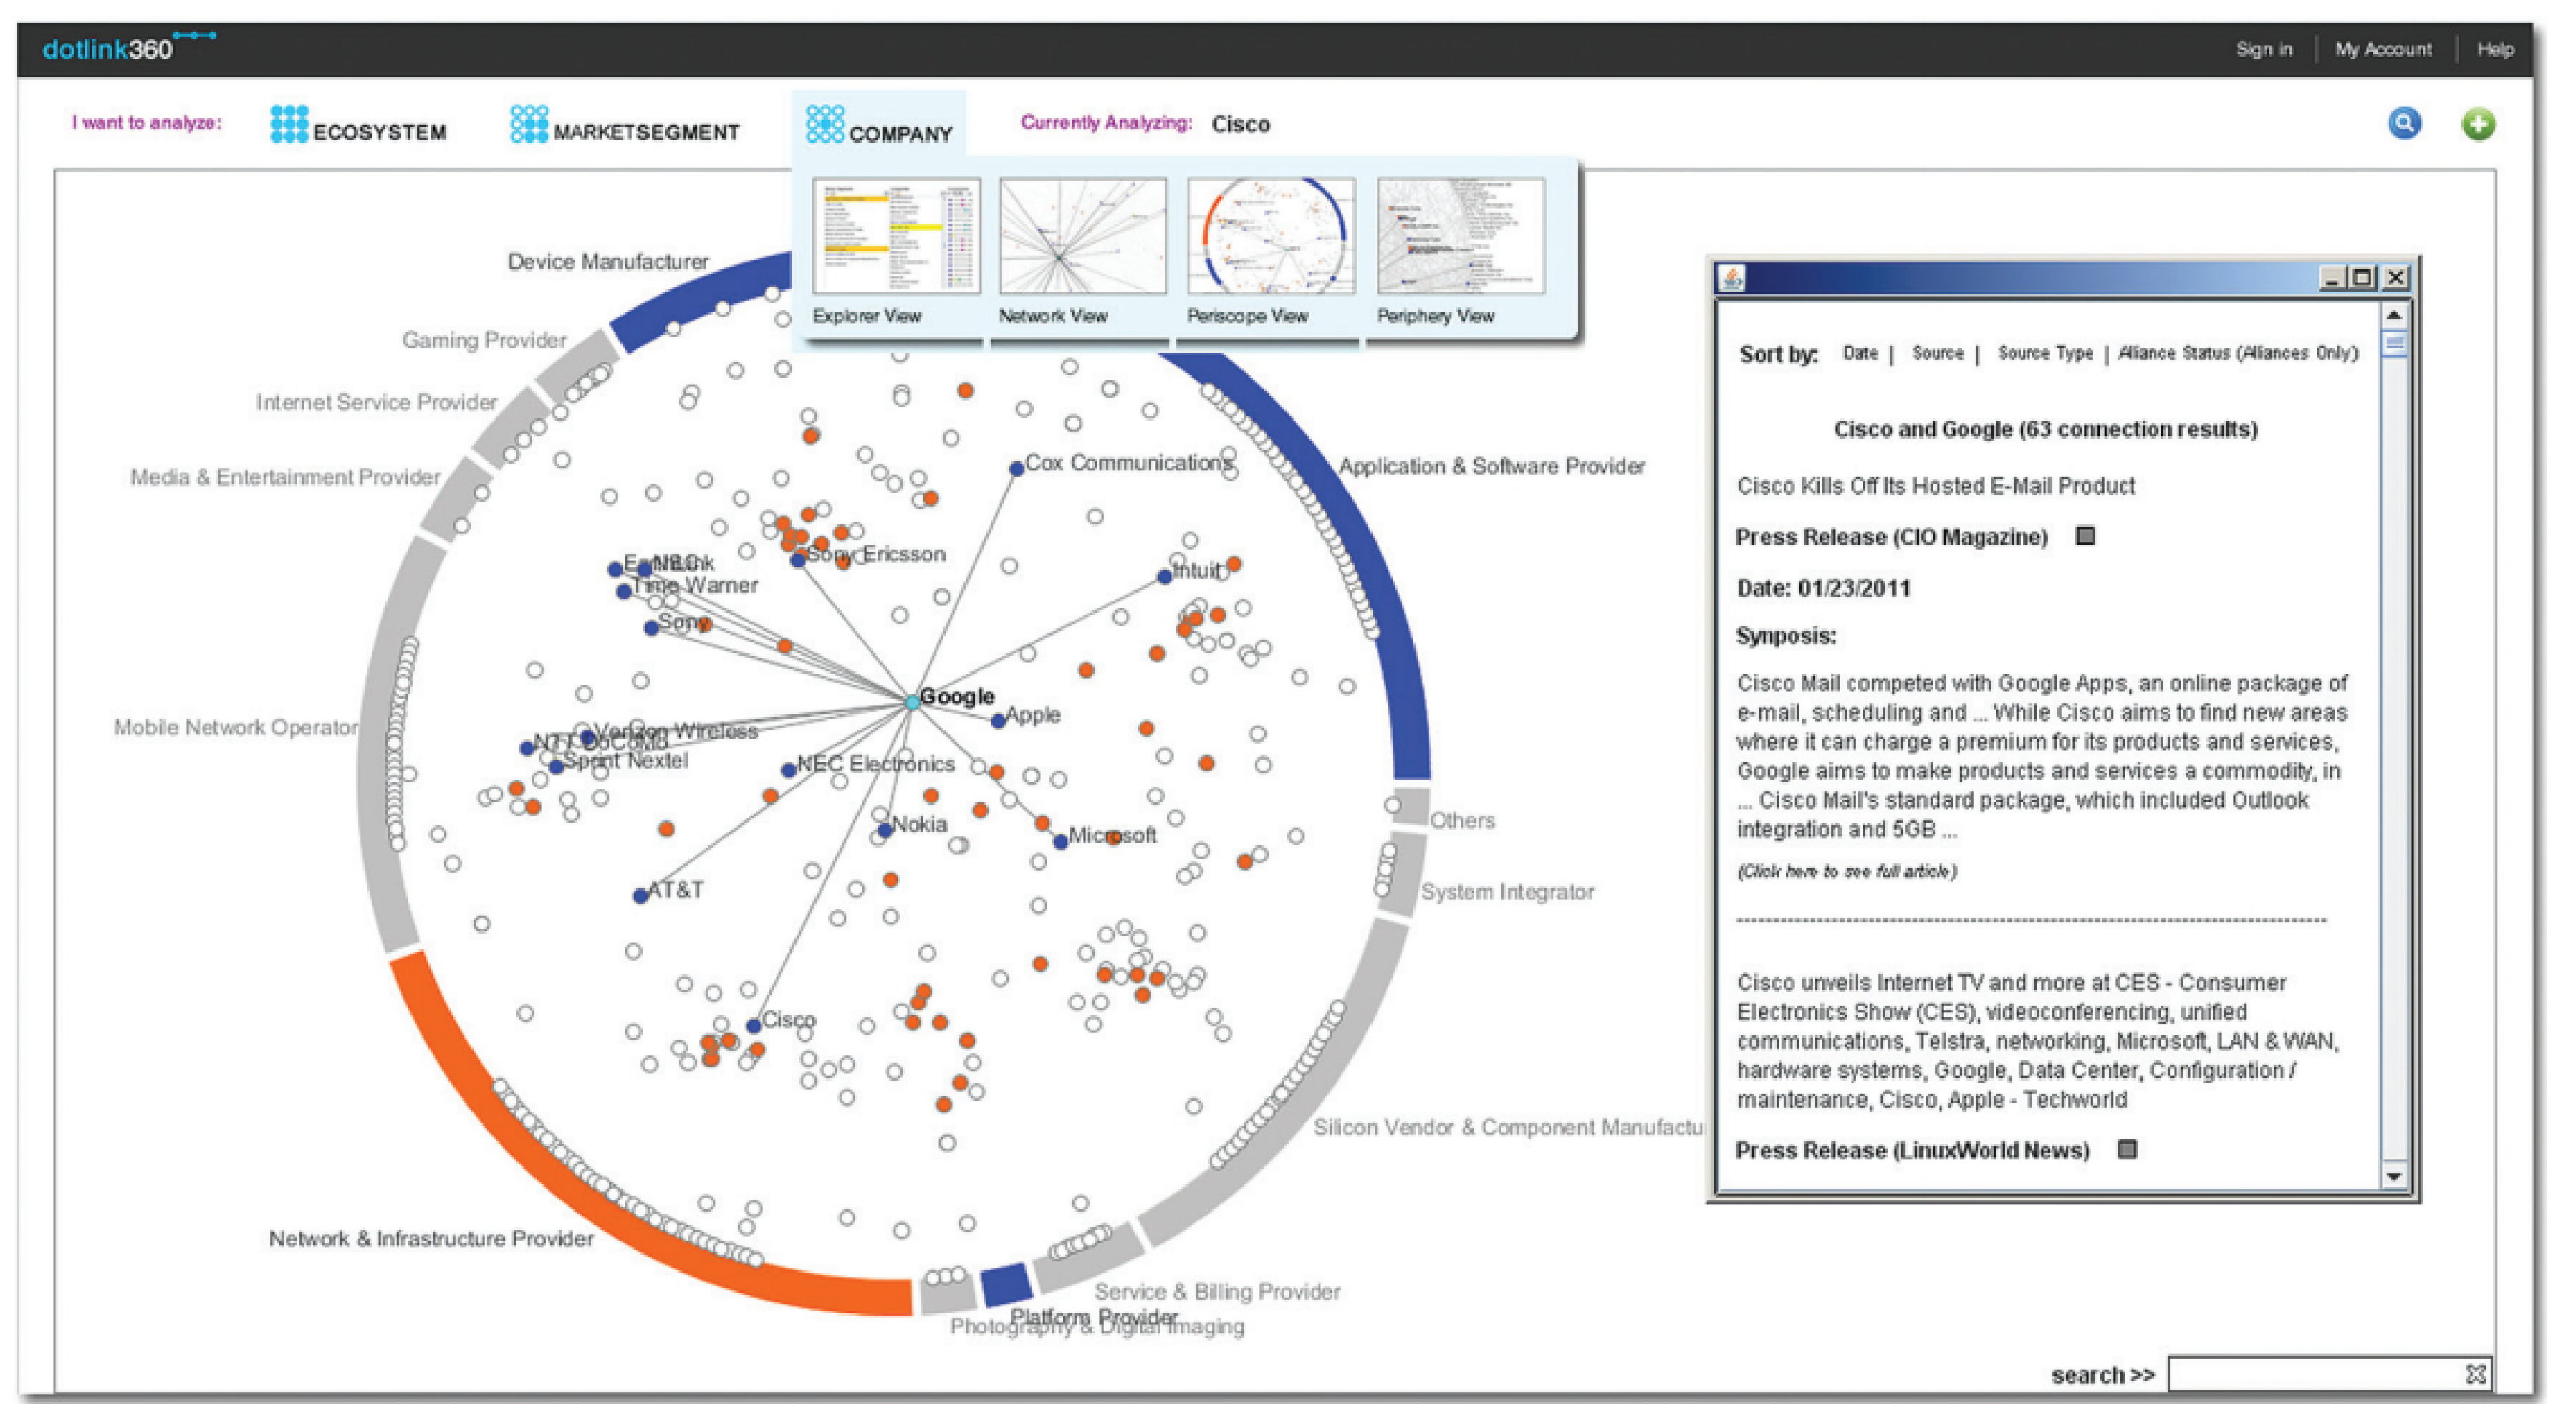
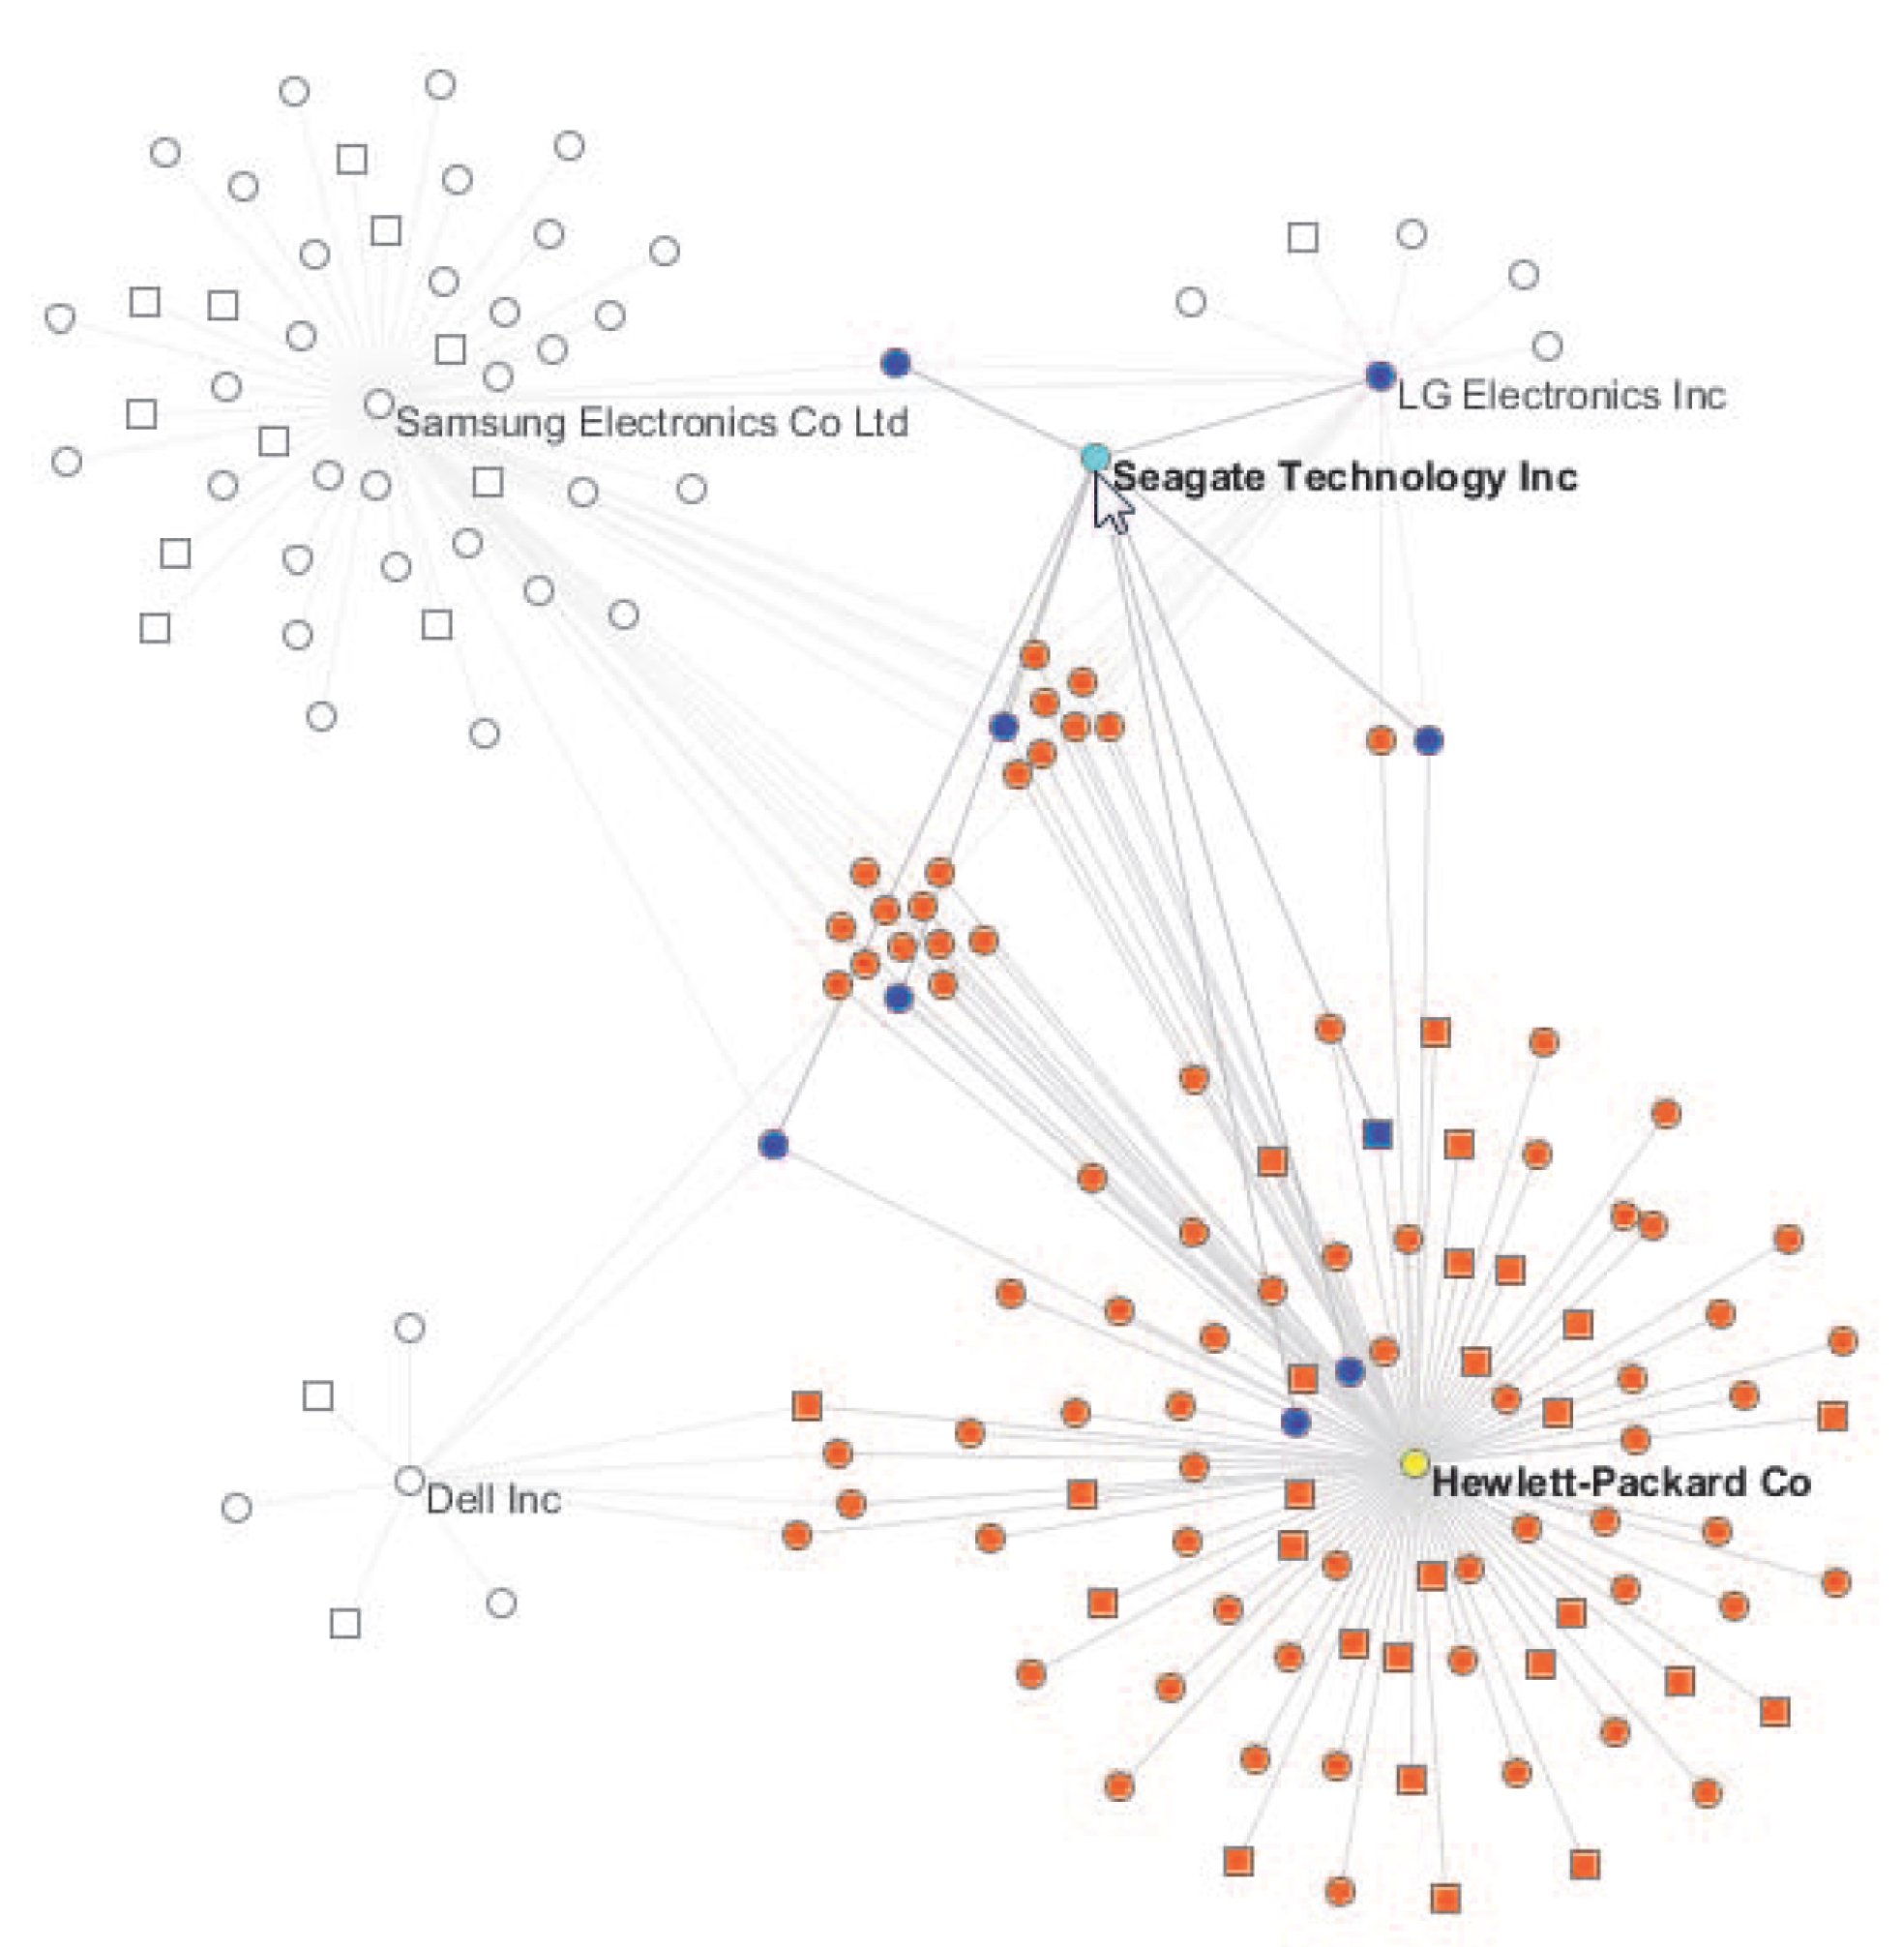
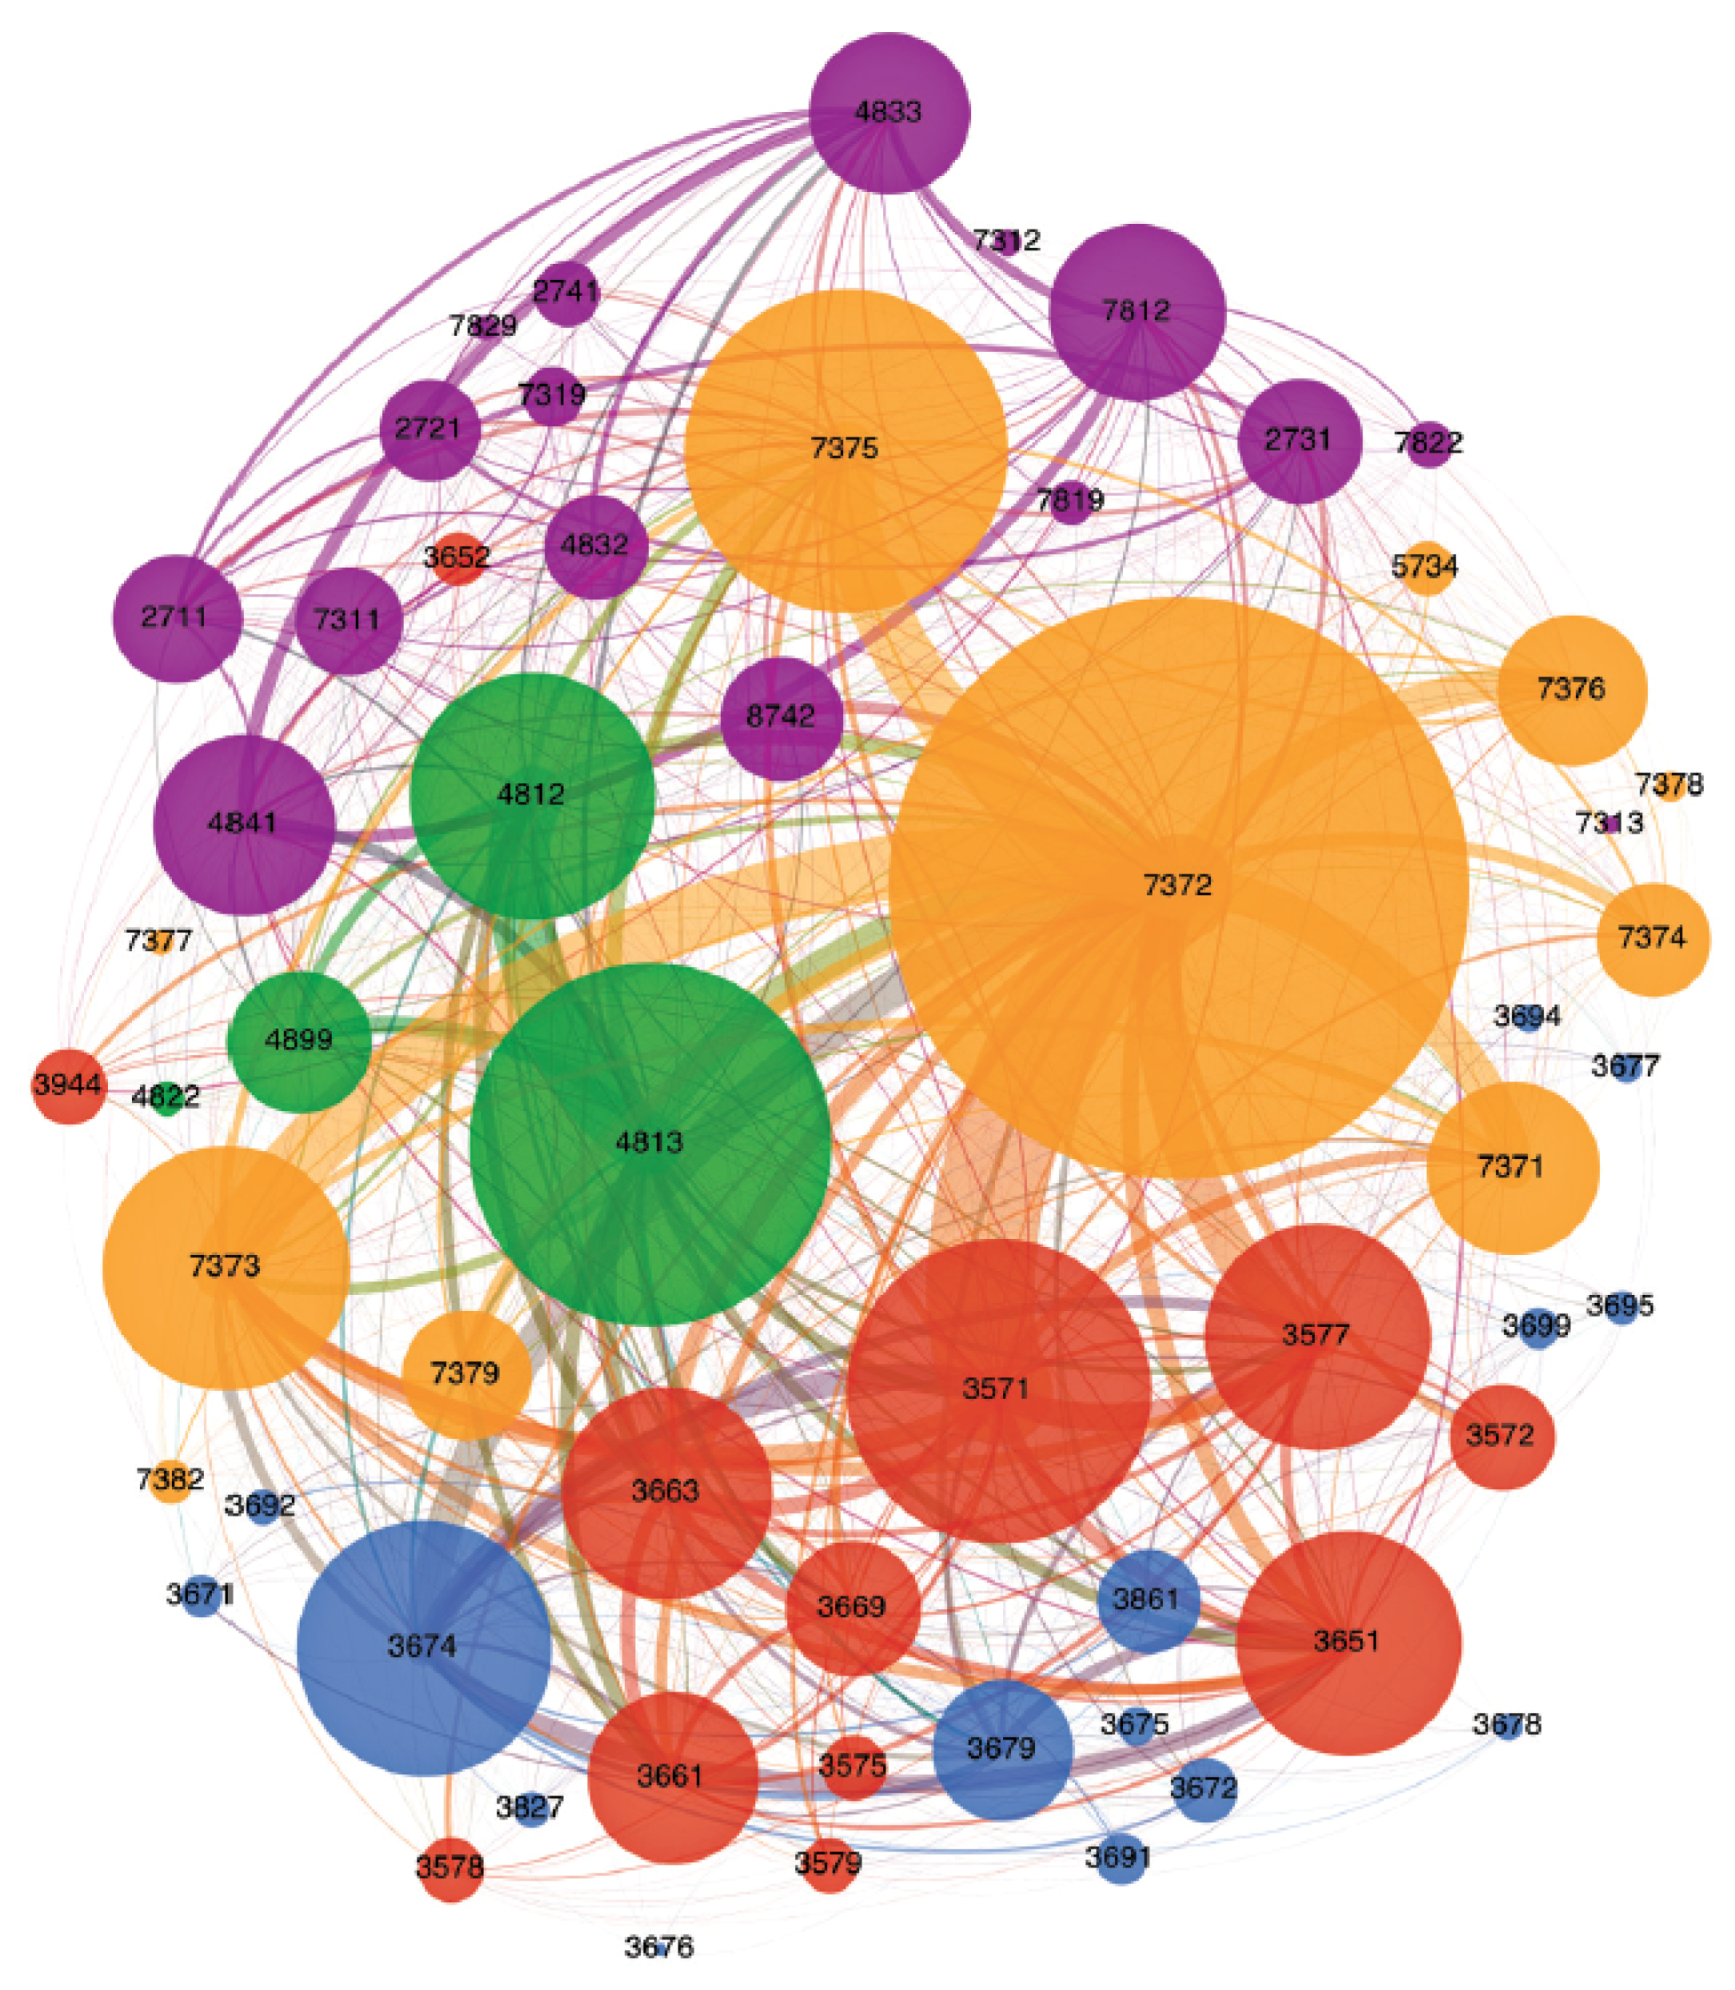
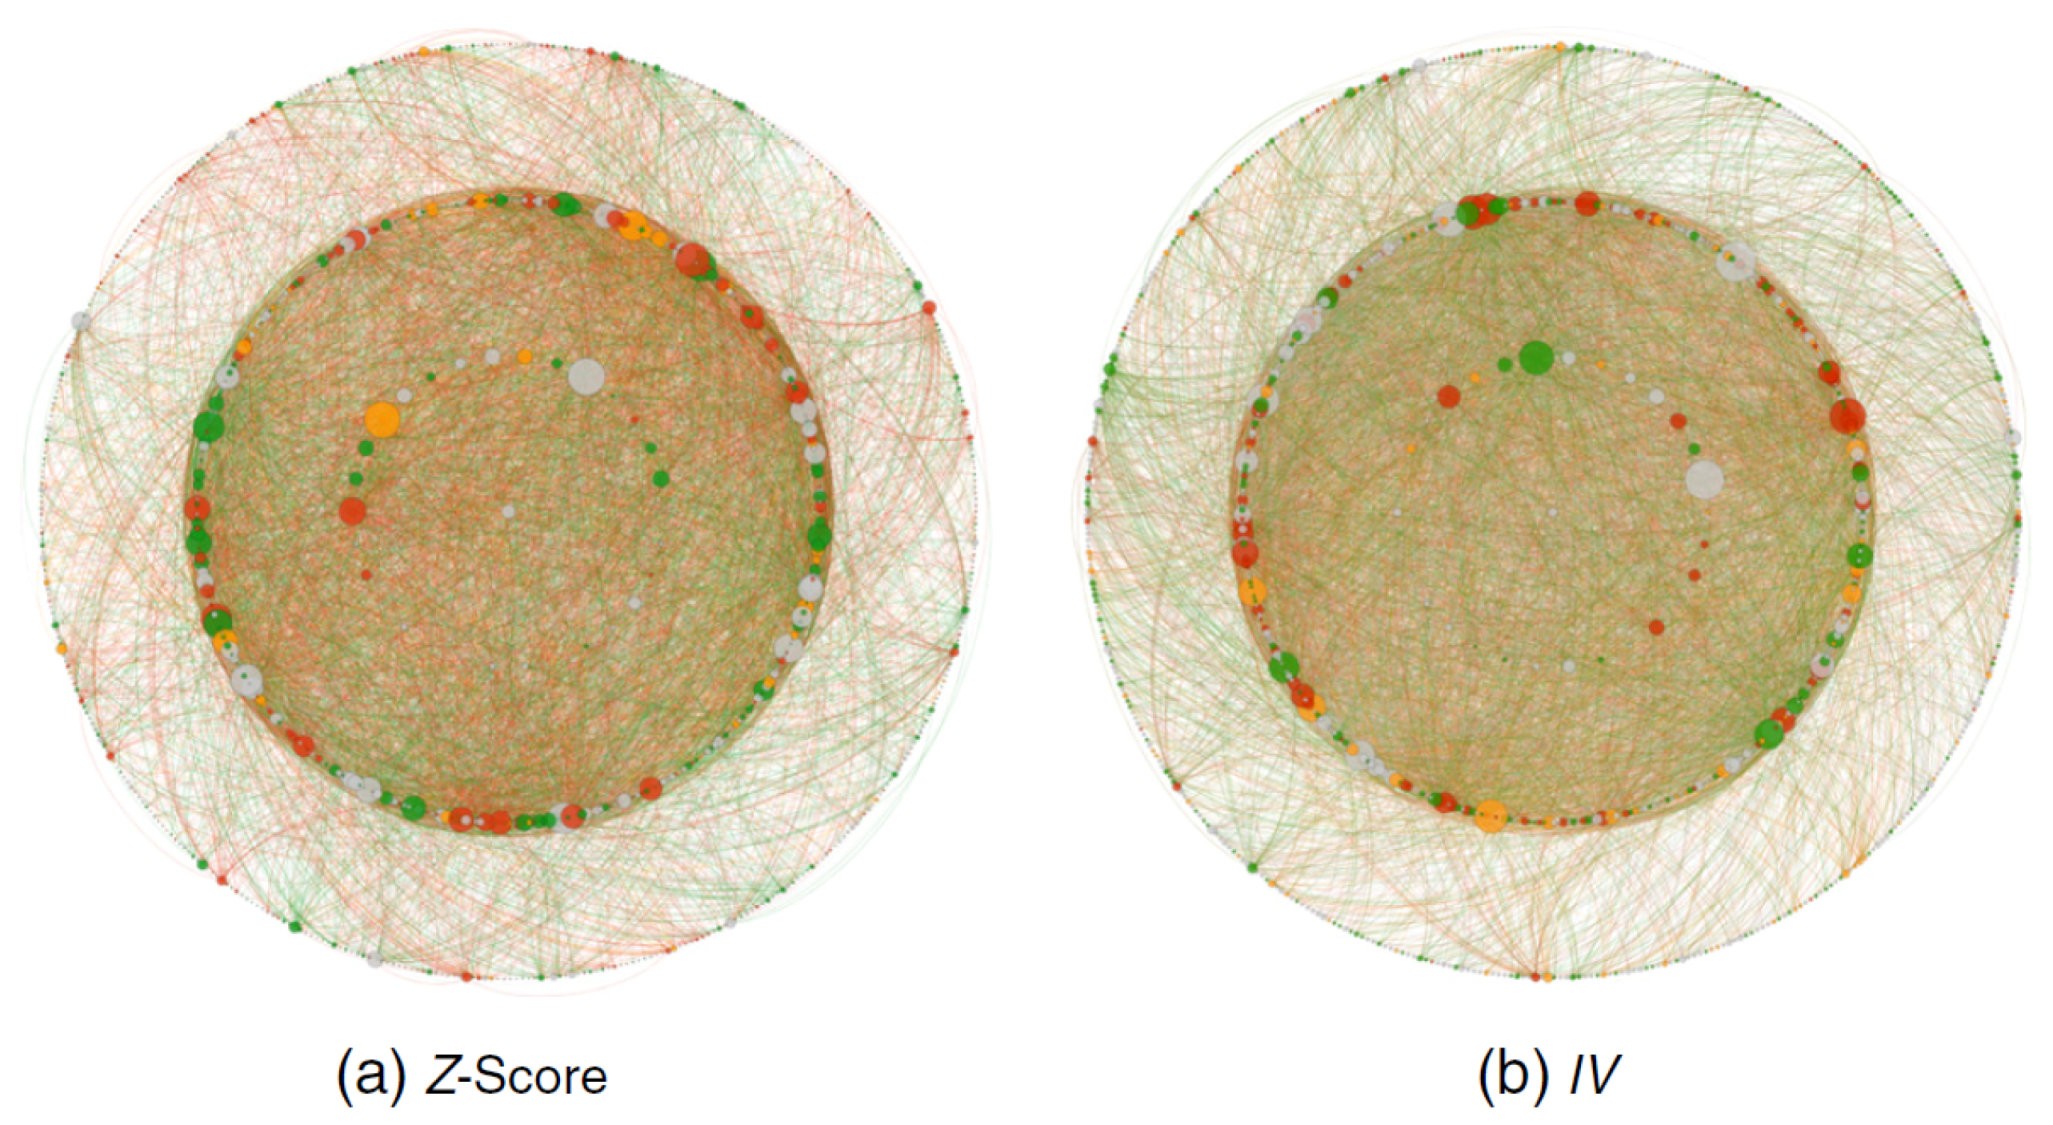
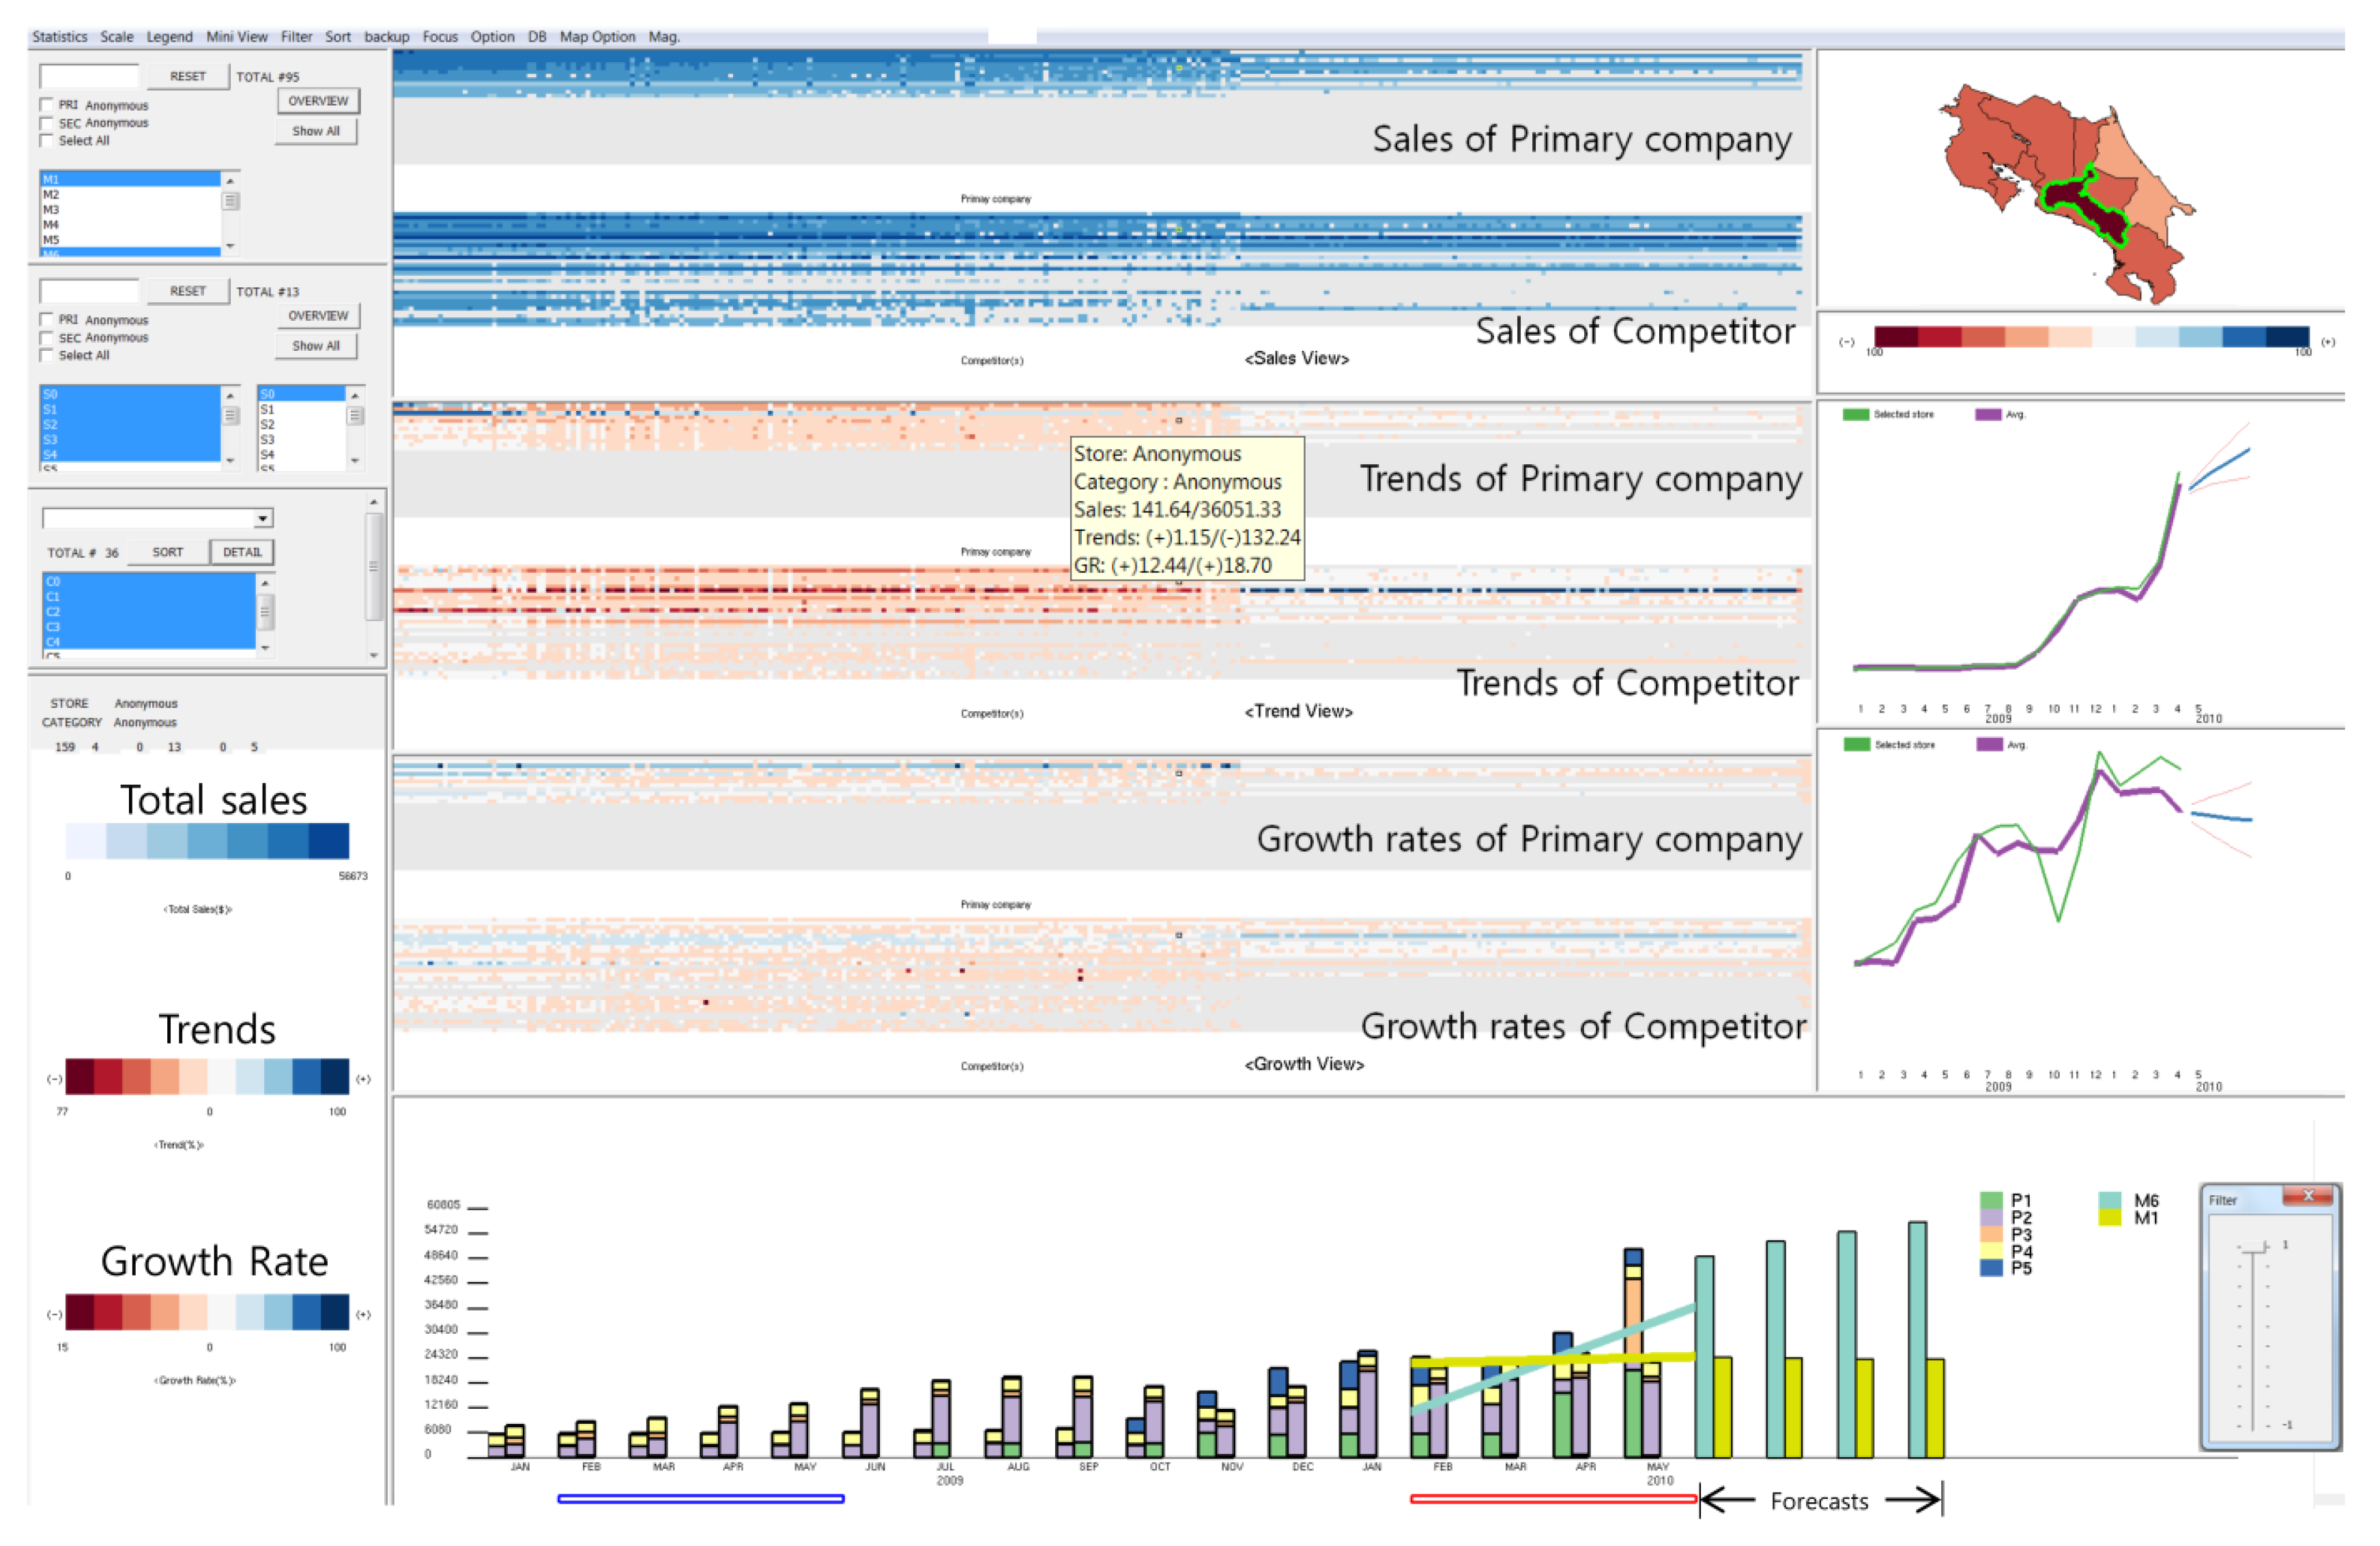
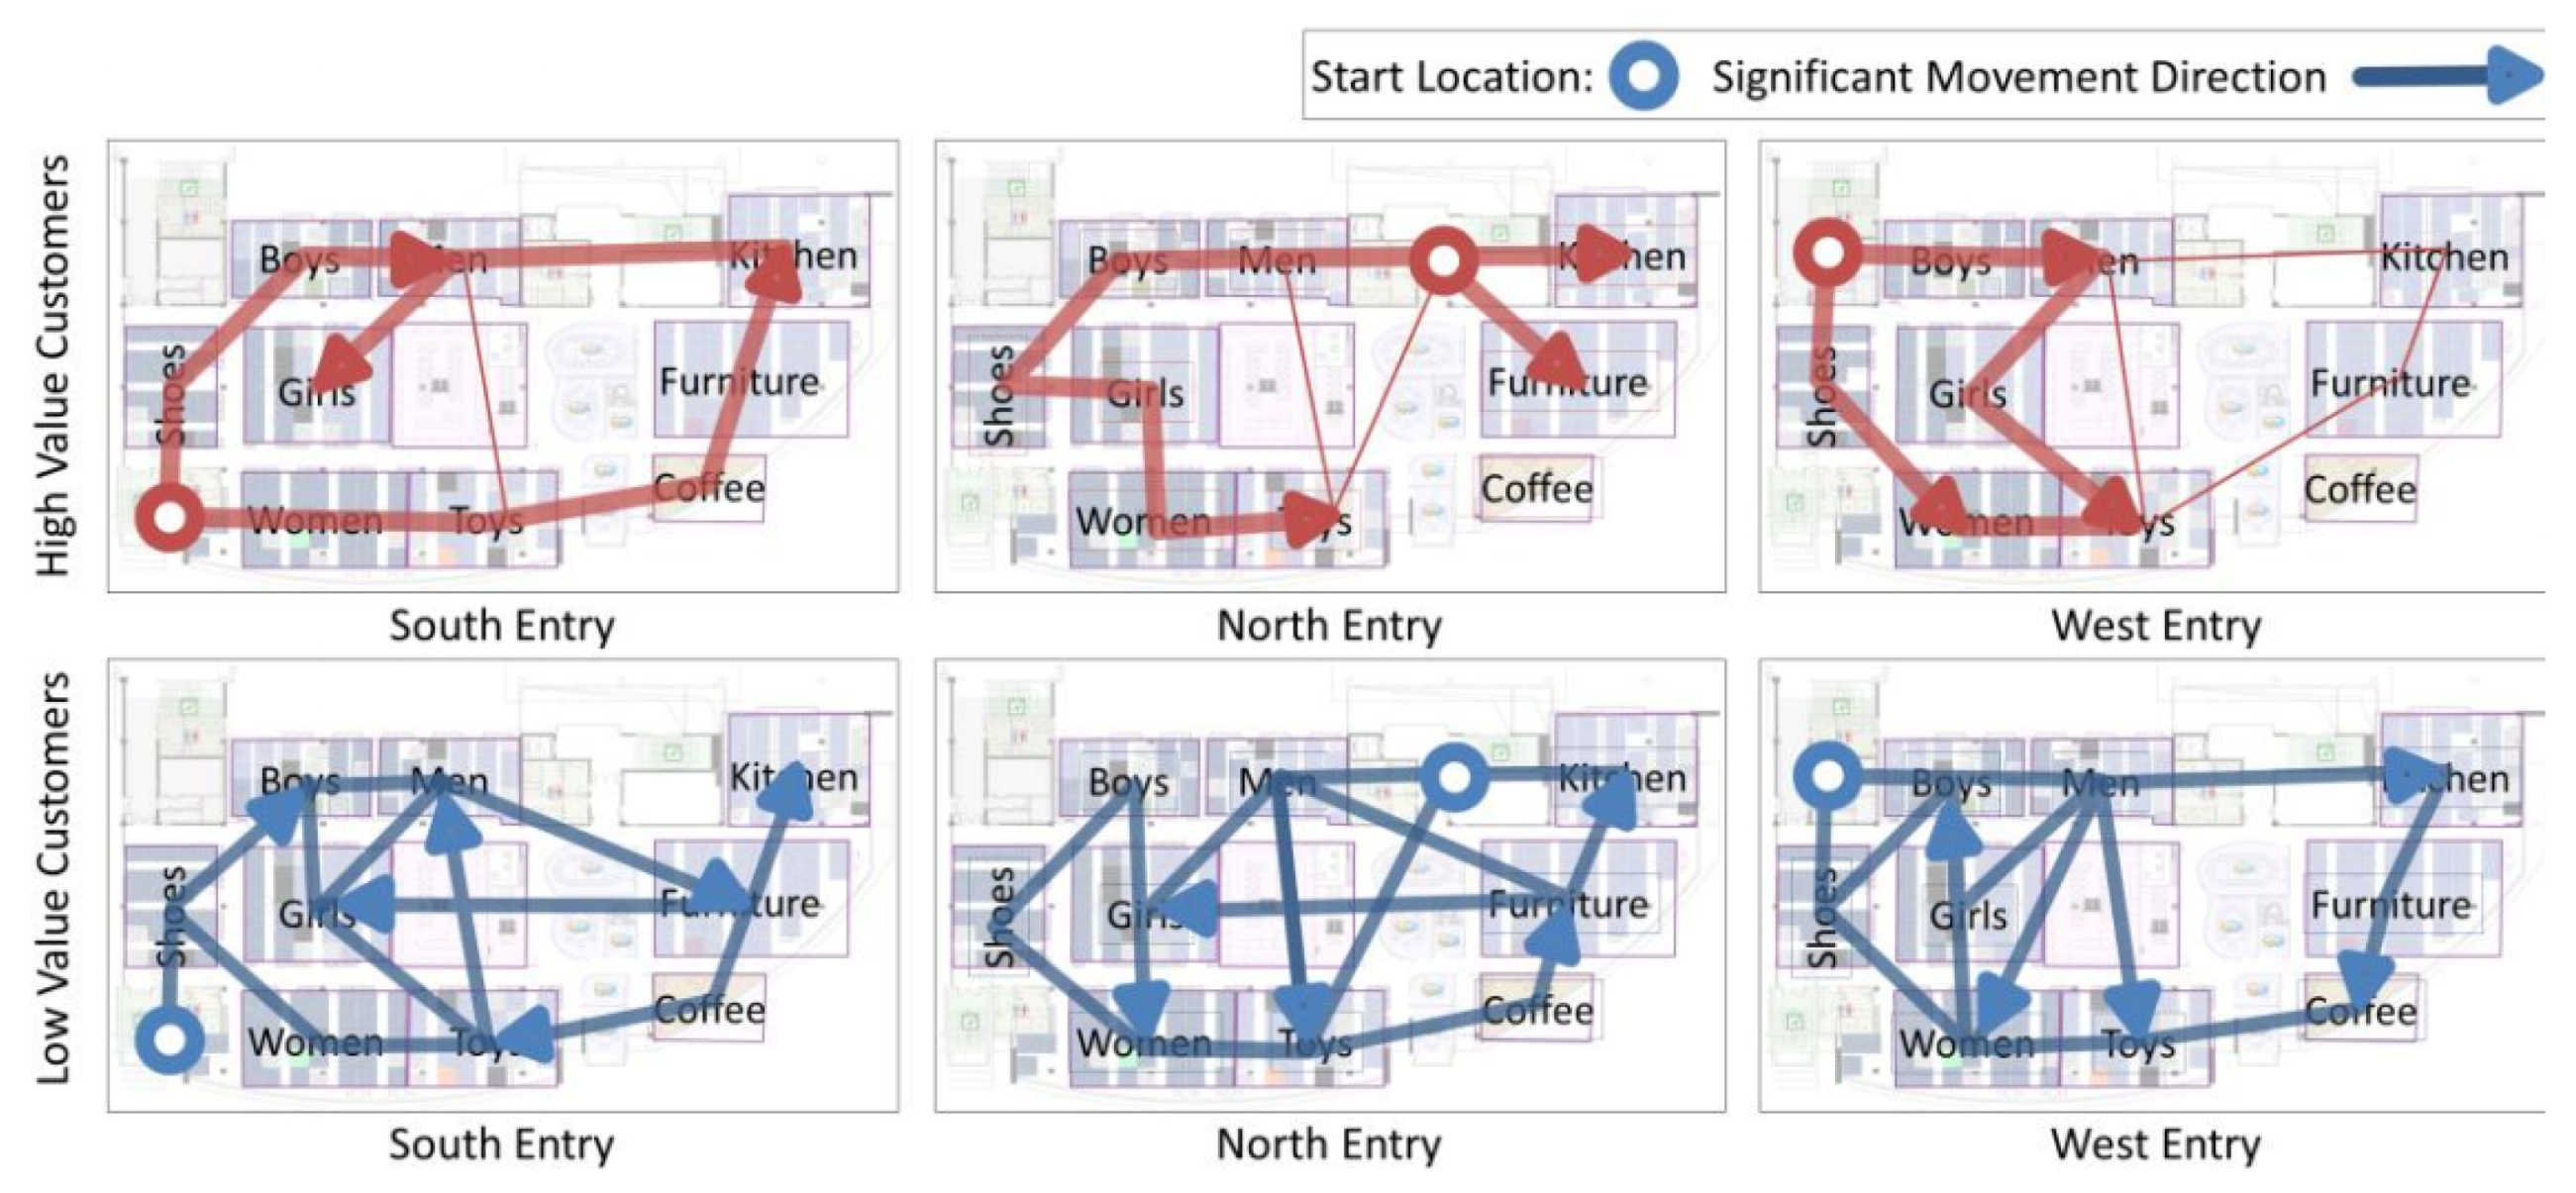
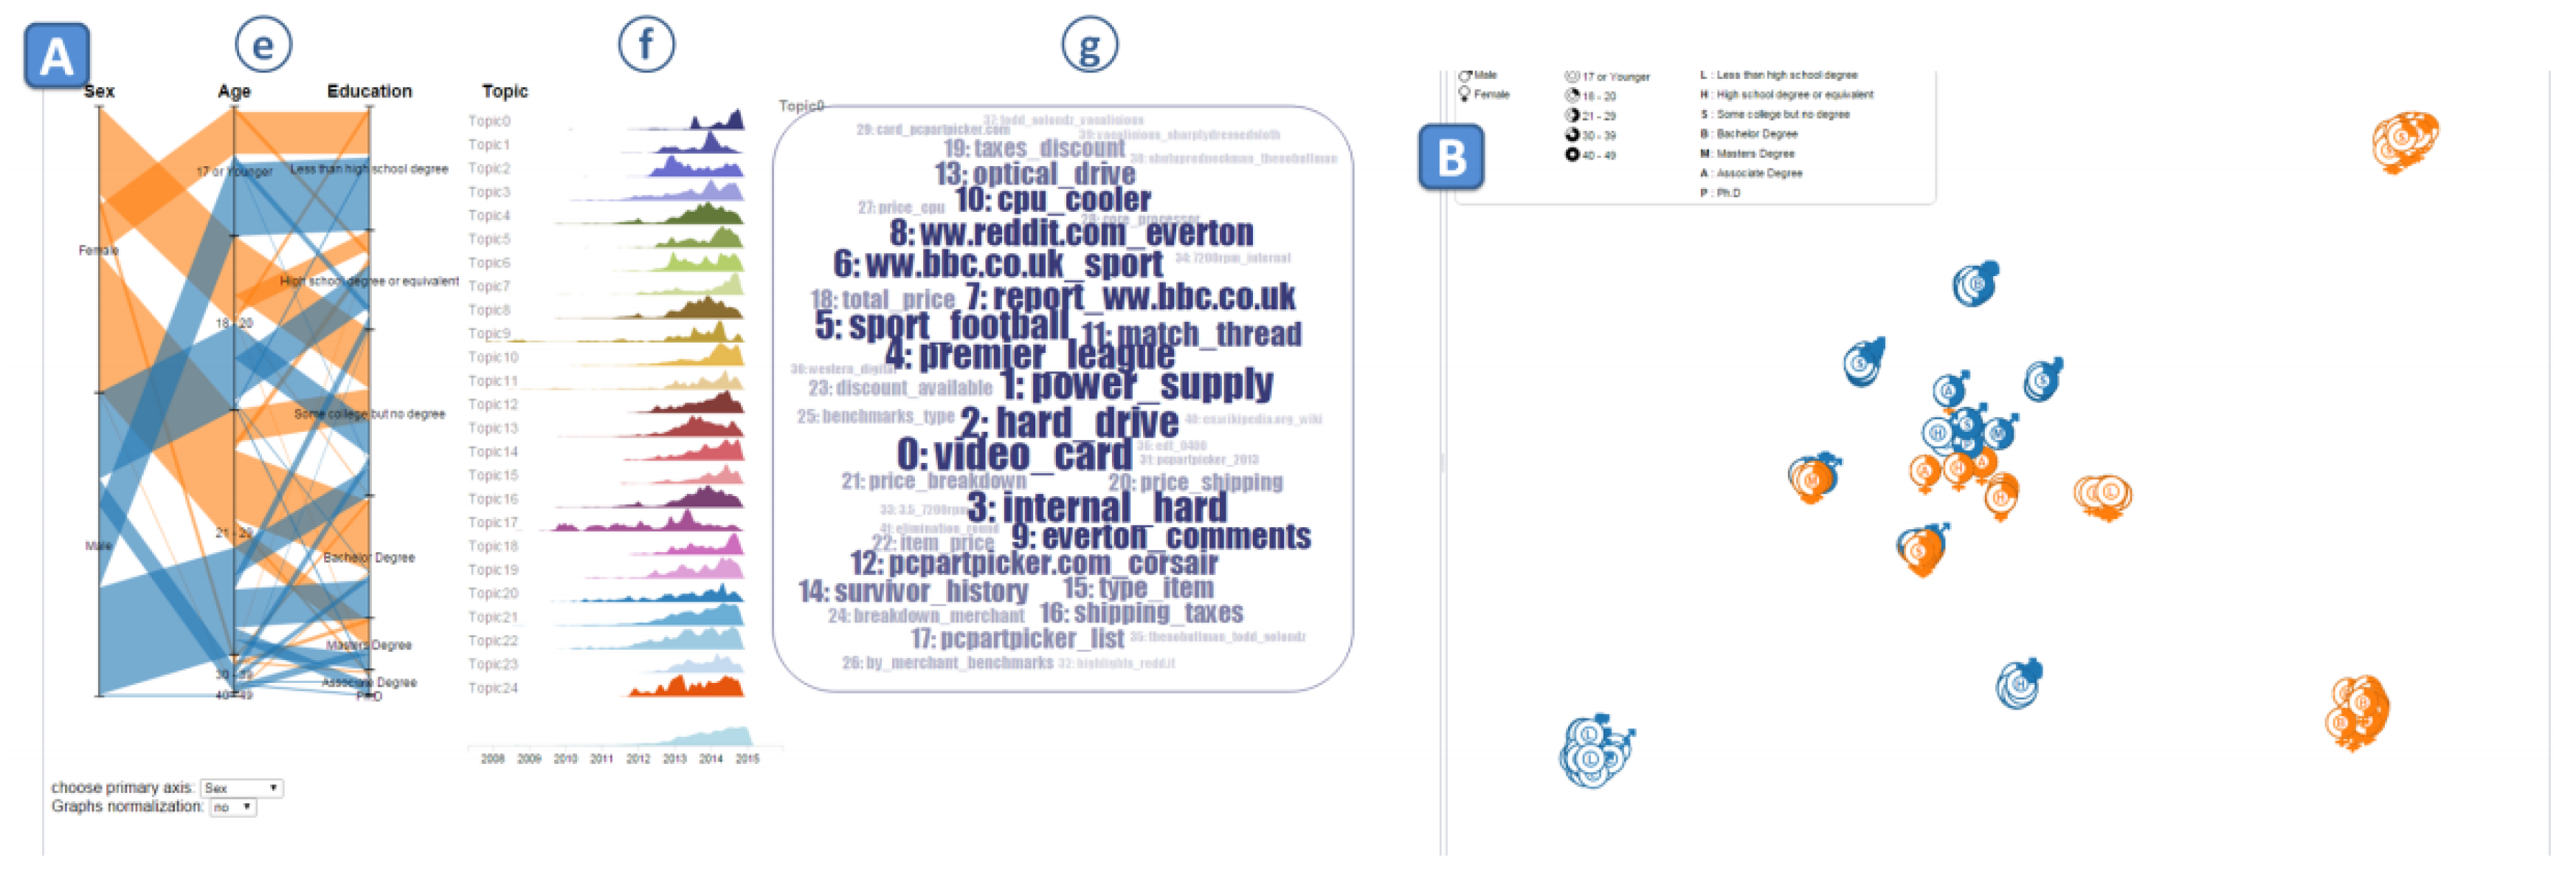
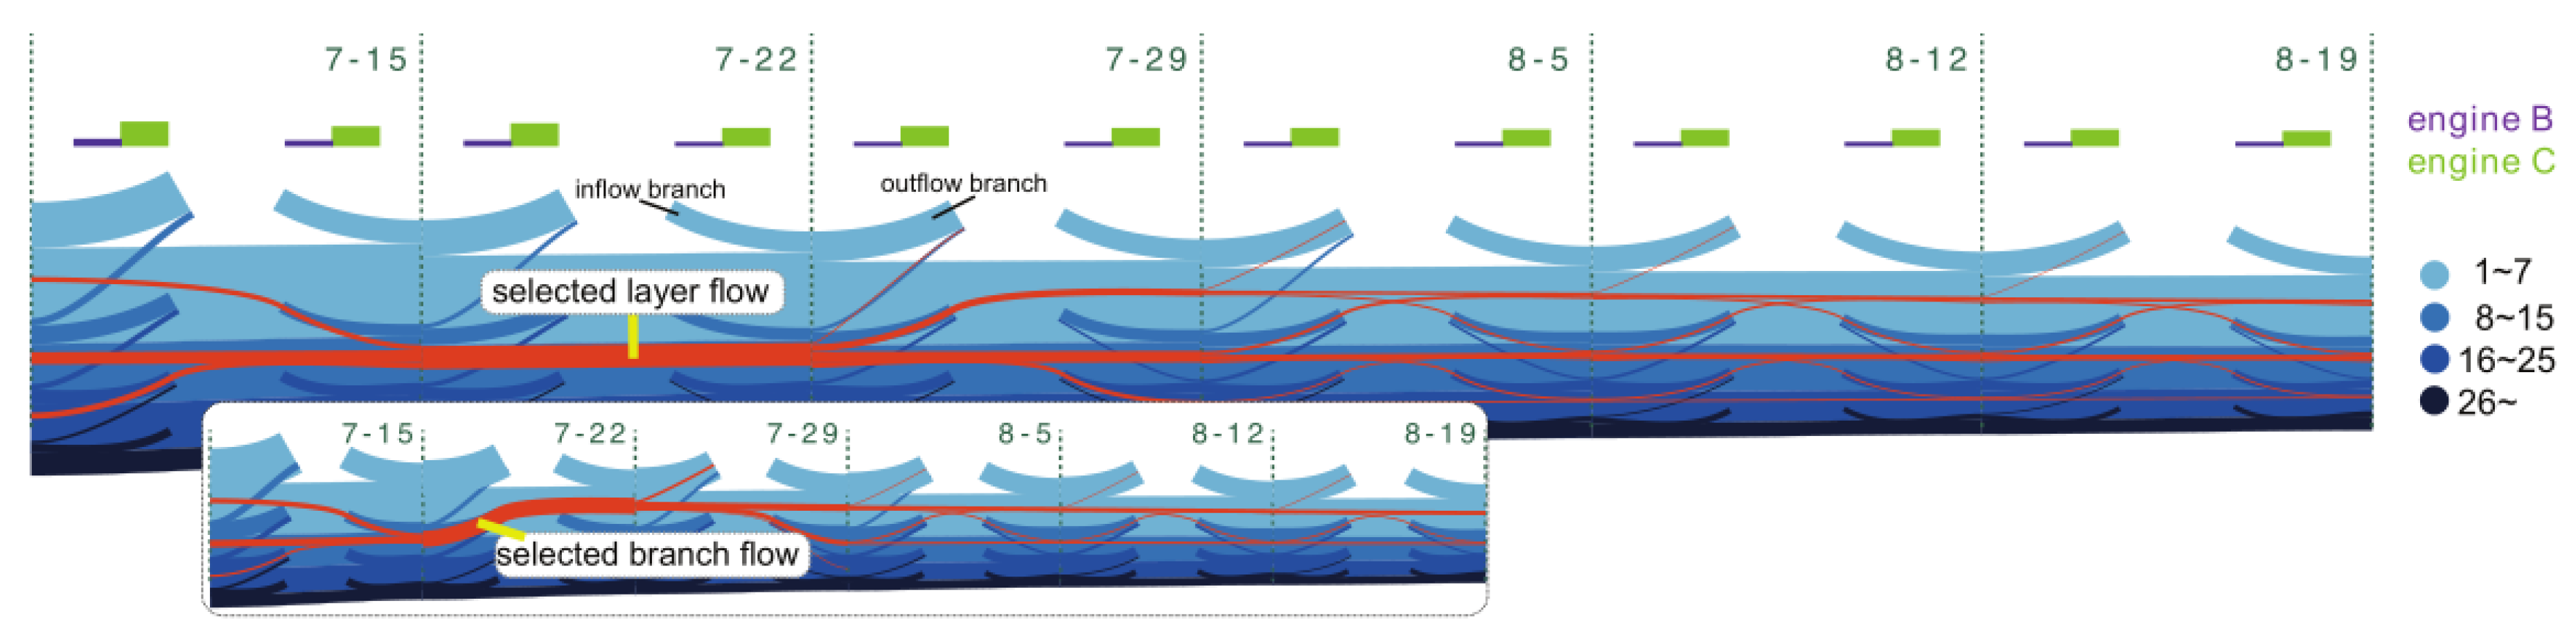
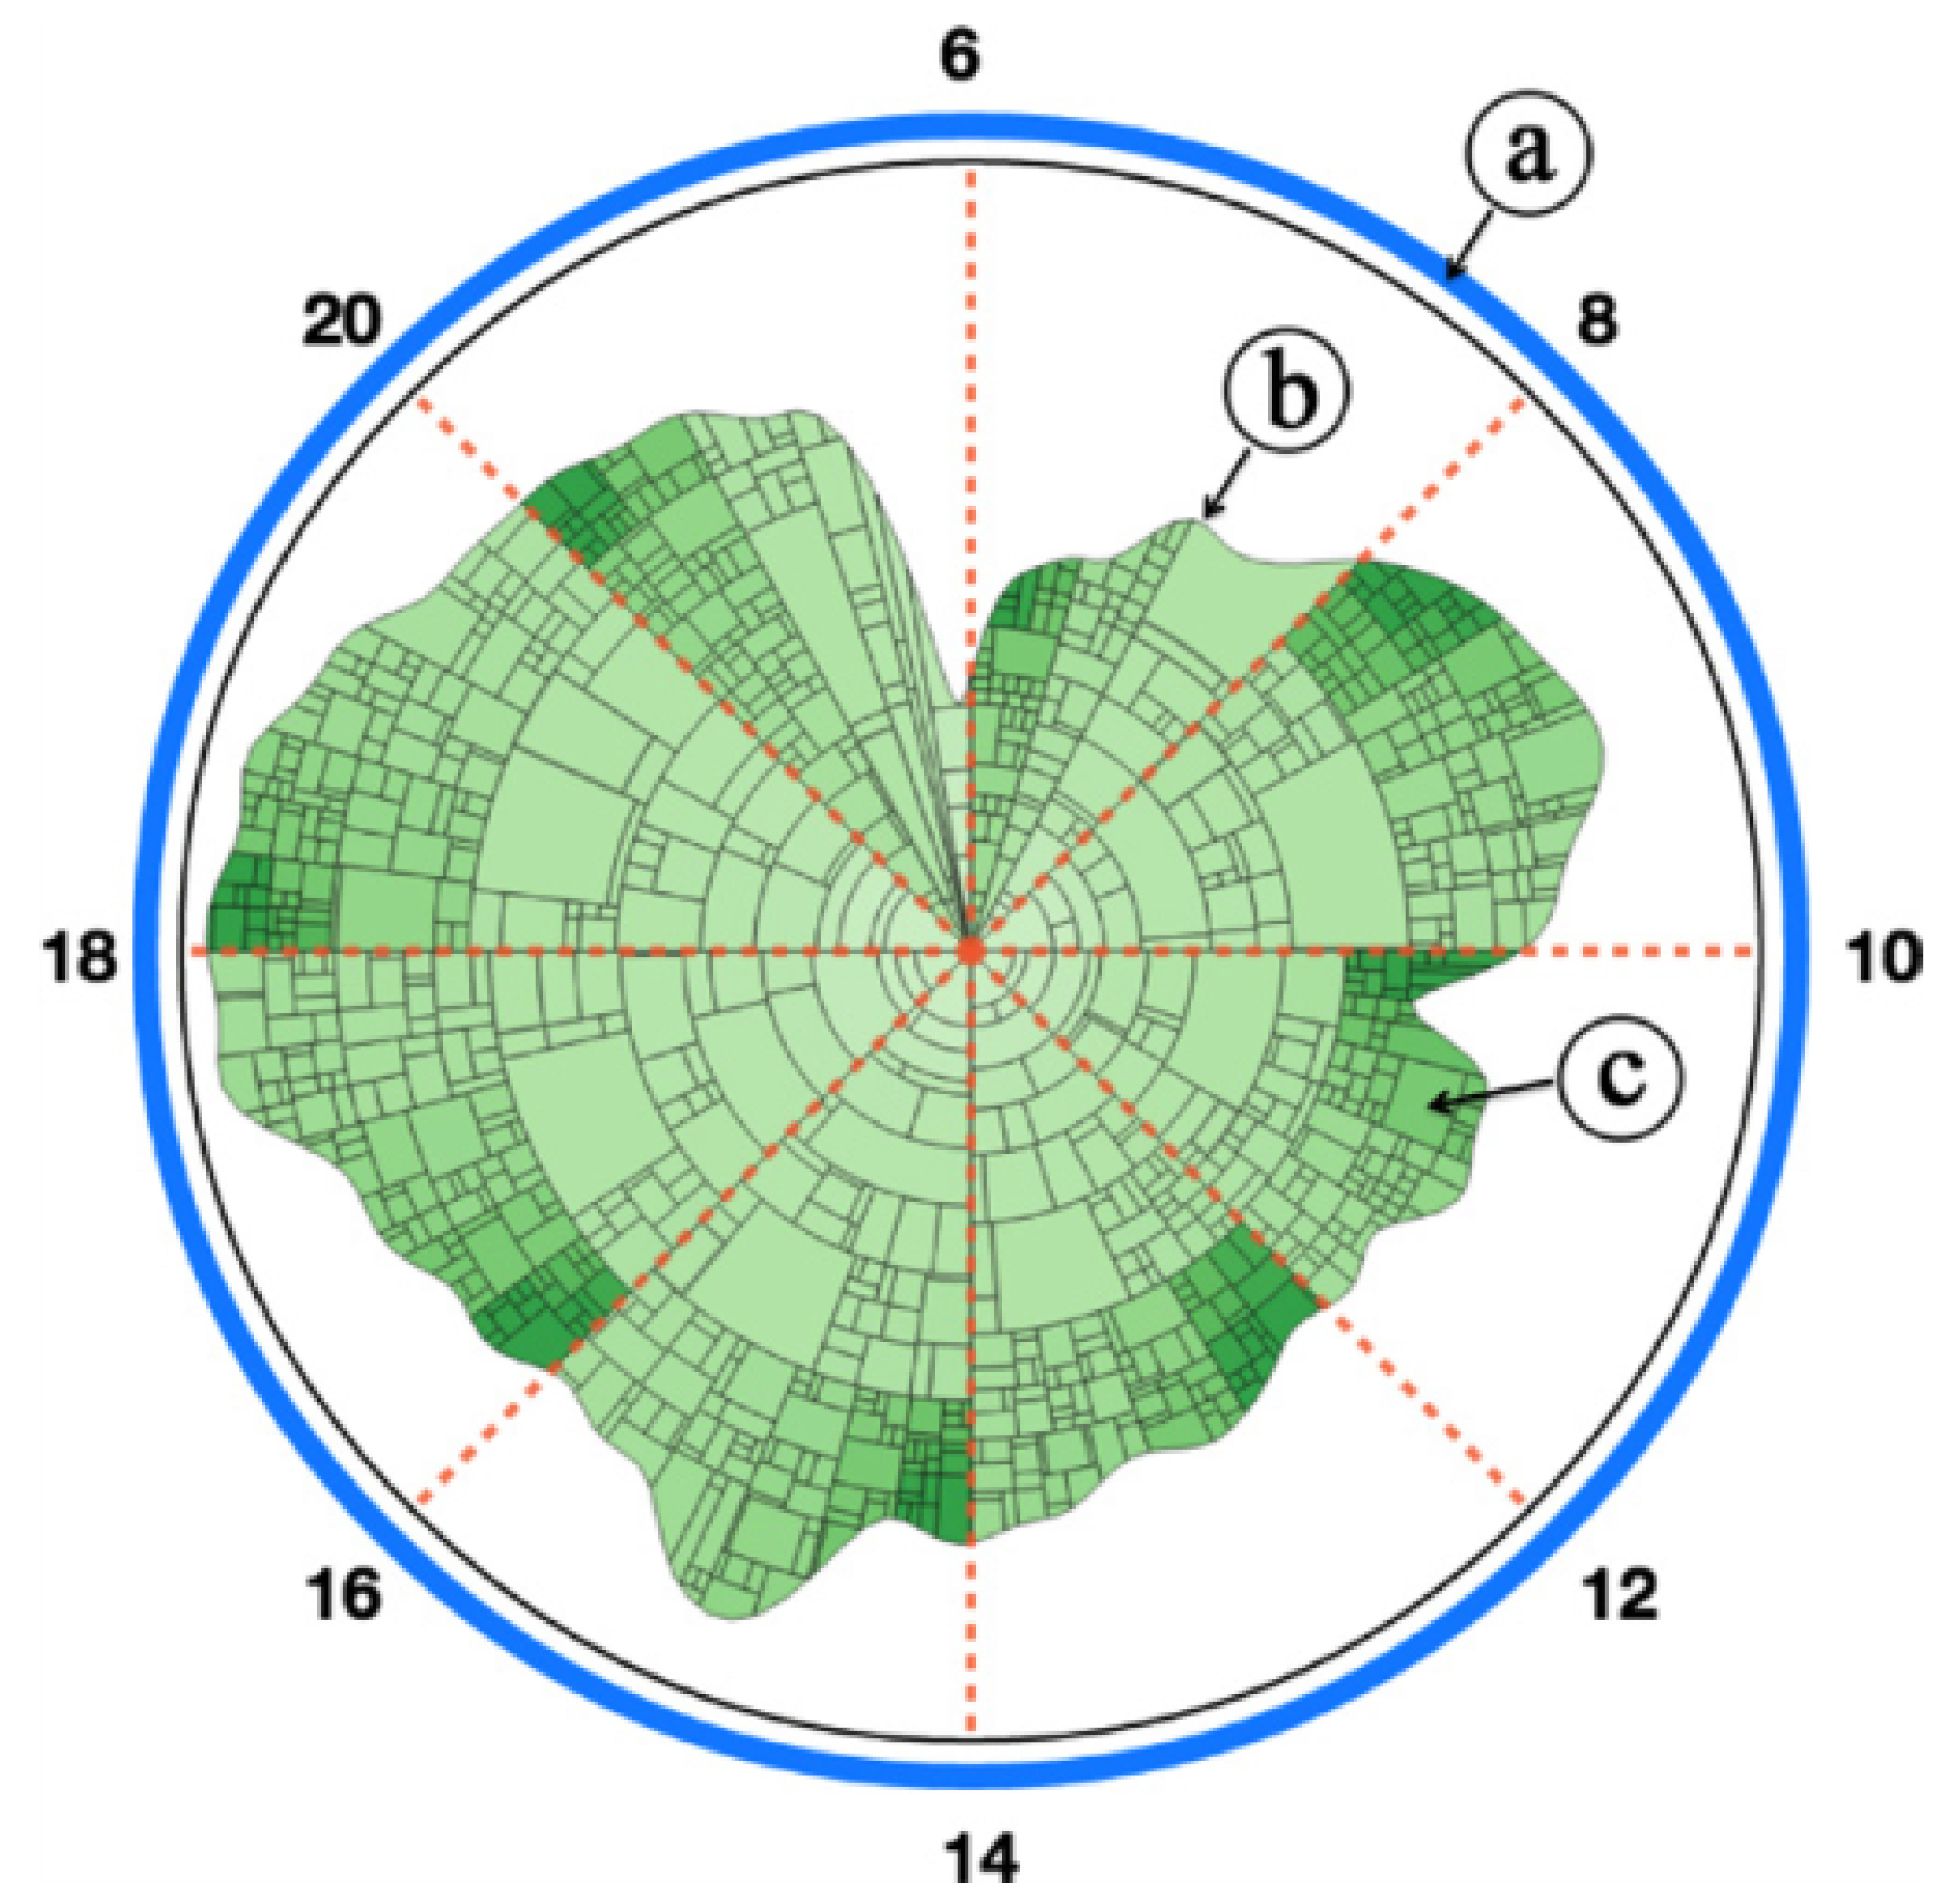
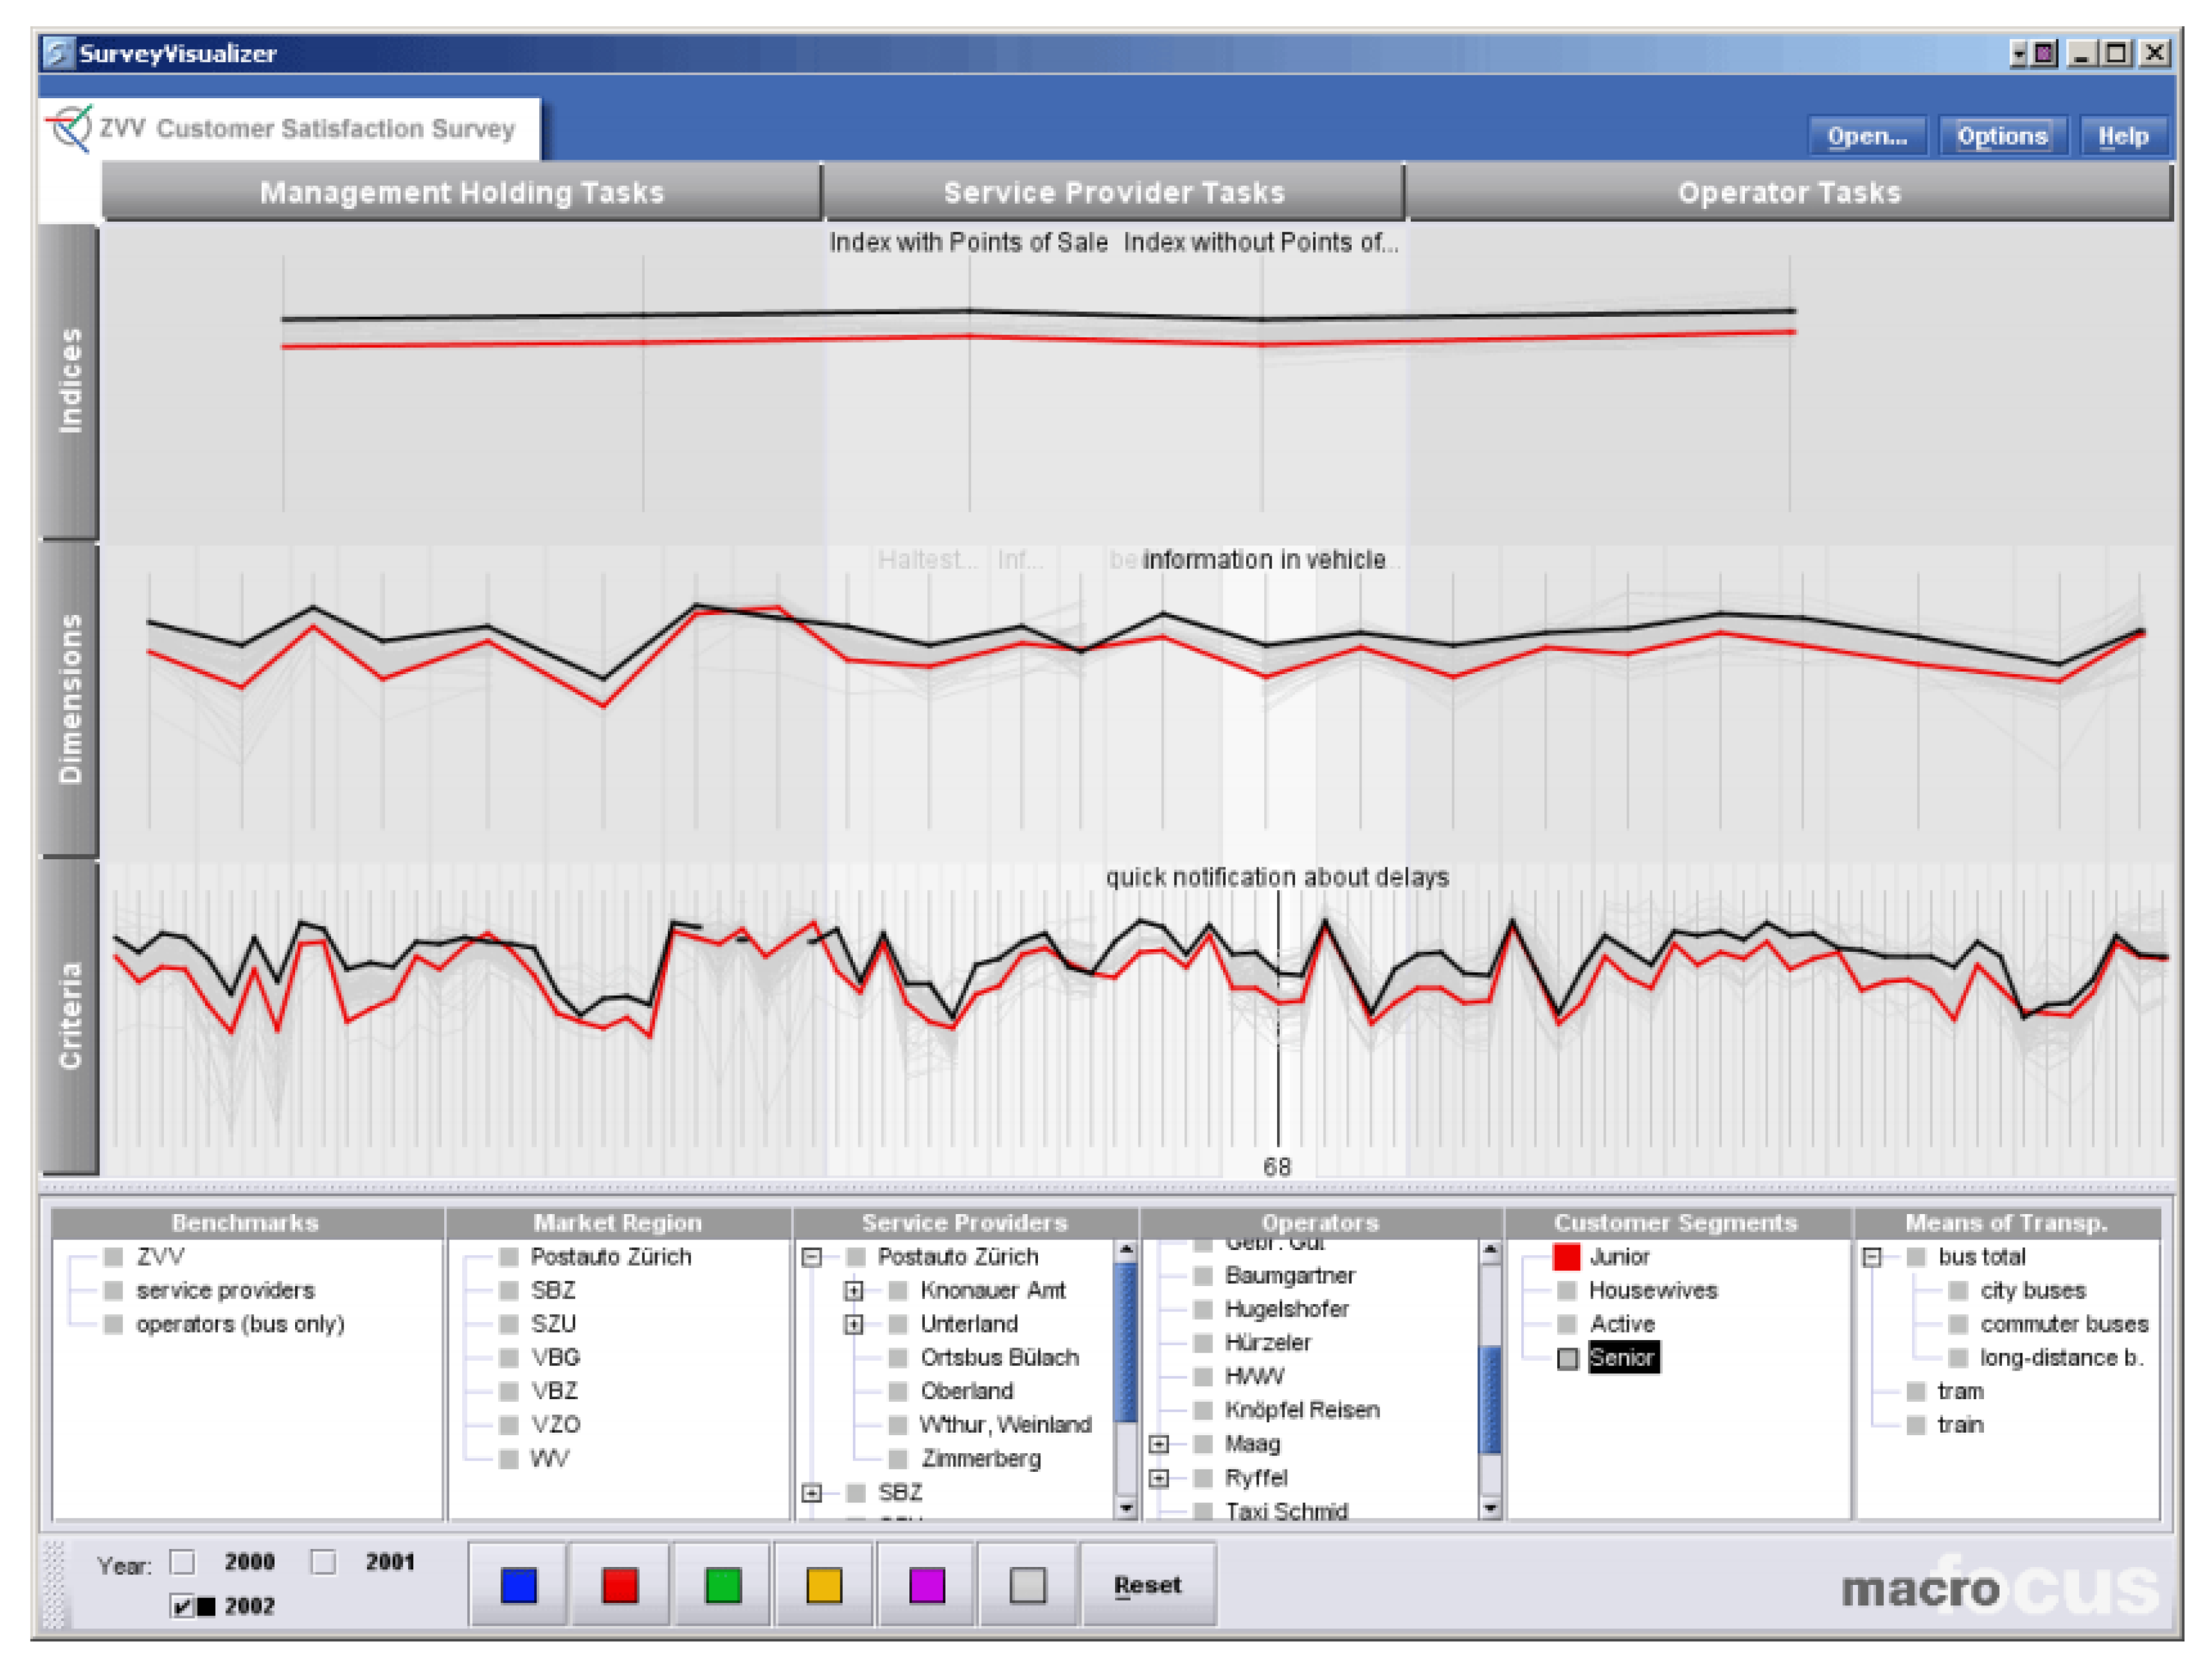
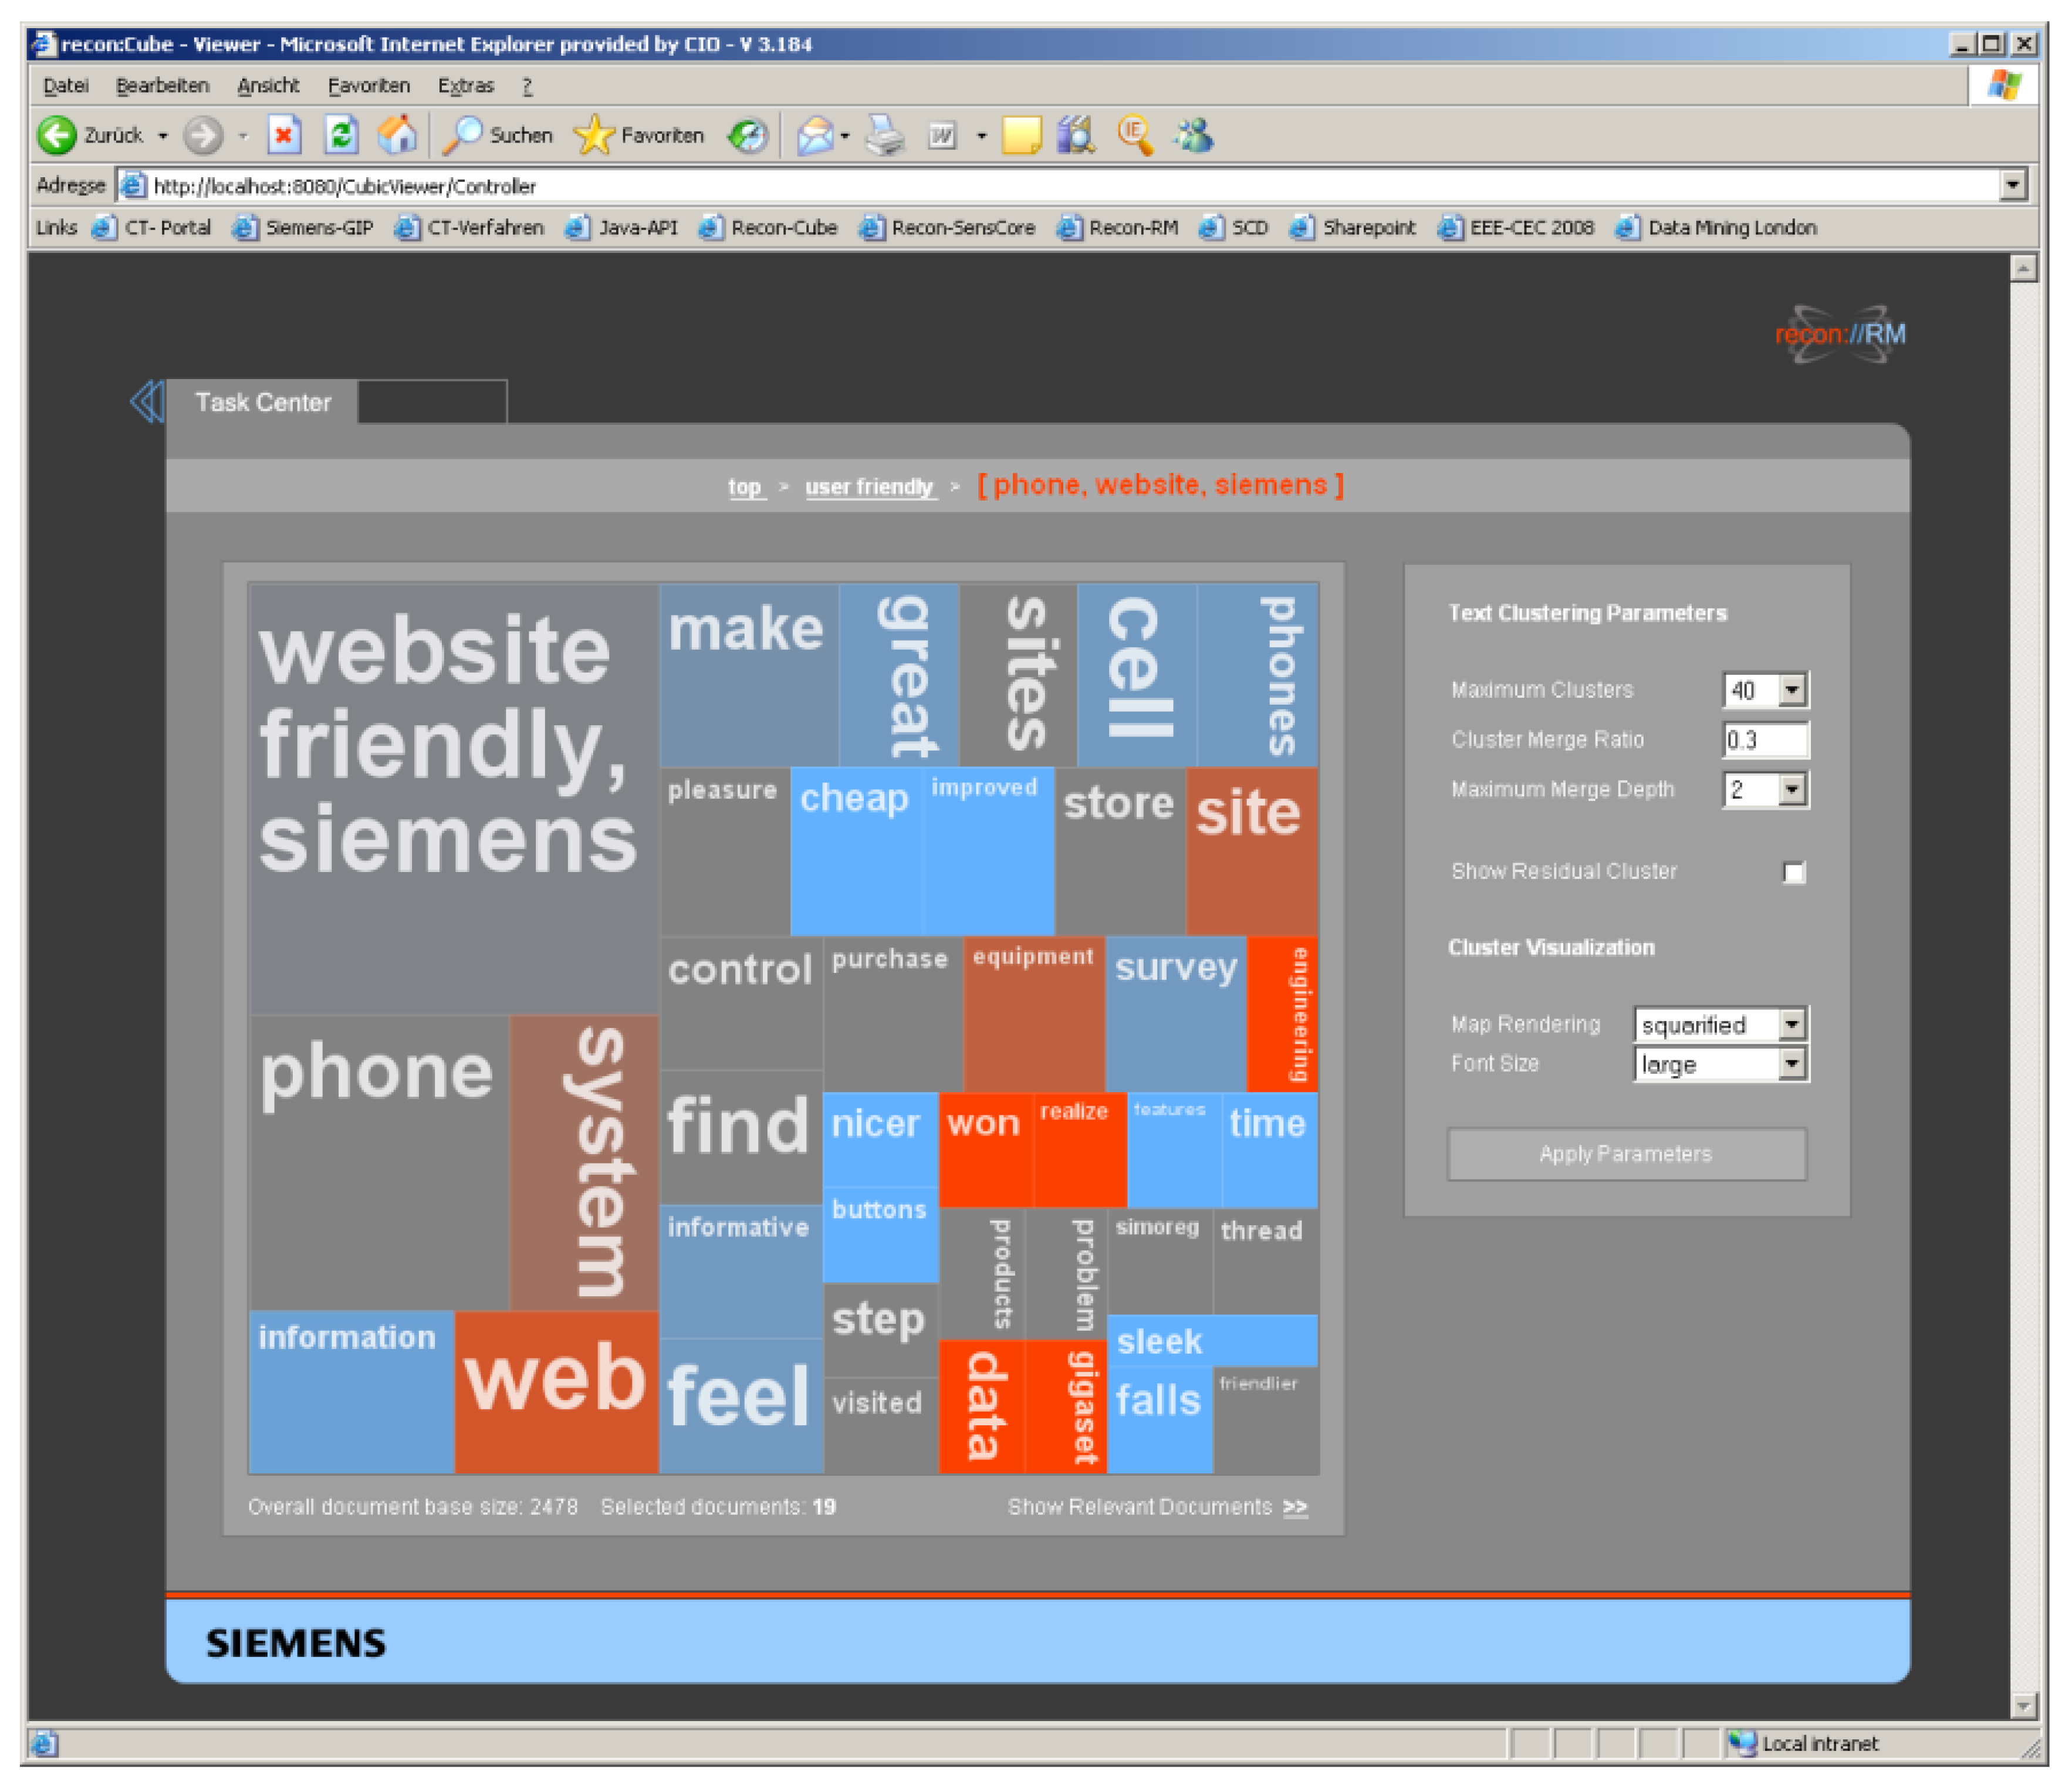
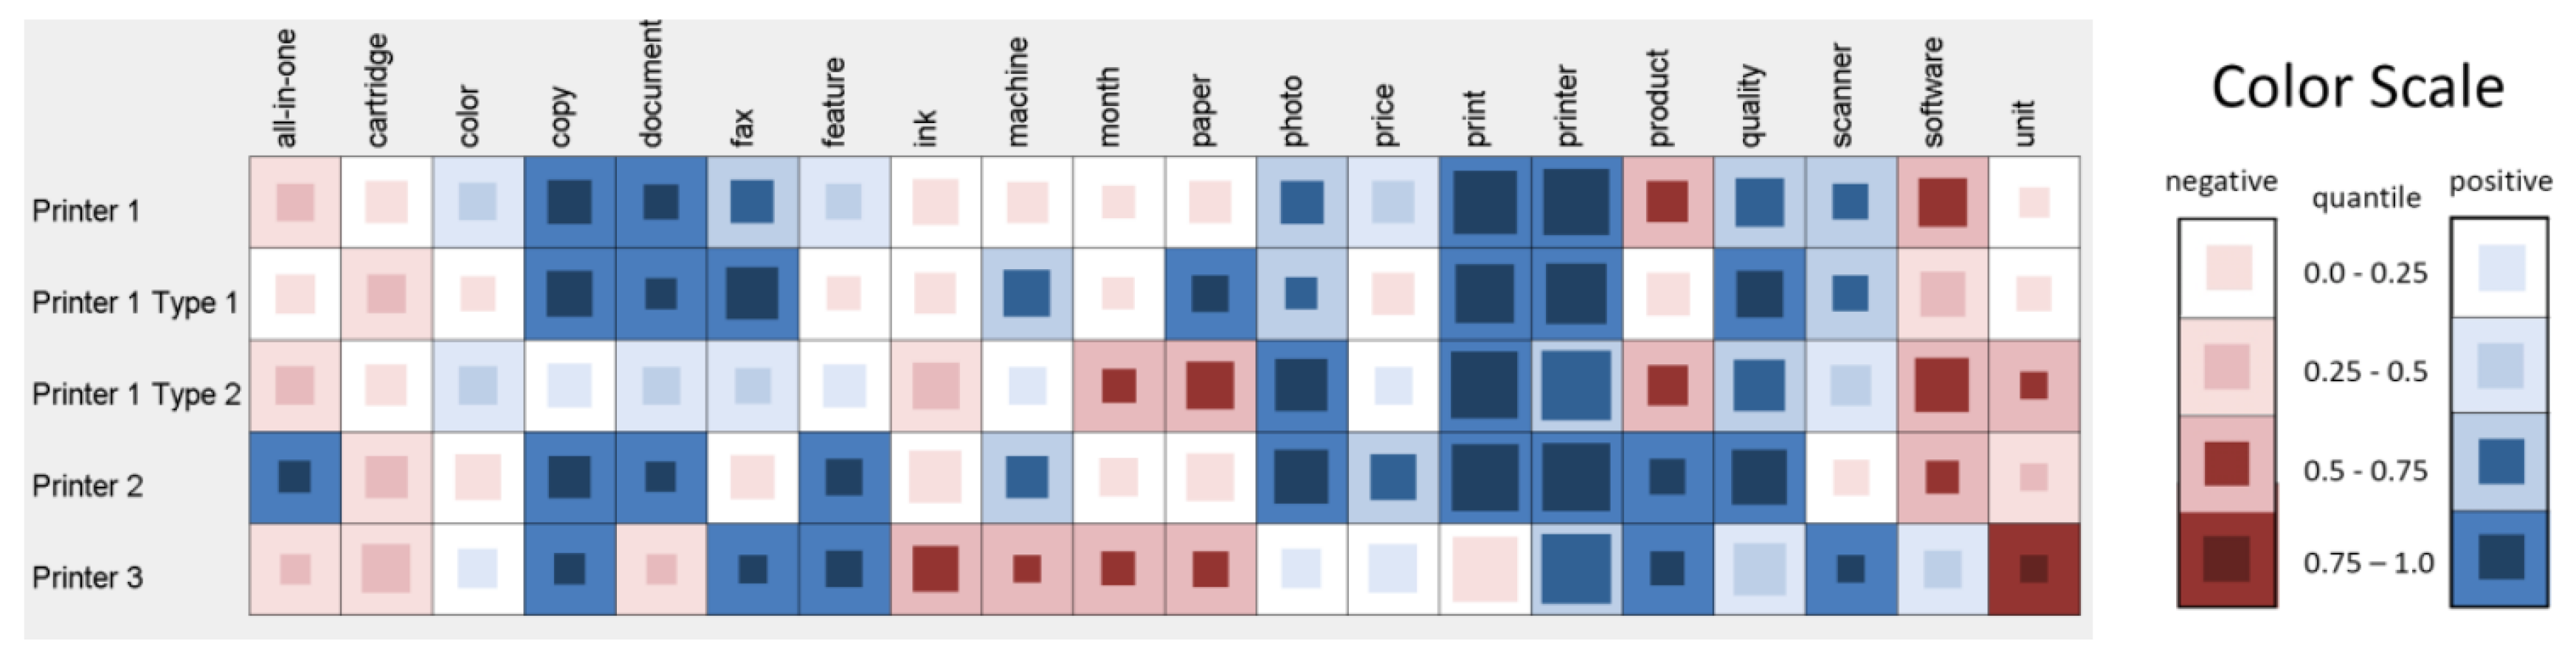
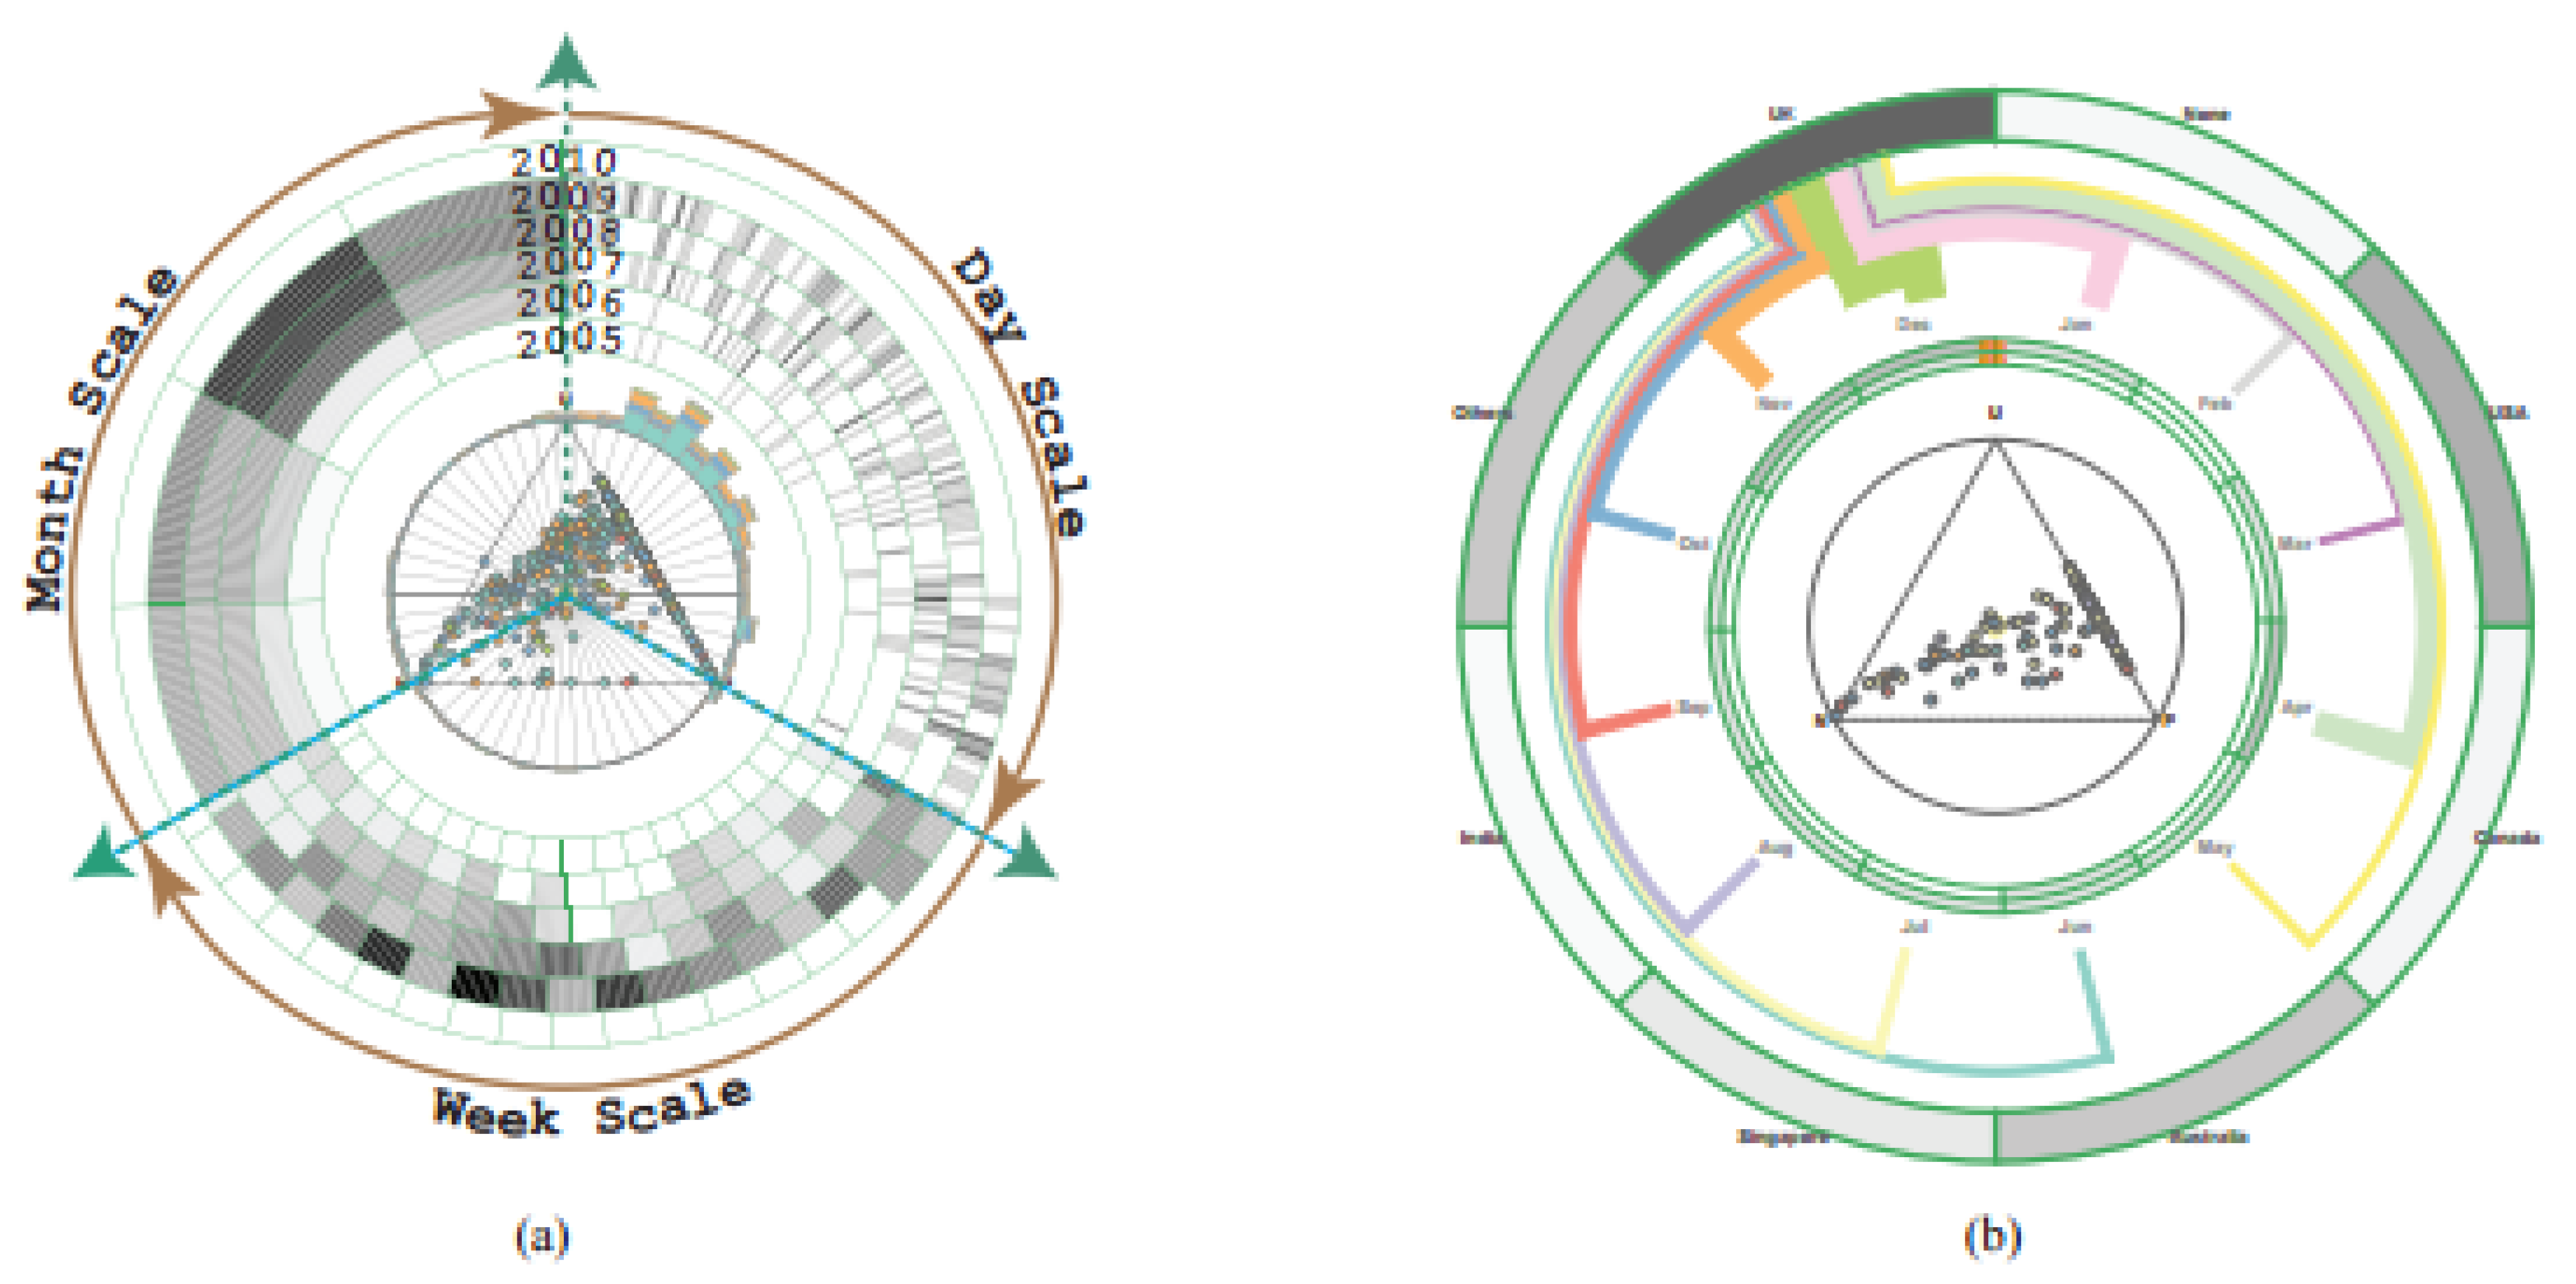
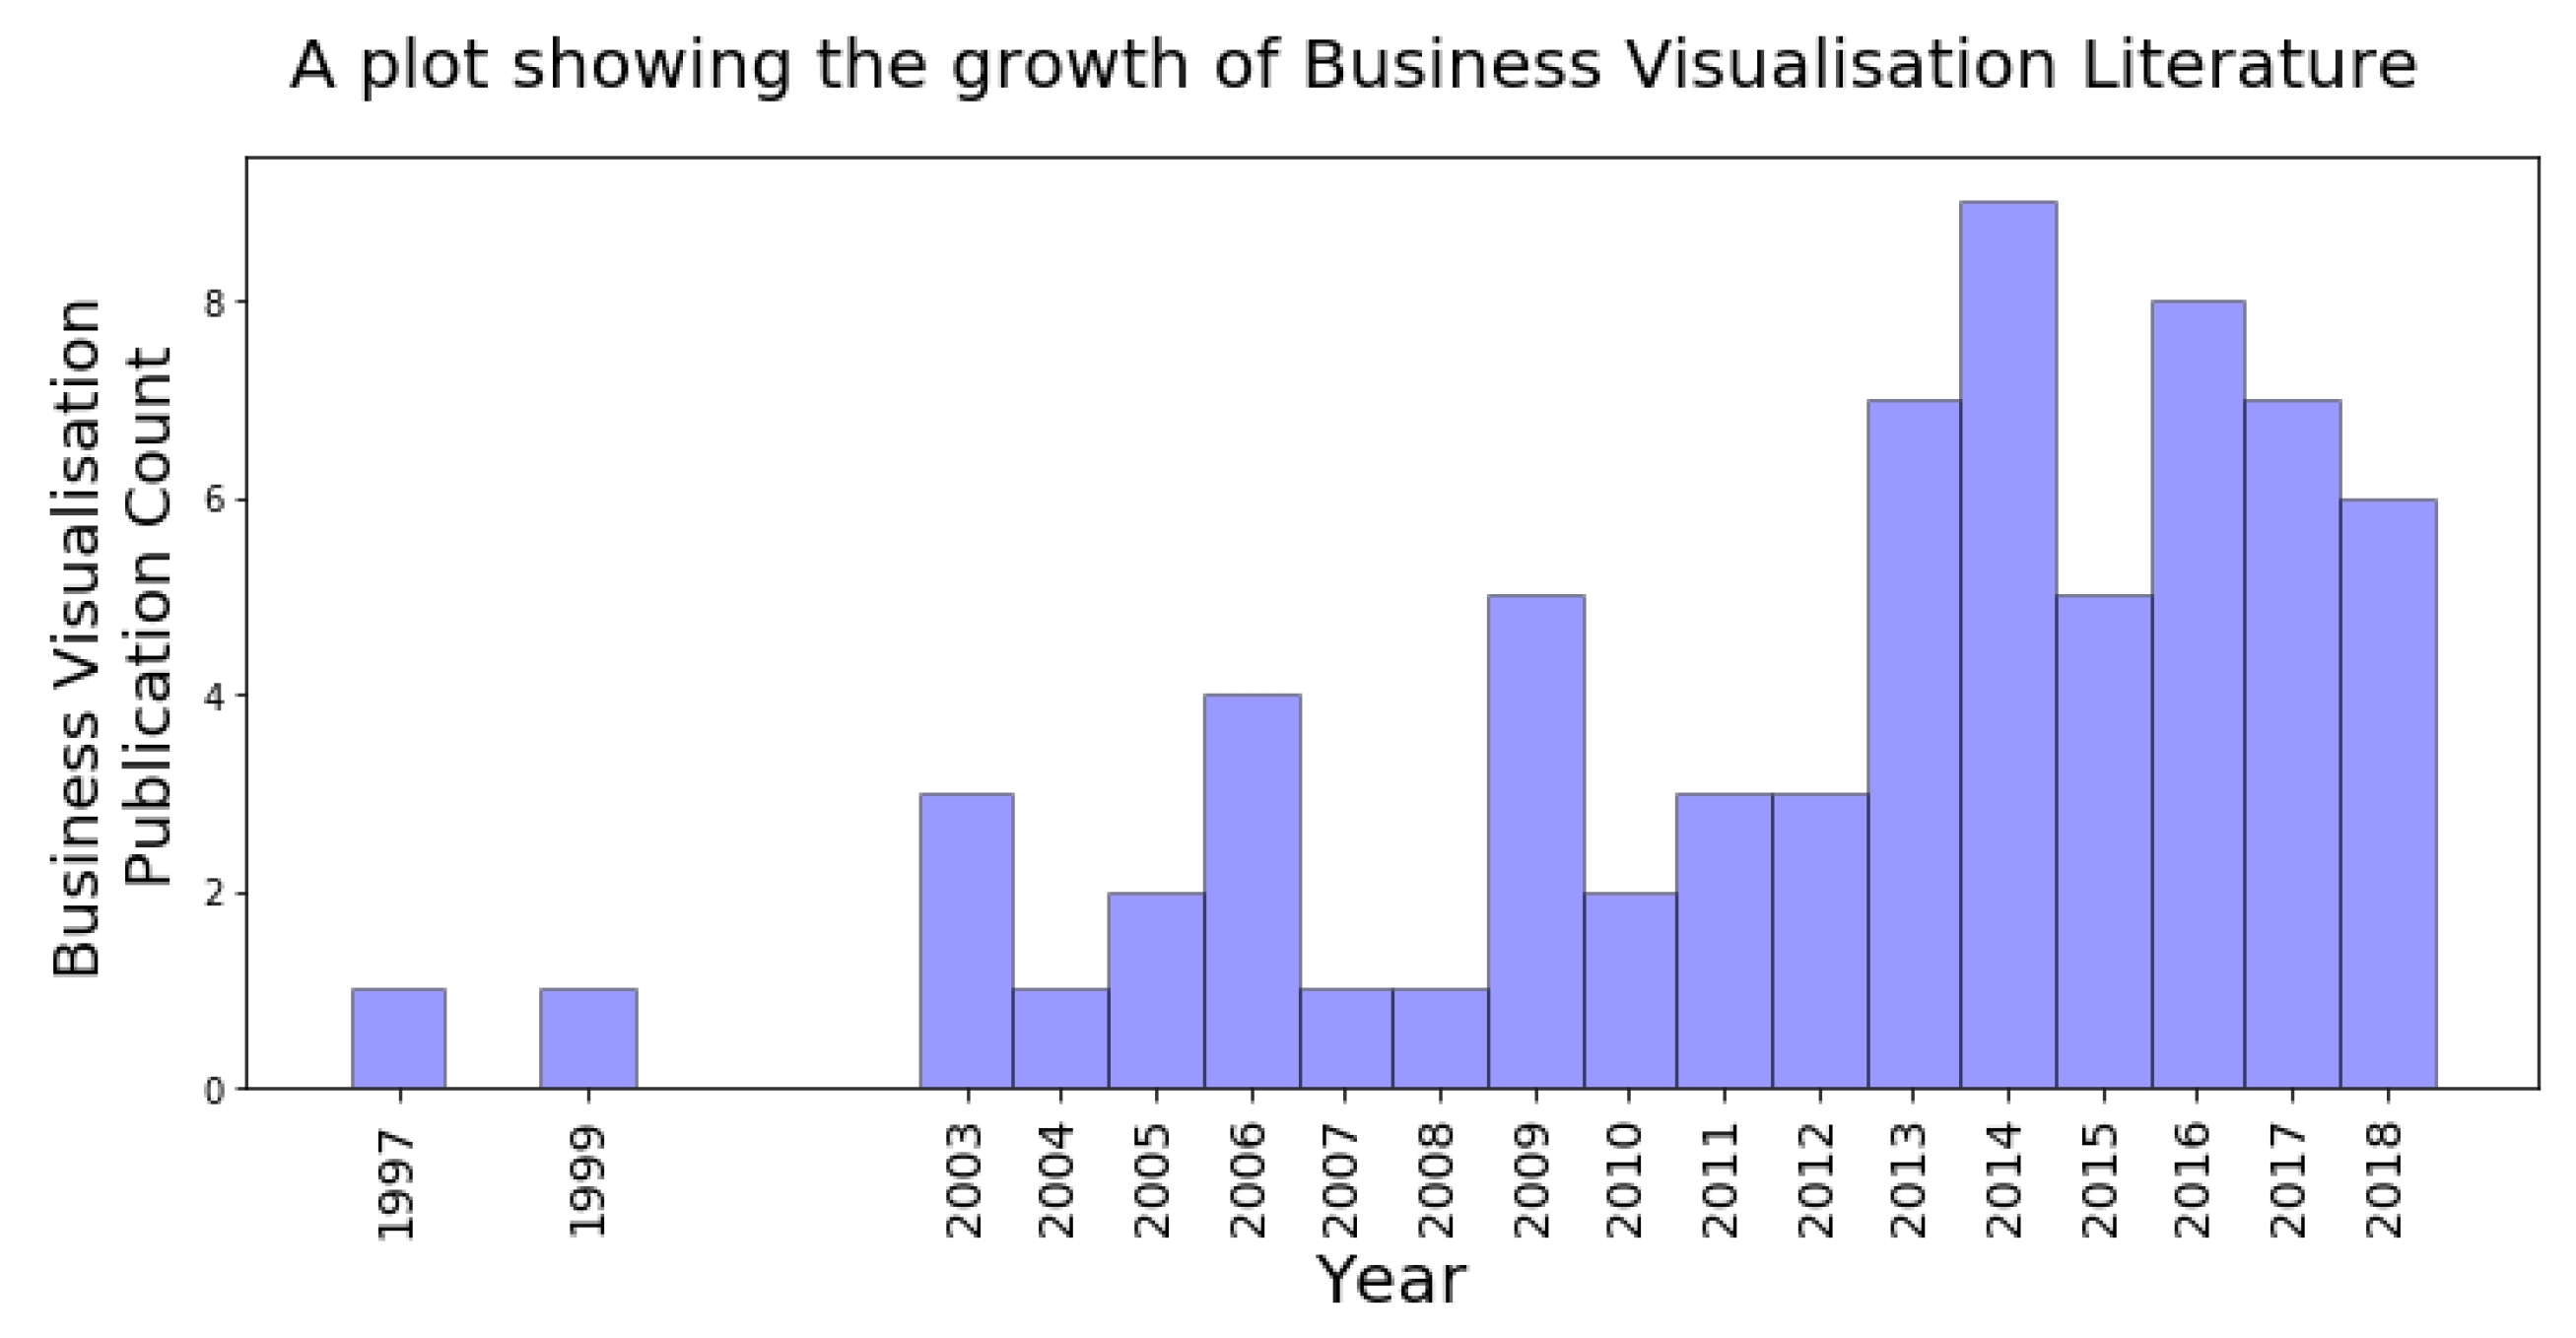
Table 1.
This table shows our sub-classification based on data source. Divided into primary, secondary, and hybrid, the source shows the origin of data behind the research. Papers labelled in yellow are not summarised in detail due to space limitations but are still cited to be comprehensive. Papers labelled in green are summarised in the survey.
| Type | Source | Business Intelligence | Business Ecosystem | Customer Centric | ||
|---|---|---|---|---|---|---|
| Internal Intelligence | External Intelligence | Business Ecosystem | Customer Behaviour | Customer Feedback | ||
| Primary Data | Intentional, Active, Digital Collection | Otsuka et al. [20] | Yaeli et al. [21] Nagaoka et al. [22] | |||
| Intentional, Active, Research Study Data | Burkhard [23] Sedlmair et al. [24] Kandel et al. [18] Aigner [25] Lafon et al. [26] | Bresciani and Eppler [27] Bertschi [28] Keahey [29] | Merino et al. [30] Basole et al. [31] | Dou et al. [32] | Brodbeck and Girardin [33] | |
| Hybrid Data | WebScrape | Ramesh et al. [34] | Lu et al. [35] | Shi et al. [36] Sijtsma et al. [37] | Chen et al. [38] Ziegler et al. [39] Oelke et al. [40] Wu et al. [41] Hao et al. [42] Saitoh [43] Fayoumi et al. [44] Haleem et al. [45] Saga and Yagi [46] | |
| Secondary Data | A Priori Database | Wright [47] Vliegen et al. [48] Bai et al. [49] Nicholas et al. [50] Roberts et al. [51] Kumar and Belwal [52] Roberts et al. [53] | Ferreira et al. [54] | Wattenberg [55] Wu and Phillips [56] Basole et al. [57] Basole et al. [58] Deligiannidis and Noyes [59] Basole et al. [60] Iyer and Basole [61] Schotter et al. [62] Basole et al. [63] | Woo et al. [64] Hanafizadeh and Mirzazadeh [65] Kameoka et al. [66] Wu et al. [67] Sathiyanarayanan et al. [68] | Kang et al. [69] |
| Business Process | Du et al. [70] Broeksema et al. [71] Ghooshchi et al. [72] Bachhofner et al. [73] Lea et al. [74] | Hao et al. [19] Hao et al. [75] | Basole [76] Basole and Bellamy [77] | |||
| Business By-product | Gresh and Kelton [78] Eick [79] Keim et al. [80] | Liu et al [81] | Otjacques et al. [82] Ko et al. [83] | Rodden [84] Nair et al. [85] | ||
Table 2.
Using the AND operator, we combined First and Second terms in the search process to produce the first list of relevant papers.
Table 2.
Using the AND operator, we combined First and Second terms in the search process to produce the first list of relevant papers.
| First Term | Second Term |
|---|---|
| Business | Visualisation |
| Customer | Visual Analytics |
| Market | Visual Analysis |
| Economic | Visual Intelligence |
| Finance | |
| Corporate | |
| Commercial |
Table 3.
This table describes the distribution of papers found in each of the major publication venues.
Table 3.
This table describes the distribution of papers found in each of the major publication venues.
| Conference/Journal | Count |
|---|---|
| IEEE Transactions on Visualization and Computer Graphics | 13 |
| The IEEE Information Visualisation Conference (IV) | 6 |
| IEEE Transactions on Visualization and Computer Graphics | 5 |
| IEEE Visual Analytics Science and Technology (VAST) | 3 |
| The Annual EuroVis Conference | 3 |
| Information Visualisation Journal (SAGE) | 3 |
| The Annual PacificVis Conference | 1 |
| VIS Business Visualisation Workshop | 1 |
| Other | 34 |
| total | 69 |
Table 4.
This table summarises the data sources in each research paper, identifying the accessibility of the data as well as a brief description.
Table 4.
This table summarises the data sources in each research paper, identifying the accessibility of the data as well as a brief description.
| Classification | Paper Ref | Access | Description | |
|---|---|---|---|---|
| Business Intelligence | Internal Intelligence | Wright [47] | Proprietary | Case Study from portfolio management, derivatives management, customer credit scores |
| Gresh and Kelton [78] | Proprietary | Private IBM business by-product data | ||
| Eick [79] | Proprietary | Log data from web servers used to analyse the efficiency of their website | ||
| Burkhard [23] | Proprietary | Case study from Swiss Federal Institute of Technology using business strategy data | ||
| Vliegen et al. [48] | Proprietary | Unspecified business data | ||
| Keim et al. [80] | Proprietary | Transaction datasets | ||
| Otsuka et al. [20] | Proprietary | Digital nametags collect employee interaction data | ||
| Sedlmair et al. [24] | Survey | Existing software evaluation | ||
| Kandel et al. [18] | Proprietary | Interview Study with industry experts | ||
| Du et al. [70] | Survey | A survey of business process visualisation literature | ||
| Aigner [25] | Proprietary | Text from interview study | ||
| Broeksema et al. [71] | Proprietary | Decision model data | ||
| Bai et al. [49] | Proprietary | Geospatial data for utility network coverage | ||
| Lafon et al. [26] | Proprietary | User Study of unspecified business data visualisation | ||
| Nicholas et al. [50] | Proprietary | Private customer survey database from automotive company | ||
| Roberts et al. [51] | Proprietary | Private call centre interaction database | ||
| Ghooshchi et al. [72] | Proprietary | Business Processes from undefined source | ||
| Kumar and Belwal [52] | Public | Multiple public data sources looking at different aspects of a business | ||
| Bachhofner et al. [73] | Proprietary | Business processes from industry contacts | ||
| Lea et al. [74] | Proprietary | Business process data was used alongside simulated data to test prototypes | ||
| Roberts et al. [53] | Proprietary | Call centre event data from industry partner | ||
| External Intelligence | Hao et al. [19] | Proprietary | Case study data from financial transactions, service contracts data | |
| Hao et al. [75] | Proprietary | Case Study Data: Financial transactions, service contracts data | ||
| Bresciani and Eppler [27] | Public/Proprietary | Case study from Gartner, Argument Map, Five Forces Process | ||
| Bertschi [28] | N/a | Critical Discussion of knowledge visualisation in business. No data used | ||
| Ferreira et al. [54] | Proprietary | Data provided by Taxi and Limousine Commission of New York City | ||
| Keahey [29] | Proprietary | Expert opinion data | ||
| Liu et al [81] | Proprietary | GPS trajectory data | ||
| Ramesh et al. [34] | Public | Data mined from “various sources”. Presented for insight into the external operations of a business | ||
| Business Intelligence | Business Ecosystem | Wattenberg [55] | Public | Public stock market data |
| Merino et al. [30] | Public | Stock market data | ||
| Otjacques et al. [82] | Proprietary | Human resources data | ||
| Wu and Phillips [56] | Public | Public Dow Jones 30 data | ||
| Basole et al. [57] | Proprietary | Business ecosystem data | ||
| Ko et al. [83] | Proprietary | Generic Point of Sale data | ||
| Basole et al. [58] | Commercially and Publicly Available | The Thomson Reuters SDC Platinum database and Capital IQ Compustat database | ||
| Basole [76] | Proprietary | Case study: global supply chain data, competitive dynamics data, venture capital network data | ||
| Deligiannidis and Noyes [59] | Proprietary | Data obtained from US Department of Commerce Census Bureau | ||
| Basole and Bellamy [77] | Proprietary | Supply network Structure data | ||
| Lu et al. [35] | Public | Twitter data + IMDb | ||
| Basole et al. [60] | Proprietary | Three commercial datasets are used that cover finance, relationships, and public opinion | ||
| Iyer and Basole [61] | Proprietary | The visualisations use IoT data to show the “big players” in the technology industry | ||
| Basole et al. [31] | Proprietary | User study generated data looking at the effectiveness of different visual designs for decision support | ||
| Schotter et al. [62] | Proprietary | Investment data is used alongside geospatial data | ||
| Basole et al. [63] | Proprietary | Combination of multiple proprietary datasets including geospatial and commercial data | ||
| Customer Centric | Customer Behaviour | Woo et al. [64] | Proprietary | Audio data from customers in call centre |
| Hanafizadeh and Mirzazadeh [65] | Proprietary | Six-dimensional vector customer dataset | ||
| Shi et al. [36] | Proprietary | Generic search engine data | ||
| Rodden [84] | Proprietary | Private Youtube site navigation data | ||
| Yaeli et al. [21] | Proprietary | Digitally collected customer path tracking data | ||
| Dou et al. [32] | Proprietary | Survey conducted on Reddit.com | ||
| Kameoka et al. [66] | Proprietary | Dataset provided by industry parnter—supermarket PoS data | ||
| Nair et al. [85] | Proprietary | Large customer behaviour dataset—unspecified origin | ||
| Wu et al. [67] | Proprietary | Telco data obtained from China’s largest telecommunications operator | ||
| Nagaoka et al. [22] | Proprietary | Customer behaviour collected from digital devices | ||
| Sijtsma et al. [37] | Public | Twitter data mined to collect the customer experience and expectation of various retail stores | ||
| Sathiyanarayanan et al. [68] | Public | Email exchange at company level | ||
| Customer Centric | Customer Feedback | Brodbeck and Girardin [33] | Proprietary | Questionnaires distributed to customer of the public transport network |
| Chen et al. [38] | Public | Amazon.com reviews | ||
| Ziegler et al. [39] | Proprietary | Unspecified textual customer feedback data | ||
| Oelke et al. [40] | Public | Amazon.com reviews | ||
| Wu et al. [41] | Public | TripAdvisor data used | ||
| Hao et al. [42] | Public | Twitter data | ||
| Saitoh [43] | Proprietary | Web scraped customer review data | ||
| Kang et al. [69] | Proprietary | Combination of production and customer service data direct from manufacturer | ||
| Fayoumi et al. [44] | Proprietary | Web scraped social media data from Twitter | ||
| Haleem et al. [45] | Proprietary | Web scraped customer reviews | ||
| Saga and Yagi [46] | Public | Customer feedback collected from web crawler using specified keywords about the examined product | ||
Table 5.
This table shows a temporal classification of the papers included in the survey by year. Primary papers included in the survey are labelled in green and secondary papers are labelled in yellow. See Section 1.5 for a description of our primary and secondary papers. The secondary classification used in the survey is shown in Table 1.
| Business Intelligence | Business Ecosystem | Customer Centric | |||
|---|---|---|---|---|---|
| Internal Intelligence | External Intelligence | Business Ecosystem | Customer Behaviour | Customer Feedback | |
| 1997 | Wright [47] | ||||
| 1999 | Wattenberg [55] | ||||
| 2003 | Gresh and Kelton [78] Eick [79] | Brodbeck and Girardin [33] | |||
| 2004 | Hao et al. [19] | ||||
| 2005 | Burkhard [23] | Woo et al. [64] | |||
| 2006 | Vliegen et al. [48] | Hao et al. [75] | Merino et al. [30] | Chen et al. [38] | |
| 2007 | Keim et al. [80] | ||||
| 2008 | Ziegler et al. [39] | ||||
| 2009 | Otsuka et al. [20] | Bresciani and Eppler [27] Bertschi [28] | Otjacques et al. [82] | Oelke et al. [40] | |
| 2010 | Wu and Phillips [56] | Wu et al. [41] | |||
| 2011 | Sedlmair et al. [24] | Basole et al. [57] | Hanafizadeh and Mirzazadeh [65] | ||
| 2012 | Kandel et al. [18] Du et al. [70] | Ko et al. [83] | |||
| 2013 | Aigner [25] Broeksema et al. [71] Bai et al. [49] Lafon et al. [26] | Ferreira et al. [54] | Basole et al. [58] | Hao et al. [42] | |
| 2014 | Nicholas et al. [50] | Basole [76] Deligiannidis and Noyes [59] Basole and Bellamy [77] Lu et al. [35] | Shi et al. [36] Rodden [84] Yaeli et al. [21] | Saitoh [43] | |
| 2015 | Keahey [29] | Basole et al. [60] | Dou et al. [32] Kameoka et al. [66] Nair et al. [85] | ||
| 2016 | Roberts et al. [51] | Liu et al [81] | Iyer and Basole [61] Basole et al. [31] | Wu et al. [67] Nagaoka et al. [22] Sijtsma et al. [37] | |
| 2017 | Ghooshchi et al. [72] Kumar and Belwal [52] Bachhofner et al. [73] | Ramesh et al. [34] | Schotter et al. [62] | Kang et al. [69] Fayoumi et al. [44] | |
| 2018 | Lea et al. [74] Roberts et al. [53] | Basole et al. [63] | Sathiyanarayanan et al. [68] | Haleem et al. [45] Saga and Yagi [46] | |
© 2018 by the authors. Licensee MDPI, Basel, Switzerland. This article is an open access article distributed under the terms and conditions of the Creative Commons Attribution (CC BY) license (http://creativecommons.org/licenses/by/4.0/).
Share and Cite
MDPI and ACS Style
Roberts, R.C.; Laramee, R.S. Visualising Business Data: A Survey. Information 2018, 9, 285. https://doi.org/10.3390/info9110285
AMA Style
Roberts RC, Laramee RS. Visualising Business Data: A Survey. Information. 2018; 9(11):285. https://doi.org/10.3390/info9110285
Chicago/Turabian StyleRoberts, Richard C., and Robert S. Laramee. 2018. "Visualising Business Data: A Survey" Information 9, no. 11: 285. https://doi.org/10.3390/info9110285
Note that from the first issue of 2016, this journal uses article numbers instead of page numbers. See further details here.