Article

Valorising Nutrient-Rich Digestate as a Waste-Based Media for Microalgal Cultivation: Bench-Scale Filtration Characterisation and Scale-Up for a Commercial Recovery Process

by
Yilu Xu
1,
James Russell
2,
Gahtan S. M. Algahtani
1 and
Darren L. Oatley-Radcliffe
1,*
1
Energy Safety Research Institute (ESRI), Faculty of Science and Engineering, Swansea University, Fabian Way, Swansea SA1 8EN, UK
2
Advanced Imaging of Materials (AIM) Facility, Faculty of Science and Engineering, Swansea University, Fabian Way, Swansea SA1 8EN, UK
*
Author to whom correspondence should be addressed.
Energies 2022, 15(16), 5976; https://doi.org/10.3390/en15165976
Submission received: 5 July 2022 / Revised: 2 August 2022 / Accepted: 15 August 2022 / Published: 18 August 2022

Abstract

:
Cultivating microalgae requires a nitrogen and phosphorous feed source. Anaerobic digestion waste (digestate) provides a cheap sustainable feedstock for these materials. Previous studies have successfully demonstrated the feasibility of nutrient recovery and subsequent algae growth. There is now a need to fully characterise digestate filtration to improve our understanding of this process prior to its commercialisation. In this work, digestate filtration is characterised at bench scale using frontal (dead-end) filtration and a 100 kDa MWCO ultrafiltration membrane. Our experiments demonstrated rapid cake formation causing significant flux decline. The steady-state permeate flux for digestate was 2.4 to 4.8 L m−2 h−1, a reduction of ~90% compared to clean water flux. The specific cake resistance was ~1015 m kg−1 and the compressibility index 1.07. A series of four filtration and cleaning cycles showed 90% flux recovery following a clean water wash. Digestate filtration was then evaluated at a commercial scale using crossflow and the KOCH ABCOR® tubular membrane (100 kDa MWCO). The results were similar to those at the bench scale, i.e., rapid initial fouling leading to a period of steady-state flux (approximately 7 L m−2 h−1). The commercial membrane was flushed with water and diluted bleach after each use, and a digestate permeate flux decline of only 4.8% over a 12-month active use period was observed. The present research provides bench scale characterisation and demonstrates the commercial scale operation of anaerobic digestate filtration using ultrafiltration. The overall filtration performance was excellent, and the process can now be scaled to any operational capacity.

1. Introduction

Membrane separation processes have been successfully applied to various industry sectors with focus on energy reduction, environmental benefit, and process intensification [1]. Membrane processes are easy to scale up and are chemical free; additionally, they have a small footprint, require relatively little energy, and have low operational costs. These merits have given rise to the expansion of membrane technology and novel process generation over the past five decades [2,3]. Recently, interest in the production of microalgae has grown dramatically. Microalgae are photosynthetic organisms which fix atmospheric carbon dioxide and, with the addition of a nitrogen and phosphorous source, produce new materials such as lipids, carbohydrates, proteins, and a range of minor content materials that are useful in the fine chemicals, nutraceutical, and cosmetic markets [4,5]. Anaerobic digestate contains high levels of nitrogenous compounds (i.e., ammonia and nitrates) and phosphates, making digestate waste an excellent soil conditioner or nutrient source for microalgae production [6,7]. Both membrane microfiltration ((MF), pore size from 0.05 to 10 μm) and ultrafiltration ((UF), pore size from 5 to 20 nm and a molecular weight cut-off ranging from 5 to 500,000 kDa) have demonstrated huge potential for digestate filtration and nutrient recovery [8,9]. Membranes have the ability to separate digestate waste into a solid rich fraction and a liquid-only nutrient rich solution [7,10]. The latter can then serve as a nutrient source for microalgae production [9,11].
Despite several advantages and significant potential for the incorporation of membrane technology to further bio-industry processes, membrane fouling is an undesirable drawback [12,13]. Membrane fouling leads to permeate flux decline or transmembrane pressure (TMP) increase, which increases maintenance and operating costs. In reality, fouling is unavoidable, and the poor economic performance that can occur as a direct consequence has prevented further widespread application of the technology. Membrane fouling is the result of the micro-hydrodynamic and bio-chemical interaction of the feed solution and the membrane [14,15]. The classic fouling mechanisms caused by colloidal particles were first discussed by Hermia, i.e., complete blocking, standard blocking, intermediate blocking, and cake filtration [16]. Complete blocking is when an open pore is sealed by each particle, as the membrane pore size is smaller than the particle size. Standard blocking, also known as pore constriction, results from the deposition and accumulation of smaller particles inside membrane pores. If particle attachments occur simultaneously on the membrane surface and in the membrane pores, this is known as intermediate blocking. Cake filtration occurs when the pores are partially blocked by large particles and more foulant deposits on top of the initial fouling layer, leading to the development of a cake on the membrane surface. Research to understand the mechanisms of fouling has identified standard and complete blocking as “irreversible”, while intermediate blocking and cake filtration are considered “reversible” [17,18]. The major difference is that reversable fouling can be controlled via operational parameters and effective cleaning. Le-Clech et al. [14] noted that most of the models currently being used to characterise fouling are insufficient for predictions involving very complex fluids, due to variations in the resistance and reversibility of the foulant layer.
Typical polymeric membrane materials include polysulfone, polyethersulfone, cellulose acetate, and cellulose [19,20,21,22]. Polyvinylidene fluoride (PVDF) composite membranes are commercially available for digestion filtration in the United States, Europe, and Japan. Most polymer membranes have been shown to be relatively resistant to the adsorption of proteins, cells, and bacteria, which leads to potential biofouling. Kanani et al. [23] suggested there were three phases in the fouling process. Fouling occurs due to sequestered accumulation of foulant cake, which starts to build up following the initial standard and complete blocking. Horng et al. [24] found that cake formation has more influence on the filtration rate than pore blocking. Other research has demonstrated that cake depositions are probably reversible [25]. Therefore, an investigation of the “reversibility” of cake fouling could provide useful information for analyses of membrane fouling and recovery [26,27,28]. Our previous studies on the membrane filtration of anaerobic digestate have predominantly focused on filtration performance and the feasibility of the recovery process at the bench scale [9,11,15,29]. Membrane fouling mechanisms and recovery performance still require further research; knowledge of these phenomena will be critical for scale-up and long-term performance estimations.
In view of the current state of knowledge and practices regarding digestate filtration, the aim of this research is to characterise the cake filtration process at a bench scale, to evaluate the optimal performance and scale-up potential of the nutrient recovery process, and to test the performance of the process using membranes at a commercial scale.

2. Materials and Methods

2.1. Physicochemical Characterisation of Anaerobic Digestate

Sterilised raw anaerobic digestate was obtained from Langage AD (Smithaleigh, UK), which has three digesters of 1000 m3 capacity, plus one digestate storage tank. The reactor is fed with approximately 27 tonnes of kitchen waste each day, which is collected, pasteurised, and then fermented at an operating temperature of 38 °C. The average overall retention time in the fermenters is 60–65 days, depending on the feed stock quality. The biogas generated is burned in an engine rated for 500 kW, and the engine output power is typically 4380 MWh yr−1. The total digestate output of the plant is approximately 8000 tonnes yr−1, which is spread to land as fertiliser. Upon obtaining a sample of the output digestate, the initial treatment comprised sedimentation for at least 2 h prior to the filtration process in order to remove any large solids. The filtered digestate samples were stored at 4 °C prior to analytical measurements. Total solids (TS), total suspended solids (TSS), and alkalinity were determined using the methods described in the Standing Committee of Analysts (SCA) blue books [30]. Each parameter measurement was conducted in triplicate and the average result is reported. The particle size distribution was determined by laser diffraction using a Malvern 3000 (Malvern Instruments, Malvern, UK).

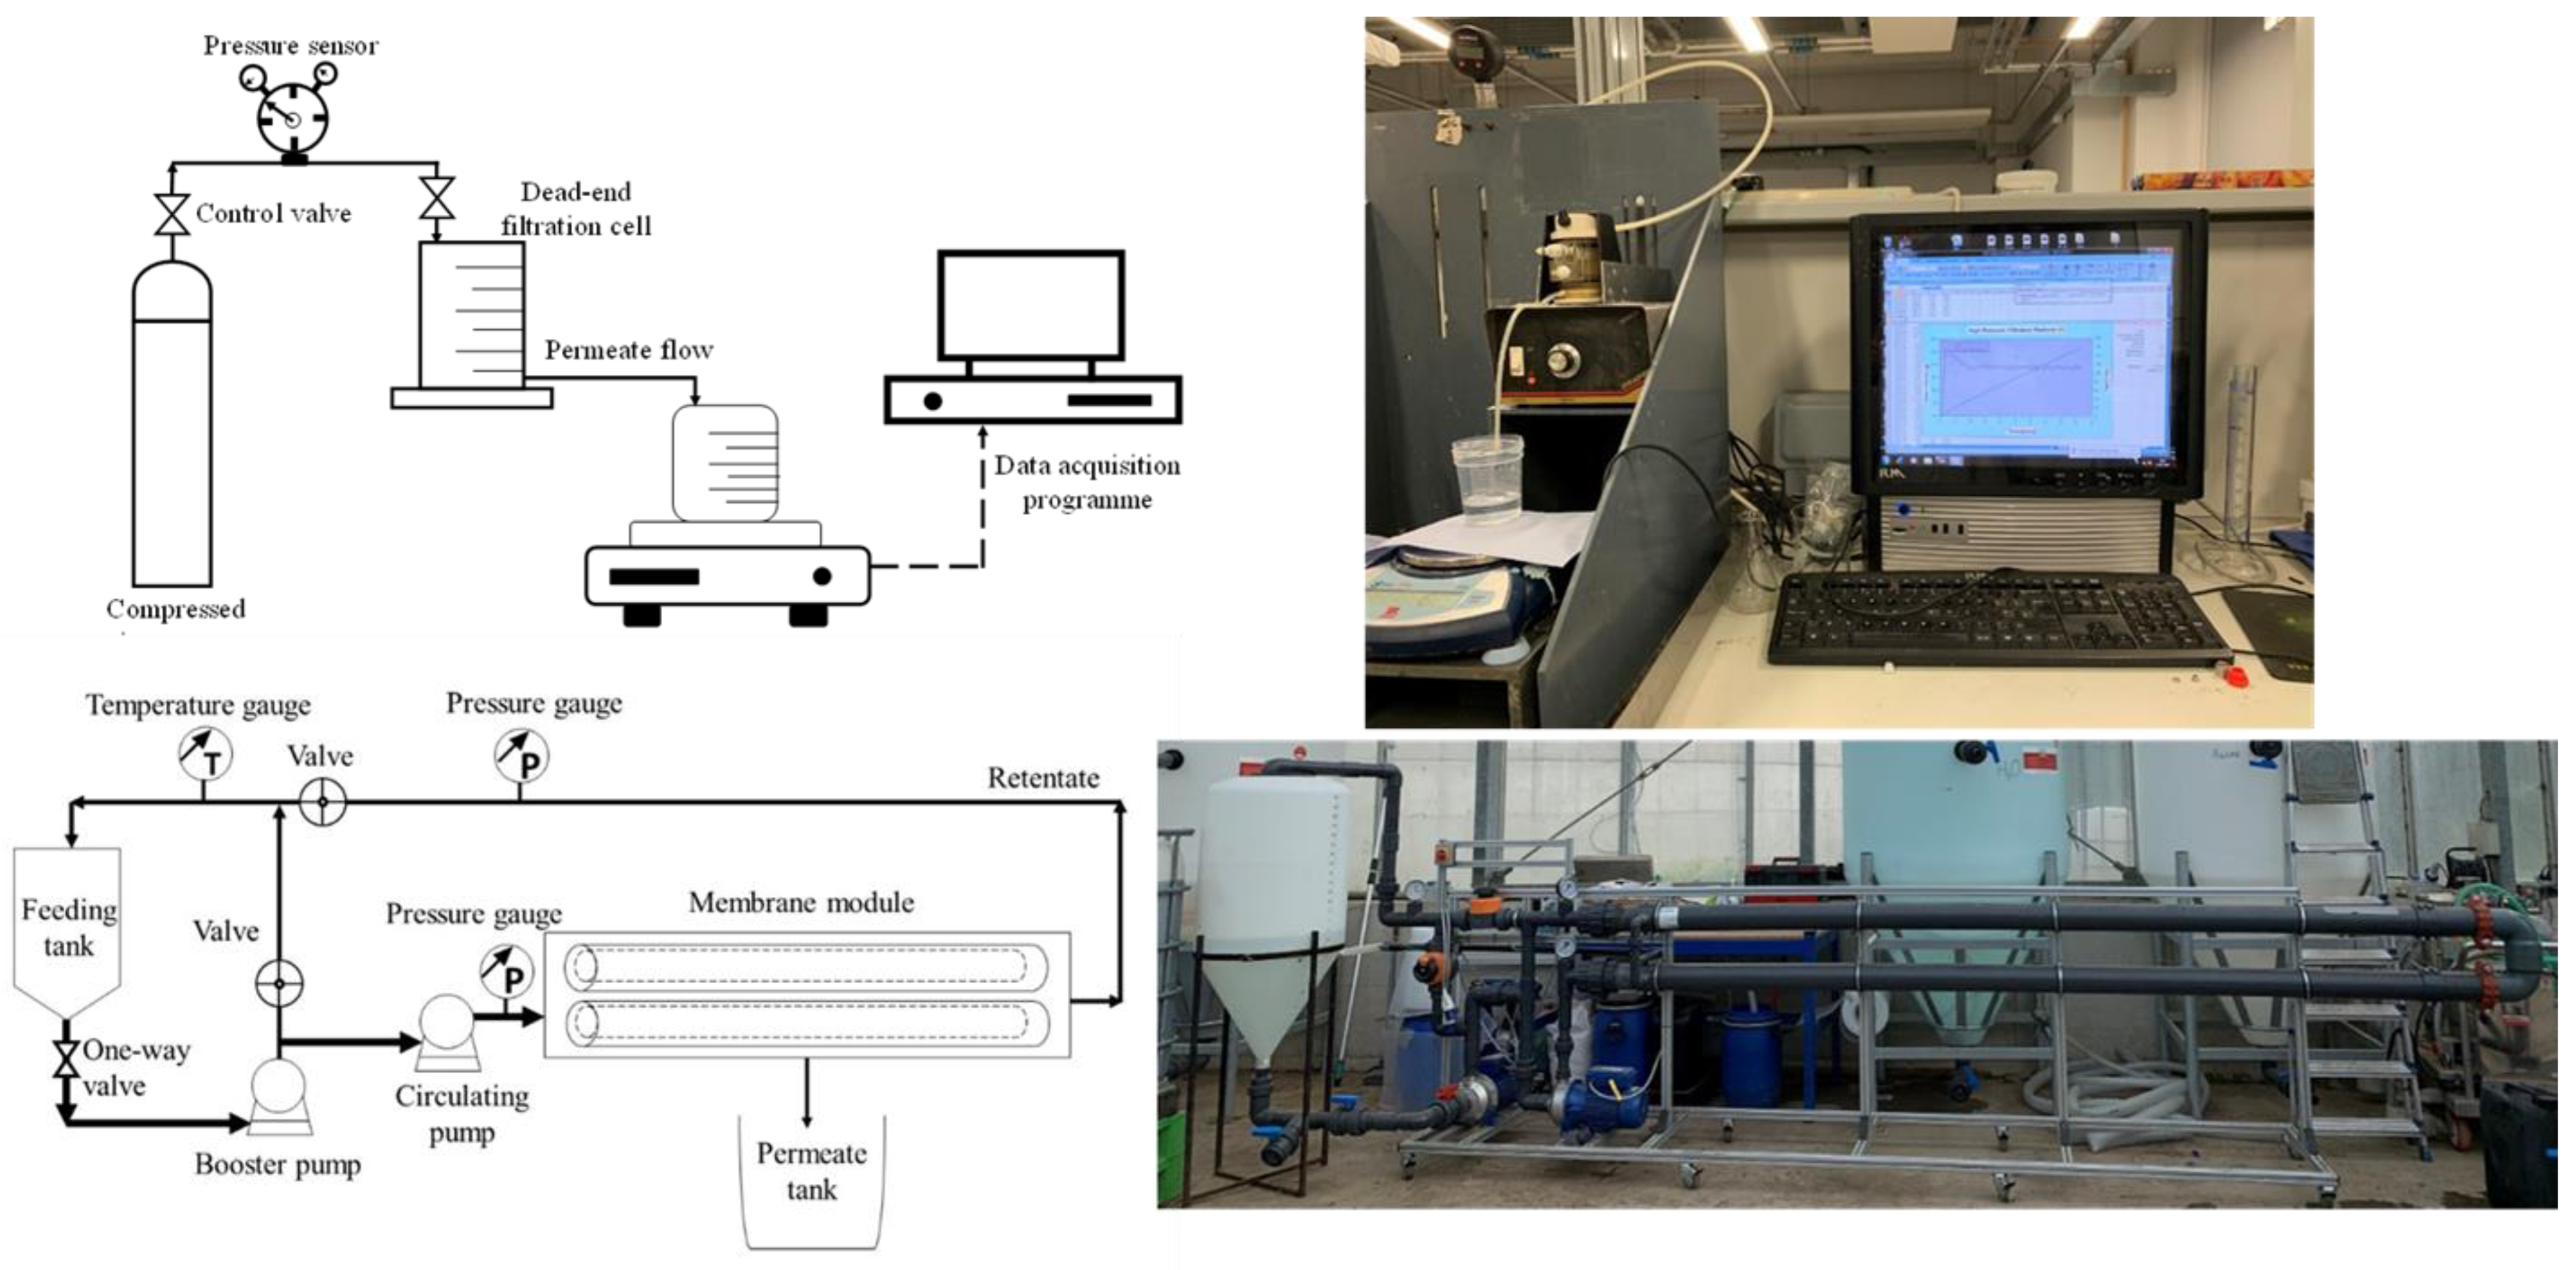
2.2. Bench-Scale Membrane Set-Up and Filtration

A schematic of the bench-scale filtration set-up used in this study is shown in Figure 1. Frontal (dead-end) filtration of the digestate samples was conducted using an Amicon 8050 stirred cell (Merck Millipore UK Ltd., Watford, UK). The operational limiting pressure was 5.2 bar [31]. The total filtration area was 14.6 cm2, and the maximum filtration volume was 50 mL. The Amicon cell was operated at room temperature (20 ± 2 °C) with the applied pressure set at four conditions: 0.5, 1, 1.5 and 2 bar. The pressure was controlled by a regulator connected to a nitrogen gas cylinder (BOC, Port Talbot, UK) and monitored by a pressure gauge (Druck DPI 104, RS Components, Northants, UK). The cell was not stirred, in order to allow cake formation to occur. To assess any long-term, irreversible fouling, the clean water flux for the membrane was measured before each digestate filtration. The filtration experiments were conducted with increasing pressure, i.e., 0.5 bar filtration followed by water wash, then 1.0 bar, and so on. For the repeated filtration cycle experiment, each pressure level was applied for 60 min only; this time period was chosen because the maximum flux decline due to cake fouling occurred within this timespan, and little if any additional fouling would have occurred beyond this point.
A Nadir US100 membrane (Microdyn Nadir, Wiesbaden, Germany) was used in the bench-scale experiments as it was as close a match as could be found to the commercial membrane used. The US100 is a polysulfone membrane with a MWCO of 100,000 Da and a pH operating range of 1 to 14. Permeate flow was captured with a beaker and measured via the mass weight output, which was monitored using an electronic balance (Ohaus Navigator N24120, Ohaus Europe, Switzerland) and recorded using the WinWedge software (TAL Technologies, Pennsylvania), taking readings at 5 s intervals. In the laboratory, raw anaerobic digestate was diluted with water at a 1:4 (v/v) ratio to approach optimal filtration performance. For the determination of fouling and cake formation, samples were dried in an oven overnight and weights were determined for both virgin membrane filters and membranes with retained digestate after filtration at each pressure level. To analyse the membrane recovery, after each bench-scale digestate filtration, the membrane was washed with tap water to remove the cake layer on the membrane surface. This cleaning procedure was performed four times (once for each pressure). The morphologies of the membrane samples and foulant layers were characterized using scanning electron microscopy (SEM, Hitachi S-4800, Hitachi, Tokyo, Japan).

2.3. Commercial Scale Membrane Module

The commercial scale plant system was built in the Swansea laboratory and shipped to the facility at Langage AD for operation; a schematic and picture of the rig is shown in Figure 1. The filtration system consisted of a crossflow filtration unit and a 250 L reservoir (Tanks UK, Minehead, UK). The filtration unit was a two-pump system that allowed the pressure and crossflow velocity to be varied independently. The two pumps were solid-handling centrifugal pumps (Lowara 350/03K/A, Anchor Pumps, Risley, UK). Temperature and pressure were measured directly on the rig via a standard temperature gauge (324-8407, RS Components, Pontypridd, UK) located in the return line and two pressure gauges (219-0889, RS Components, Pontypridd, UK) located upstream and downstream of the membrane. Two Georg Fischer diaphragm valves (214-0526, RS Components, Pontypridd, UK) were used (labelled pressure regulator) to control the flow and pressure in the system. The first valve was located above the feed pump, facilitating the priming of the system and acting as a bypass to regulate the crossflow. In this case, the valve was closed during operation to maximize the crossflow. The second valve was located in the return line and served to set the system pressure. The commercial membrane used in this study was the ABCOR®-INDUCOR tubular membrane module (Koch Membrane Systems, Hanley, UK); the module characteristics are given Table 1. The total area for each membrane was 4.2 m2, and two modules were installed in the system. The molecular weight cut-off (MWCO) of the membrane was 100,000 Da. This membrane was selected as the digestate contained heavy solids loading, and tubular membranes are a good option for such a process fluid. Previous studies [9,29] have shown that a microfiltration membrane is suitable for this separation; however, a larger MWCO commercial tubular membrane could not be found. Thus, this membrane was selected based on the notion that the process flux would be lower than that of a microfiltration membrane. The filtration system was capable of operation at 0.2 to 1.5 bar transmembrane pressure and was cleaned with water followed by diluted bleach (1% sodium metabisulphite solution) for approximately 15 min after every use. Between uses, it was stored in bleach solution. The permeate obtained from the digestate material was collected and diluted and the N:P ratio was adjusted for microalgae cultivation.

2.4. Theory and Determination of Filtration Resistance

The theoretical determination of filtration resistance is based on Darcy’s law.
t V = R m η | Δ P | A m + C b α η V 2 | Δ P | A m 2
where V is volume of filtrate, t is time of filtration, Rm is the membrane resistance, η is the dynamic viscosity of the permeate, ΔP is the applied pressure, Am is the filter area, Cb is the solid concentration (usually measured by dry solids per unit volume filtrate), and α is the specific cake resistance. The equation is that of a straight line when plotting t/V against V; the slope and intercepts of the line of best fit allow the calculation of Rm and α [32].
The resistance-in-series model is used to determine membrane fouling characteristics [33]. In this study, the classic fouling models of complete blocking, standard blocking, intermediate blocking, and cake filtration were used [34]. Before each filtration experiment, the pure water flux (Jw0) was measured. The cake resistance (Rc) was determined based on cake filtration theory (Equation (1)) and using Equation (4) [32,35]. Knowing Rt, Rc and Rm, yielding Rp, can be calculated with Equation (6).
J d = Δ P η R t
R t = R m + R f = R m + R c + R p
R c = α V C b A m
R p = Δ P η J d R c R m
where Jd is the permeate flux with digestate feed; Rt is the total resistance to permeation; Rf is the fouling resistance, which derives from Rc and Rp; Rc is cake resistance due to the cake layer formation on the membrane surface, which is very likely reversible after flushing with water [36,37]; Rp is the resistance resulting from blocked pores inside the membrane; η is the permeate viscosity (taken as water); and Rm represents the inherent resistance of the clean membrane.
The fouling index (I) is defined as
I = α C b
The fouling index represents the fluid fouling potential and may be used to predict permeate flux decline [38,39]. The theory described thus far assumes that an incompressible cake is formed; however, biological foulants are typically compressible, and the effects of compressibility on α at various applied pressures should be studied [38]. The cake compressibility may be correlated using Equation (7):
α = α   ( Δ P ) n
where α′ and n are constants. A plot of log α against log ΔP will be a straight line and will provide the constants. In practice, low values of n indicate a rigid and incompressible cake, whereas higher values indicate a highly compressible cake.

3. Results and Discussion

3.1. Characterisation of the Digestate and Virgin Membrane Water Permeability

3.1.1. Digestate Sampling and Characteristics

The characterisation of the raw digestate solid content is shown in Table 2, with a total solid content of 4.4 g L−1. The particle size distribution of the raw digestate is illustrated in Figure 2; these data indicated that the smallest particles in the slurry were in the region of 0.4 µm. This justified the use of a small pore membrane. During the filtration process, cake layer formation is critical and highly influenced by the particle size characteristics of the feed solution. The overall size range of solids within the anaerobic digestate was from 0.4 to 900 µm, with a multi-modal distribution with the largest peak at 12 µm. The D10, D50, and D90 were measured to be 3.88, 24.76, and 273.14 µm, respectively. This indicated that half of the particles were below 24.76 µm; as such, one would expect that the large particles would be deposited promptly on the membrane surface, while the small particles would likely fill the interstices and may be too small to be removed from the surface by shear forces, leading to a denser and more heterogenous cake [40,41,42]. According to Howe and Clarke [43], the pore size of a 100 kDa membrane is in the region of 14 nm, which should retain the particulate matter in a manner akin to that observed in the digestate size distribution data.

3.1.2. Pure Water Permeability

The results from the clean water flux experiments for the virgin membranes are shown in Figure 3 for both the bench-scale filtration set-up and the commercial scale set-up. In both cases, the membranes exhibited linear flux increases as the pressure was increased (R2 > 0.99 in both cases), as would be expected. At bench-scale, the specific flux was 225.4 L m−2 h−1 bar−1 and the commercial membrane was 50.0 L m−2 h−1 bar−1. The lower flux of the commercial membrane was attributed to the difference in surface-polymer chemistry of the two membranes, with PES being more hydrophilic than PVDF.

3.2. Bench-Scale Frontal (Dead-End) Filtration Experiments

3.2.1. Flux Decline and Pressure Effects

The membrane flux behaviour during digestate filtration is shown in Figure 4. An initial significant flux decline was observed for all four pressures in the first 60 min of filtration, followed by a mild decline and more steady flux rate. At each pressure, the initial flux dropped by approximately 80% after 60 min of filtration, specifically, 70% (0.5 bar), 82% (1 bar), 80% (1.5 bar), and 79% (2 bar). After 300 min of filtration, the initial flux dropped by 90%, 91%, 91% and 90% for each operating pressure, respectively. This demonstrated a sharp flux decline during the period of intense fouling of approximately 80%, followed by a gradual further decline of approximately 10% prior to achieving a steady state flux rate. This is common in most biological filtrations [44]. In a comparison of each applied pressure, the flux at 0.5 bar showed the least overall flux decline. However, this was based on the fact that the variation in the final flux rate was small while the variation in initial flux obtained at different pressures was relatively large, i.e., 30 to 46 L m−2 h−1 across the range studied.
Clearly, the development of a cake layer on the membrane surface caused reduced solvent transport through the membrane, and consequently, fouling became a determining characteristic of the flux. As the filtration progressed, a foulant layer formed and stabilised, which led to the later stage of slower but steady flux [45].
In this study, the final state of steady flux appeared after about 120 min and was 2.4, 3.8, 4.5 and 4.8 L m−2 h−1 respectively. The differences in flux achieved at the four pressures were relatively small; however, the physical flux rate itself was also small. Interestingly, the final steady state flux behaved in a non-linear fashion compared to the applied pressure driving force; this was consistent with the results of Zaidi et al. [46]. This result indicated that the membrane flux dependency on applied pressure disappeared when the cake resistance increased. The membrane steady-state flux can be associated with the onset of sheer-induced diffusion, which is significantly affected by the size distribution of the particles [47]. Therefore, taking into account the digestate characteristics and the laboratory trial, a short operating period with relatively high pressure was deemed to be practical for the commercial membrane module.

3.2.2. Filtration Cleaning Cycle and Membrane Flux Recovery

Detailed membrane filtration data for one full filtration cycle are shown in Figure 4a, and a similar data set for four filtration cycles is shown in Figure 4b; note that the data in this set have been truncated for the latter time profile for ease of display. During digestate filtration, the membrane flux declined rapidly, from around 65 L m−2 h−1 to 20 L m−2 h−1, and then declined slowly to around 10 L m−2 h−1. This was indicative of rapid fouling from cake formation and then further, progressive fouling over time as the cake became compacted. Increasing the applied pressure from 0.5 to 1.0 bar yielded some improvement in the overall flux profile, although further pressure increases had little impact in this respect. Repeating the experiment through four filtration cycles showed that there was a gradual reduction in the initial flux, dropping from around 65 L m−2 h−1 to around 55 L m−2 h−1 in Cycle 4. However, the final flux remained reasonably constant in the region of 10 L m−2 h−1 in all cases. The clean water flux recovery for Cycle 1 was 87% (0.5 bar), 85% (1 bar), 87% (1.5 bar) and 86% (2 bar), while by the end of Cycle 4, it was 88%, 88%, 88% and 87%, respectively. The progressive decline in flux recovery was attributed to the irreversible fouling that occurred during the digestate filtration process and may suggest that the remnants of the previous cycle formed the basis of the cake in the following cycle. In addition, the flux behaviour across the four cycles was similar, indicating that pressure has little impact on this irreversible fouling. Several studies have indicated that reversible membrane fouling during digestate filtration can be alleviated by either increasing the shear force during the filtration process [48,49] or by effective cleaning following the filtration [50]. The formation of cake layers by particle deposition is probably the leading cause of membrane fouling between filtration and washing cycles [50] and the main determinant of the characteristics of the cake, such as particle size (Figure 2), cake layer stability and the nature of the fouling [51,52]. In addition, biofouling caused by bacterial adhesion and subsequent growth is one of the most serious factors affecting long-term filtration performance [53]. Short-term filtration studies such as that performed here cannot be expected to reveal the long-term performance impact of biofilms [54].

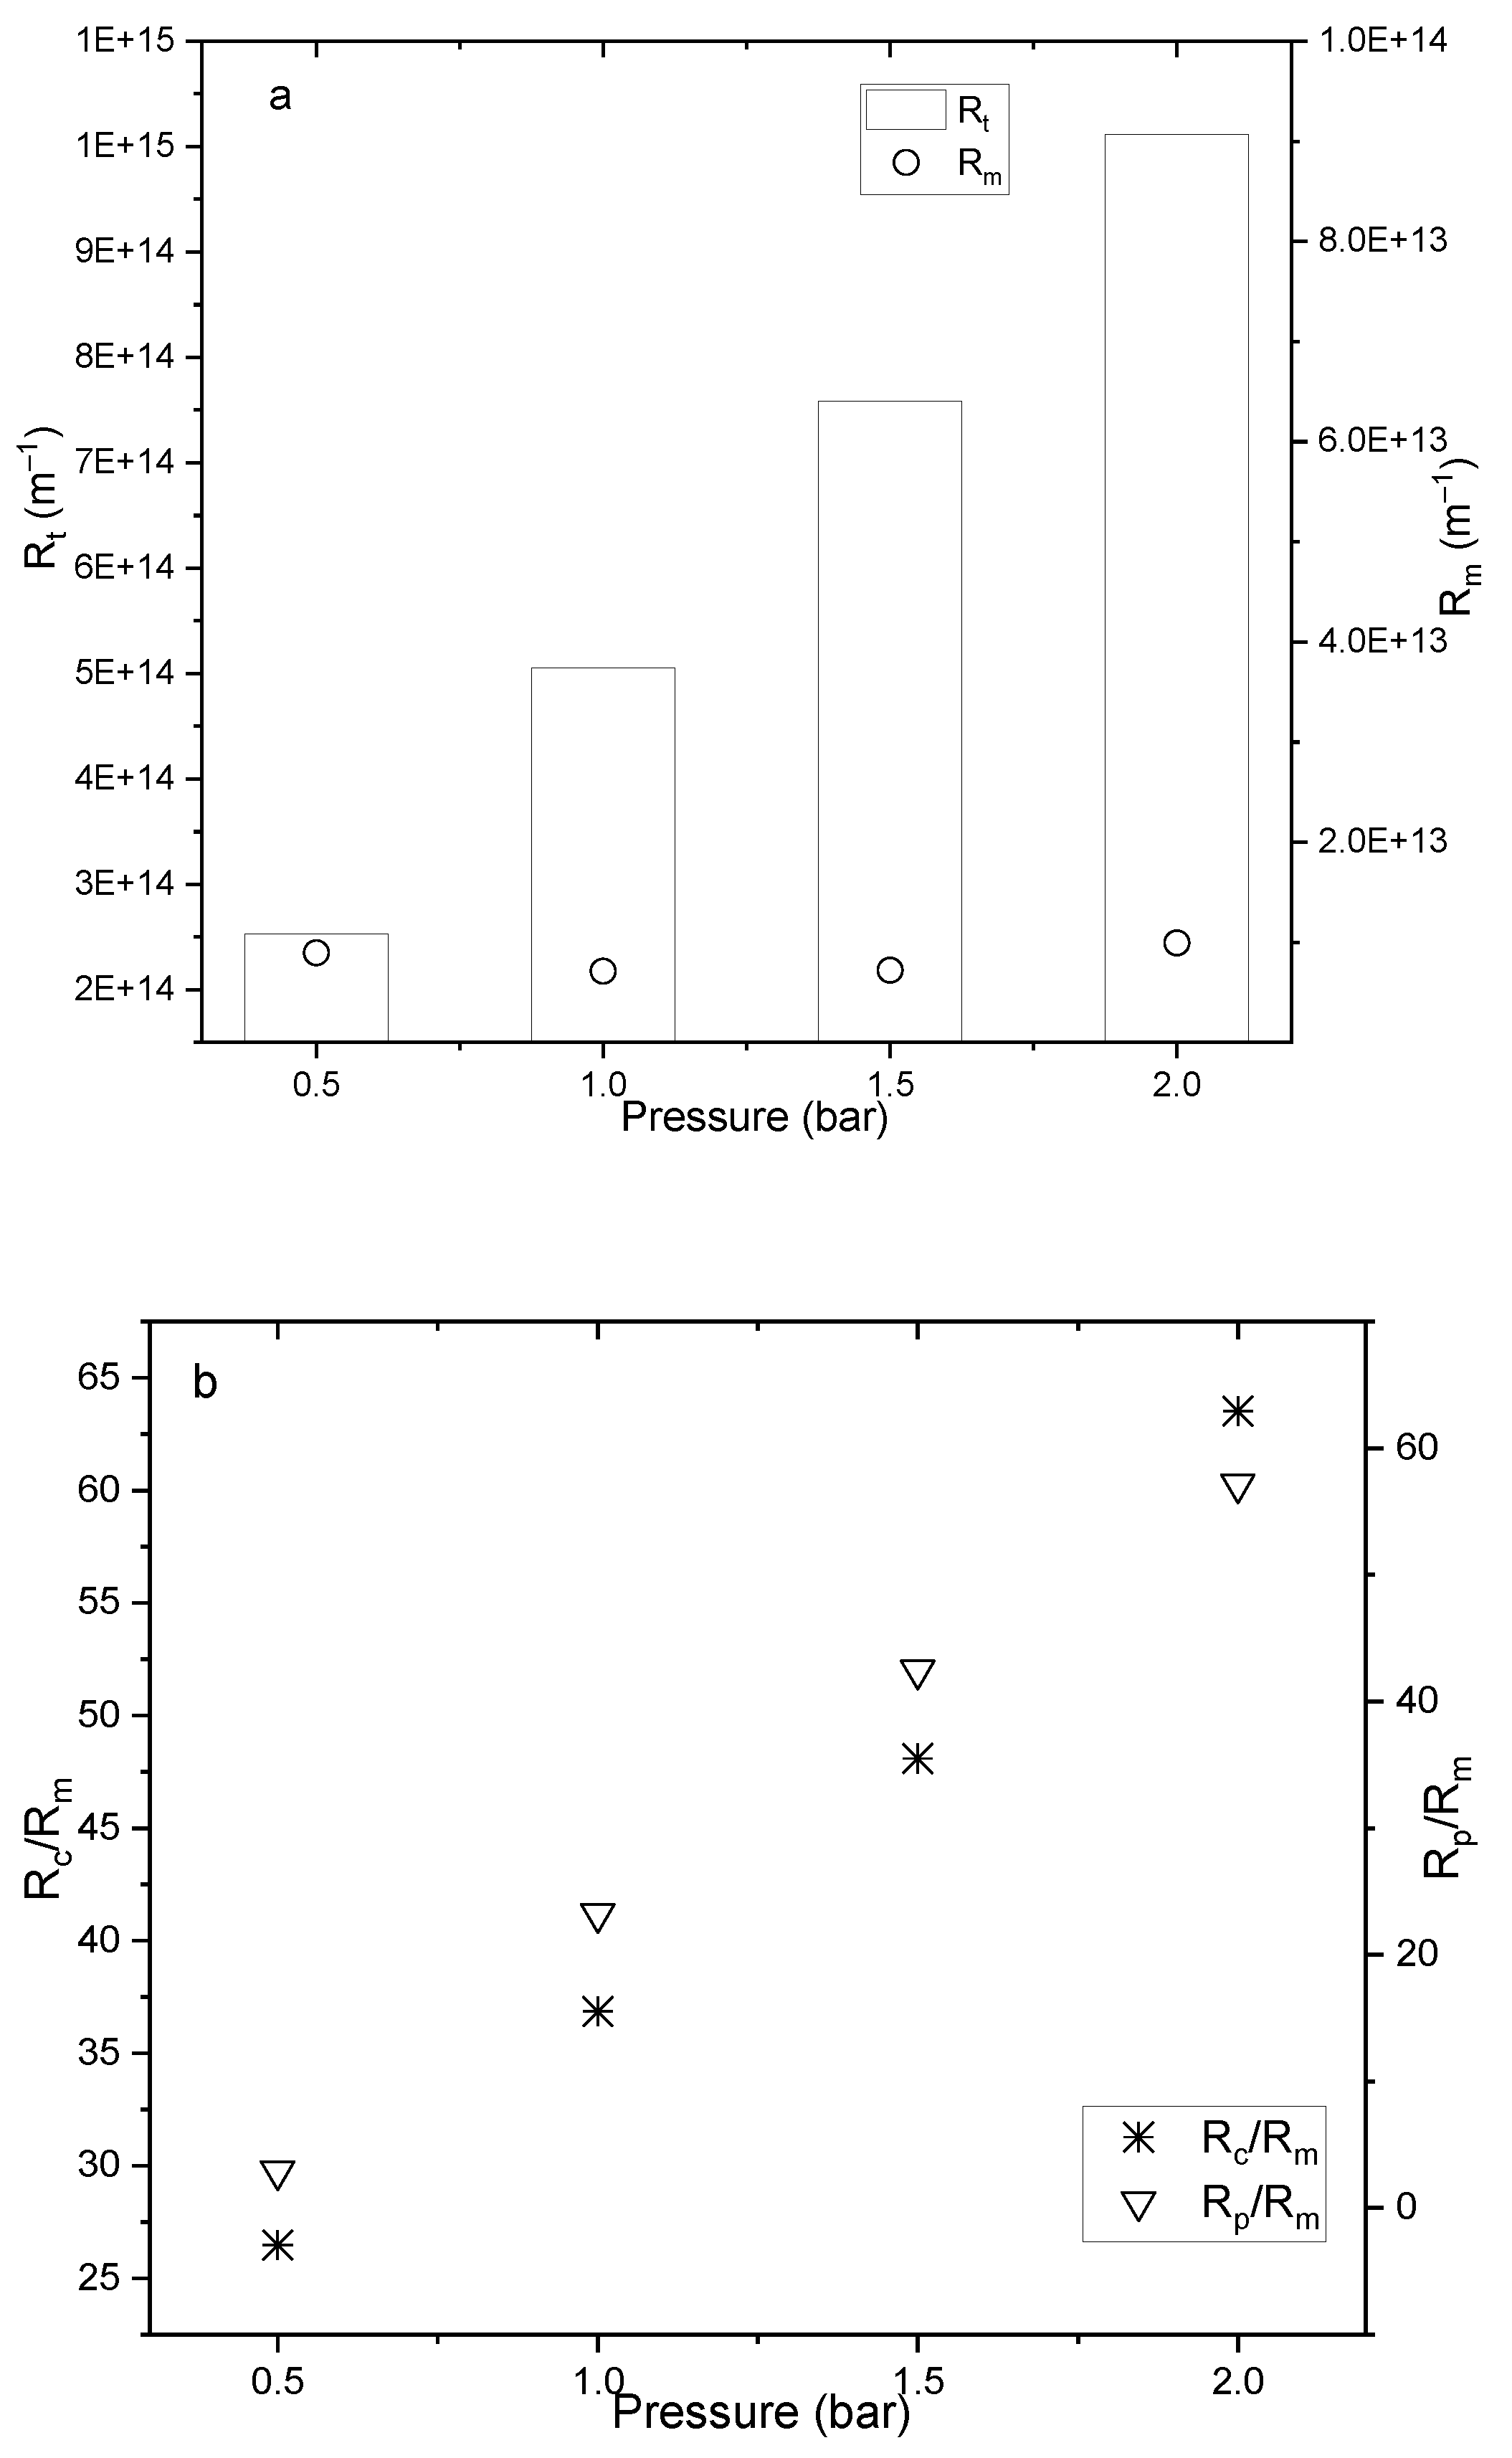
3.2.3. Cake Resistance and Membrane Fouling

Cake resistance (α) was determined using Equation (1) and a plot of (t/V) versus (V) for the various experimental pressures, as illustrated in Figure 5. The specific cake resistance (α) was calculated from the slope of the linear section of the plot (Figure 5a). The data from all four experimental pressures used showed good linear agreement (R2 ≥ 0.99 in all cases). This result is in accordance with previous research [55], suggesting the resistance due to pore blocking and adsorption occurs at the start of the filtration; the latter mechanism clearly dominated the filtration process. The magnitude of cake resistance was calculated to be 2.37 × 10¹⁵, 5.27 × 10¹⁵, 9.46 × 10¹⁵ and 9.57 × 10¹⁵ m kg−1 for the transmembrane pressures studied, i.e., 0.5, 1.0, 1.5 and 2.0 bar respectively. Generally, cake that is formed from nonbiological materials is less compressible than that comprising biological materials [56]. In this study, digestate was used, and the increase in the gradient of the linear section of the data as pressure increased was indicative of compression effects. In order to determine the cake compressibility index, a log-log plot of cake resistance versus pressure was created and is shown in Figure 5b. The data are represented by a linear curve fit (representative of a power-law expression). However, the data at the top right of the plot are bisected. This could mean that there was some experimental error and the whole dataset is linear, or that the compressibility of the cake increased and then stabilised at higher pressure. Further experiments are required at higher applied pressures to determine which of these statements is correct. Assuming the power-law expression (Equation (7)) is correct, then the n value was estimated to be 1.07, corresponding to only a very mildly compressible cake. This means that cake thickness remains relatively constant with increased applied pressure and is not ‘squeezed’, per se. These results are in accordance with those from previous studies [56,57]. In addition, cake compressibility was governed by the foulant concentration and physicochemical properties. Finally, there was evidence indicating an influence of scale on cake resistance and compressibility [58].
The various resistances of the permeate flow during the filtration process are shown in Figure 6. As expected for a compressible cake, the total resistance (Rt) increased with increasing pressure: the highest value was at 1.01 × 10¹⁵ m−1 at 2 bar, while the lowest was 2.53 × 10¹⁴ m−1 at 0.5 bar (Figure 6a). The membrane resistance for each filtration was similar across the range of applied pressures, varying between 7.11 × 10¹² m−1 to 9.93 × 10¹² m−1, which is effectively constant for experiments of this nature. The cake layer resistance, normalised by the membrane intrinsic resistance (Rc/Rm), was 26.48, 41.50 and 48.09 at each pressure, respectively, which accounted for 52–87% of Rt (Figure 6b). The normalised resistance due to pore blocking (Rp) was 2.92, 18.60, 42.46 and 57.17, respectively. The regression results on Rt (R2 = 0.99), Rc (R2 = 0.97) and Rp (R2 = 0.99) demonstrated that membrane fouling was directly proportional to the applied pressure. The wide range of particle sizes within the digestate likely contributed to the Rc and Rp simultaneously during filtration. Particles with low molecular weight may adhere inside of membrane pores and channels, resulting in pore blocking resistance, also referred to as stand blocking [34]. For anaerobic digestate, those particles are probably small inorganic particles and organics with hydrophobic features [39]. Complex digestate particles were accumulated and retained inside the membrane pore channel.
The initial applied pressure is essential for Rc (as discussed in Section 3.2.1). With higher initial pressure, the cake layer was compacted at a relatively high speed and a denser layer formed with fewer pores available, leading to increased cake layer resistance [57]. The applied pressure also controlled the permeate fluid flow, which carries the particles passing through membrane pores at the beginning of the filtration. Higher pressure indicates increased fluid speed with impulses to push more particles towards the membrane [59], leading to higher Rp and quick cake formation (higher Rc), and consequently, to larger value of total resistance. However, the filtration and washing cycles did not result in much differentiation in performance across the various applied pressures, which suggests that fouling by pore blocking is not irreversible in such cases.
Rt, Rc and Rp were all increased with increased applied pressure. There was a positive correlation between pressure and resistances (Rt R2 ≥ 0.99, Rc R2 ≥ 0.99, and Rp R2 ≥ 0.99). At a pressure of 2 bar, the Rp accounted for 47% relative to the total resistance, increasing by 95% from 0.5 bar to 2 bar. However, even though the increased rate of Rp was larger than that of Rc, the Rc/Rt value (52%) was slightly higher than Rp/Rt. This suggested that resistance from pore blocking is sensitive to pressure changes. Therefore, the applied pressure plays an important role at the beginning of the membrane fouling process, as it determines the rate of cake formation.
Previous studies have shown that cake resistance and pressure data can be determined by batch sedimentation when the pressure is relatively low [60]. Considering variations in the hydrodynamic properties and filtration time span, the cake properties may differ from the bench to commercial scale UF rig. The suggestions have been made that specific cake resistance decreases with larger filter surface size [61], and that shear forces reduce the deposition of large particles in crossflow filtration [62]. Therefore, it was speculated that the commercial membrane module in this research showed flux discrepancies or underwent less cake fouling than the bench scale trials would predict.

3.3. Membrane Surface Deposit Analysis

The SEM images in Figure 7 show the top surfaces and cross-sections of the membrane and cake layers for the virgin membrane and fouled membranes, which were used with one and four filtration and washing cycles. The top surface SEM image of the virgin membrane shows that the membrane surface before filtration was smooth and without foulants (Figure 7a). Following filtration, if there was no washing, the membrane surface was covered by foulant mixture with agglomerates, i.e., inorganic and organic particles from the digestate, as shown in Figure 7b,c. The quantity of surface foulant during digestate filtration was significantly reduced, as is visible by comparing the images in Figure 7b (without washing) and Figure 7d (after washing). Nevertheless, irreversible fouling, ascribed to bacterial cells, protein, polysaccharide and humic-like material in the digestate feed, is inevitable, as shown in Figure 7e. The anaerobic digestate used in this research did not undergo any pre-treatment, such as chlorination, which would break the cell structure or degrade organic materials. The growing cake layer on the membrane surface was probably a combination of inorganic calcium ions and undigested biological material from the digestate feed.
The fouling layer was more pronounced following four filtration cycles (as shown in Figure 7e) when compared to one filtration and washing cycle, indicating that continued particle attachment or deposition occurred during the first few filtration cycles. Similarly, after four filtration cycles, the foulants attached to the surface of the membranes appeared to be more densely packed (compare Figure 7b and Figure 7e). This comparison also suggests that although washing can remove surface cake layers to a certain point, foulants still gradually build up in frontal (dead-end) filtration mode. This could be a consequence of the irreversible fouling that resulted from membrane pore channel blocking. The cross-section SEM image (Figure 7c) shows that the membrane contained inter-connected pores, and that digestate penetrated into these pore structures. The accumulation of a cake layer on the membrane surface (Figure 7f) illustrates the complexity of the particle size and composition of the digestate, which led to the observed fouling behaviour.

3.4. Commercial Scale Membrane Testing

To compare the study and findings from the bench scale laboratory frontal (dead-end) filtration experiments, a scale-up of the digestate filtration process was conducted using a commercial crossflow membrane rig; the results are shown in Figure 8. Intermediate scale-up helps to better understand membrane performance (flux, fouling and flux recovery mechanisms), as opposed to simply predicting performance at a larger scale based on past-experience or derived rules [58]. Pure water flux was measured before and after the digestate filtration. The initial slight decline in water flux was due to a manual pressure adjustment, required to achieve an operating pressure of 0.5 bar. During digestate filtration, the flux dropped significantly, from 64.64 to 7.06 L m−2 h−1, and then gradually reached a relatively steady flux of 6.70 L m−2 h−1.
The initial rapid flux decline was due to the accumulation of foulants on the membrane surface during the first 10 min of active filtration. The hydrodynamic condition of the recirculating crossflow motion within the membrane module created shear and tended to scour any cake build up, preventing accumulation near the membrane interface [63]. This is demonstrated in Figure 8 by the almost flat profile of the membrane flux rate from 20 to 70 min. There was a marginal increase in flux during this period, which was attributed to the fact that the fluid warmed slightly during the experiment as a result of heat generation from the pumps. The permeate flux rate was different to that of the frontal (dead-end) filtration test in the laboratory. This was due to the membrane hydrophilicity being slightly different to that used in the laboratory, the crossflow action at the pilot scale and the fact that foulants were fractionated by ‘selective’ deposition. Therefore, it is very likely that the UF membrane flux rates varied in magnitude with both scale and process conditions [58]. Following digestate filtration, the rig was flushed with pure water once more (after 60 min of digestate filtration). The post digestate water flux bounded back to its initial value, i.e., 68.26 L m−2 h−1. The flux increased by 39% within 10 min after feeding with pure water. This indicated that the UF clean water flux could be successfully recovered within the water-digestate-water cycle. Camilleri-Rumbau et al. [50] recovered membrane flux by rinsing the membrane surface and soaking overnight in water following a forward osmosis filtration of digestate. Similarly, Waeger et al. [37] demonstrated that short-period water flushing was helpful to maintain high flux rates in a pilot UF. Therefore, both laboratory and commercial filtration studies of anaerobic digestate showed successful recovery of membrane flux.
The t/V versus V plot for commercial crossflow filtration is shown in Figure 9. This dataset did not follow a linear trajectory, especially in the early stage of the filtration. This was in accordance with other studies and probably indicated that the pore blocking preceded cake filtration as the primary fouling mechanism [64,65]. The curve formed a relatively straight line to the right of the dataset with a mild gradient, indicating that the cake formed with little or no compression; this is line with our laboratory results. The cake layer formation is limited by the fluid shear force caused by the scouring action of the crossflow. While Figure 9 indicates pore blocking, intermediate blocking may also play a relatively important role. In addition, the particle size analysis showed a certain number of large particles in the anaerobic digestate. Therefore, the cake layer contributes to the total resistance but can have a beneficial effect as a foulant pre-filter [17].
To aid with cleaning and to prevent biofouling caused by microbial adhesion, the commercial rig was flushed with water and diluted bleach after each use. To assess the performance longevity, the virgin membrane data were compared to performance after 12 months of constant membrane use. At an applied pressure of 0.63 bar, the initial steady-state digestate flux obtained was 9.24 L m−2 h−1, and after 12 months, was 8.70 L m−2 h−1. This was a flux decline of 4.8% over the 12-month active use period. While washing with water after every digestate filtration is efficient for flux recovery, and additional chemical cleaning helps to maintain the membrane, cleaning strategies should consider their total energy requirements. In this case, an assessment of energy costs versus the cost of the purchase of a new membrane was not conducted. However, the demonstrated longevity of the membrane indicated that this process is commercially viable.

4. Conclusions

In this research, anaerobic digestate was filtered to obtain a nitrogen- and phosphorous-rich solution that was suitable for use as a growth medium for microalgal cultivation. Laboratory scale characterisation of the digestate and the frontal (dead-end) filtration performance showed that the resulting cake was only mildly compressible, and that the digestate could be filtered to form a valuable, nutrient-rich permeate. The filtration operation developed in the laboratory was then successfully deployed on a commercial-scale filtration platform, and the nutrient recovery process was conducted for a period of one year. The filtration performed as expected, with similar separation efficiency to that observed at the bench-scale. Additionally, a simple cleaning procedure, consisting of flushing with water followed by a mild bleach wash, ensured that the flux performance remained practically unchanged over a one-year operational life. Based on the data acquired, the process developed is both reliable and robust and can now be scaled up to any operational capacity.

Author Contributions

Conceptualization, D.L.O.-R. and Y.X.; methodology, D.L.O.-R.; formal analysis, D.L.O.-R. and Y.X.; investigation, Y.X. and J.R.; writing—original draft preparation, Y.X.; writing—review and editing, D.L.O.-R. and G.S.M.A.; visualization, D.L.O.-R. and Y.X.; supervision, D.L.O.-R.; project administration, D.L.O.-R.; funding acquisition, D.L.O.-R. All authors have read and agreed to the published version of the manuscript.

Funding

This work was part funded by the ALG-AD project funded under the INTERREG North-West Europe program (project number: NWE 520) and the RICE project funded by the Welsh European Funding Office (WEFO) through the Welsh Government.

Acknowledgments

The authors would like to acknowledge Gary Jones and the team for providing digestate samples and for facilitating filtration operations at the Langage-AD facility.

Conflicts of Interest

The authors declare no conflict of interest.

References

  1. Ravanchi, M.T.; Kargari, A. New advances in membrane technology. In Advanced Technologies; IntechOpen: London, UK, 2009. [Google Scholar]
  2. Bringas, E.; Román, M.S.; Irabien, J.; Ortiz, I. An overview of the mathematical modelling of liquid membrane separation processes in hollow fibre contactors. J. Chem. Technol. Biotechnol. 2009, 84, 1583–1614. [Google Scholar] [CrossRef]
  3. Oatley-Radcliffe, D.L.; Williams, S.R.; Ainscough, T.J.; Lee, C.; Johnson, D.J.; Williams, P.M. Experimental determination of the hydrodynamic forces within nanofiltration membranes and evaluation of the current theoretical descriptions. Sep. Purif. Technol. 2015, 149, 339–348. [Google Scholar] [CrossRef]
  4. Olaizola, M. Commercial development of microalgal biotechnology: From the test tube to the marketplace. Biomol. Eng. 2003, 20, 459–466. [Google Scholar] [CrossRef]
  5. Christenson, L.; Sims, R. Production and harvesting of microalgae for wastewater treatment, biofuels, and bioproducts. Biotechnol. Adv. 2011, 29, 686–702. [Google Scholar] [CrossRef] [PubMed]
  6. Praveen, P.; Guo, Y.; Kang, H.; Lefebvre, C.; Loh, K.-C. Enhancing microalgae cultivation in anaerobic digestate through nitrification. Chem. Eng. J. 2018, 354, 905–912. [Google Scholar] [CrossRef]
  7. Dadrasnia, A.; Muñoz, I.D.B.; Yáñez, E.H.; Lamkaddam, I.U.; Mora, M.; Ponsá, S.; Ahmed, M.; Argelaguet, L.L.; Williams, P.M.; Oatley-Radcliffe, D.L. Sustainable nutrient recovery from animal manure: A review of current best practice technology and the potential for freeze concentration. J. Clean. Prod. 2021, 315, 128106. [Google Scholar] [CrossRef]
  8. Vigneswaran, S.; Ngo, H.H.; Chaudhary, D.S.; Hung, Y.T. Physicochemical Treatment Processes for Water Reuse. In Physicochemical Treatment Processes. Handbook of Environmental Engineering; Wang, L.K., Hung, Y.T., Shammas, N.K., Eds.; Humana Press: Totowa, NJ, USA, 2005; Volume 3. [Google Scholar]
  9. Gerardo, M.L.; Oatley-Radcliffe, D.L.; Lovitt, R. Integration of membrane technology in microalgae biorefineries. J. Membr. Sci. 2014, 464, 86–99. [Google Scholar] [CrossRef]
  10. Monfet, E.; Aubry, G.; Ramirez, A.A. Nutrient removal and recovery from digestate: A review of the technology. Biofuels 2016, 9, 247–262. [Google Scholar] [CrossRef]
  11. Fernandes, F.; Silkina, A.; Fuentes-Grünewald, C.; Wood, E.E.; Ndovela, V.L.; Oatley-Radcliffe, D.L.; Lovitt, R.W.; Llewellyn, C.A. Valorising nutrient-rich digestate: Dilution, settlement and membrane filtration processing for optimisation as a waste-based media for microalgal cultivation. Waste Manag. 2020, 118, 197–208. [Google Scholar] [CrossRef]
  12. Arvanitoyannis, I.S.; Varzakas, T.H. Fruit/fruit juice waste management: Treatment methods and potential uses of treated waste. Waste Manag. Food Ind. 2008, 2, 569–628. [Google Scholar]
  13. Liao, Y.; Bokhary, A.; Maleki, E.; Liao, B. A review of membrane fouling and its control in algal-related membrane processes. Bioresour. Technol. 2018, 264, 343–358. [Google Scholar] [CrossRef] [PubMed]
  14. Le-Clech, P.; Chen, V.; Fane, T.A. Fouling in membrane bioreactors used in wastewater treatment. J. Membr. Sci. 2006, 284, 17–53. [Google Scholar] [CrossRef]
  15. Zacharof, M.-P.; Mandale, S.J.; Oatley-Radcliffe, D.; Lovitt, R.W. Nutrient recovery and fractionation of anaerobic digester effluents employing pilot scale membrane technology. J. Water Process Eng. 2019, 31, 100846. [Google Scholar] [CrossRef]
  16. Hermia, J. Constant pressure blocking filtration laws: Application to power-law non-Newtonian fluids. Trans. Inst. Chem. Eng. 1982, 60, 183–187. [Google Scholar]
  17. Di Bella, G.; Durante, F.; Torregrossa, M.; Viviani, G. Start-up with or without inoculum? Analysis of an SMBR pilot plant. Desalination 2010, 260, 79–90. [Google Scholar] [CrossRef]
  18. Ping, C.H.; Li, X. Membrane fouling in a membrane bioreactor (MBR): Sludge cake formation and fouling characteristics. Biotechnol. Bioeng. 2005, 90, 323–331. [Google Scholar] [CrossRef]
  19. Lindau, J.; Jönsson, A.-S. Cleaning of ultrafiltration membranes after treatment of oily waste water. J. Membr. Sci. 1994, 87, 71–78. [Google Scholar] [CrossRef]
  20. Ammerlaan, A.; Franklin, J.; Moody, C. Moody. Yuma desalting plant. Membrane degradation during test operations. Desalination 1992, 88, 33–49. [Google Scholar] [CrossRef]
  21. Rabiller-Baudry, M.; Le Maux, M.; Chaufer, B.; Begoin, L. Characterisation of cleaned and fouled membrane by ATR—FTIR and EDX analysis coupled with SEM: Application to UF of skimmed milk with a PES membrane. Desalination 2002, 146, 123–128. [Google Scholar] [CrossRef]
  22. Li, J.; Sanderson, R.; Hallbauer, D.; Hallbauer-Zadorozhnaya, V. Measurement and modelling of organic fouling deposition in ultrafiltration by ultrasonic transfer signals and reflections. Desalination 2002, 146, 177–185. [Google Scholar] [CrossRef]
  23. Kanani, D.M.; Sun, X.; Ghosh, R. Reversible and irreversible membrane fouling during in-line microfiltration of concentrated protein solutions. J. Membr. Sci. 2008, 315, 1–10. [Google Scholar] [CrossRef]
  24. Horng, R.-Y.; Huang, C.; Chang, M.-C.; Shao, H.; Shiau, B.-L.; Hu, Y.-J. Application of TiO2 photocatalytic oxidation and non-woven membrane filtration hybrid system for degradation of 4-chlorophenol. Desalination 2009, 245, 169–182. [Google Scholar] [CrossRef]
  25. Di Bella, G.; Di Trapani, D. A brief review on the resistance-in-series model in membrane bioreactors (MBRs). Membranes 2019, 9, 24. [Google Scholar] [CrossRef] [PubMed]
  26. De Amorim, M.T.P.; Ramos, I.R.A. Control of irreversible fouling by application of dynamic membranes. Desalination 2006, 192, 63–67. [Google Scholar] [CrossRef]
  27. Choi, H.; Zhang, K.; Dionysiou, D.D.; Oerther, D.B.; Sorial, G.A. Influence of cross-flow velocity on membrane performance during filtration of biological suspension. J. Membr. Sci. 2005, 248, 189–199. [Google Scholar] [CrossRef]
  28. Drews, A. Membrane fouling in membrane bioreactors—Characterisation, contradictions, cause and cures. J. Membr. Sci. 2010, 363, 1–28. [Google Scholar] [CrossRef]
  29. Gerardo, M.L.; Aljohani, N.H.; Oatley-Radcliffe, D.L.; Lovitt, R. Moving towards sustainable resources: Recovery and fractionation of nutrients from dairy manure digestate using membranes. Water Res. 2015, 80, 80–89. [Google Scholar] [CrossRef]
  30. Standing Committee of Analysts. Methods for the Examination of Waters and Associated Materials—Ammonia in Water; Her Majesty’s Stationery Office: London, UK, 1981. [Google Scholar]
  31. Oatley-Radcliffe, D.L.; Williams, S.R.; Lee, C.; Williams, P.M. Characterisation of Mass Transfer in Frontal Nanofiltration Equipment and Development of a Simple Correlation. J. Membr. Sep. Technol. 2015, 4, 149–160. [Google Scholar] [CrossRef]
  32. Listiarini, K.; Sun, D.D.; Leckie, J.O. Organic fouling of nanofiltration membranes: Evaluating the effects of humic acid, calcium, alum coagulant and their combinations on the specific cake resistance. J. Membr. Sci. 2009, 332, 56–62. [Google Scholar] [CrossRef]
  33. Khan, S.J.; Visvanathan, C.; Jegatheesan, V. Prediction of membrane fouling in MBR systems using empirically estimated specific cake resistance. Bioresour. Technol. 2009, 100, 6133–6136. [Google Scholar] [CrossRef]
  34. Qu, F.; Liang, H.; Zhou, J.; Nan, J.; Shao, S.; Zhang, J.; Li, G. Ultrafiltration membrane fouling caused by extracellular organic matter (EOM) from Microcystis aeruginosa: Effects of membrane pore size and surface hydrophobicity. J. Membr. Sci. 2014, 449, 58–66. [Google Scholar] [CrossRef]
  35. Bowen, W.R.; Jenner, F. Theoretical descriptions of membrane filtration of colloids and fine particles: An assessment and review. Adv. Colloid Interface Sci. 1995, 56, 141–200. [Google Scholar] [CrossRef]
  36. Benítez, F.J.; Acero, J.L.; Leal, A.I.; González, M. The use of ultrafiltration and nanofiltration membranes for the purification of cork processing wastewater. J. Hazard. Mater. 2009, 162, 1438–1445. [Google Scholar] [CrossRef] [PubMed]
  37. Waeger, F.; Delhaye, T.; Fuchs, W. The use of ceramic microfiltration and ultrafiltration membranes for particle removal from anaerobic digester effluents. Sep. Purif. Technol. 2010, 73, 271–278. [Google Scholar] [CrossRef]
  38. Sioutopoulos, D.C.; Karabelas, A.J. Correlation of organic fouling resistances in RO and UF membrane filtration under constant flux and constant pressure. J. Membr. Sci. 2012, 407–408, 34–46. [Google Scholar] [CrossRef]
  39. Choi, J.-S.; Hwang, T.-M.; Lee, S.; Hong, S. A systematic approach to determine the fouling index for a RO/NF membrane process. Desalination 2009, 238, 117–127. [Google Scholar] [CrossRef]
  40. Fu, L.F.; Brian, A.D. Modeling the effect of particle size and charge on the structure of the filter cake in ultrafiltration. J. Membr. Sci. 1998, 149, 221–240. [Google Scholar]
  41. Lahoussine-Turcaud, V.; Wiesner, M.R.; Bottero, J.-Y. Fouling in tangential-flow ultrafiltration: The effect of colloid size and coagulation pretreatment. J. Membr. Sci. 1990, 52, 173–190. [Google Scholar] [CrossRef]
  42. Shao, S.; Liang, H.; Qu, F.; Li, K.; Chang, H.; Yu, H.; Li, G. Combined influence by humic acid (HA) and powdered activated carbon (PAC) particles on ultrafiltration membrane fouling. J. Membr. Sci. 2016, 500, 99–105. [Google Scholar] [CrossRef]
  43. Howe, K.J.; Clark, M.M. Fouling of Microfiltration and Ultrafiltration Membranes by Natural Waters. Environ. Sci. Technol. 2002, 36, 3571–3576. [Google Scholar] [CrossRef]
  44. Izadpanah, A.A.; Javidnia, A. The Ability of a Nanofiltration Membrane to Remove Hardness and Ions from Diluted Seawater. Water 2012, 4, 283–294. [Google Scholar] [CrossRef]
  45. Chen, J.C.; Li, Q.; Elimelech, M. In situ monitoring techniques for concentration polarization and fouling phenomena in membrane filtration. Adv. Colloid Interface Sci. 2004, 107, 83–108. [Google Scholar] [CrossRef] [PubMed]
  46. Zaidi, S.K.; Kumar, A. Experimental studies in the dead-end ultrafiltration of dextran: Analysis of concentration polarization. Sep. Purif. Technol. 2004, 36, 115–130. [Google Scholar] [CrossRef]
  47. Maruf, S.H.; Greenberg, A.R.; Pellegrino, J.; Ding, Y. Critical flux of surface-patterned ultrafiltration membranes during cross-flow filtration of colloidal particles. J. Membr. Sci. 2014, 471, 65–71. [Google Scholar] [CrossRef]
  48. Masse, L.; Mondor, M.; Talbot, G.; Deschênes, L.; Drolet, H.; Gagnon, N.; St-Germain, F.; Puig-Bargués, J. Fouling of Reverse Osmosis Membranes Processing Swine Wastewater Pretreated by Mechanical Separation and Aerobic Biofiltration. Sep. Sci. Technol. 2014, 49, 1298–1308. [Google Scholar] [CrossRef]
  49. Yuan, Y.; Kilduff, J.E. Effect of colloids on salt transport in crossflow nanofiltration. J. Membr. Sci. 2010, 346, 240–249. [Google Scholar] [CrossRef]
  50. Camilleri-Rumbau, M.S.; Soler-Cabezas, J.L.; Christensen, K.V.; Norddahl, B.; Mendoza-Roca, J.A.; Vincent-Vela, M.C. Application of aquaporin-based forward osmosis membranes for processing of digestate liquid fractions. Chem. Eng. J. 2019, 371, 583–592. [Google Scholar] [CrossRef]
  51. Ang, W.; Elimelech, M. Protein (BSA) fouling of reverse osmosis membranes: Implications for wastewater reclamation. J. Membr. Sci. 2007, 296, 83–92. [Google Scholar] [CrossRef]
  52. Hong, S.; Elimelech, M. Chemical and physical aspects of natural organic matter (NOM) fouling of nanofiltration membranes. J. Membr. Sci. 1997, 132, 159–181. [Google Scholar] [CrossRef]
  53. Goosen, M.F.A.; Sablani, S.S.; Roque-Malherbe, R. Membrane fouling: Recent strategies and methodologies for its minimization. In Handbook of Membrane Separations: Chemical, Pharmaceuticals, Food and Biotechnological Applications; CRC Press: Boca Raton, FL, USA; Taylor and Francis: Boca Raton, FL, USA, 2008; pp. 325–341. [Google Scholar]
  54. Miller, D.J.; Araújo, P.A.; Correia, P.B.; Ramsey, M.M.; Kruithof, J.C.; van Loosdrecht, M.C.M.; Freeman, B.D.; Paul, D.R.; Whiteley, M.; Vrouwenvelder, J.S. Short-term adhesion and long-term biofouling testing of polydopamine and poly (ethylene glycol) surface modifications of membranes and feed spacers for biofouling control. Water Res. 2012, 46, 3737–3753. [Google Scholar] [CrossRef]
  55. Alhadidi, A.; Kemperman, A.J.B.; Blankert, B.; Schippers, J.C.; Wessling, M.; van der Meer, W.G.J. Silt Density Index and Modified Fouling Index relation, and effect of pressure, temperature and membrane resistance. Desalination 2011, 273, 48–56. [Google Scholar] [CrossRef]
  56. Macášek, F.; Navratil, J.D. Separations Chemistry: Revised and Expanded Edition; Xlibris Corporation: Bloomington, IN, USA, 2016. [Google Scholar]
  57. Ao, L.; Liu, W.; Zhang, M.; Wang, X. Analysis of effect of particles on cake layer compressibility during ultrafiltration of upflow biological activated carbon effluent. Sci. Total Environ. 2018, 619–620, 232–238. [Google Scholar] [CrossRef] [PubMed]
  58. Tarleton, E.; Willmer, S. The Effects of Scale and Process Parameters in Cake Filtration. Chem. Eng. Res. Des. 1997, 75, 497–507. [Google Scholar] [CrossRef]
  59. Qu, F.; Wang, H.; He, J.; Fan, G.; Pan, Z.; Tian, J.; Rong, H.; Li, G.; Yu, H. Tertiary treatment of secondary effluent using ultrafiltration for wastewater reuse: Correlating membrane fouling with rejection of effluent organic matter and hydrophobic pharmaceuticals. Environ. Sci. Water Res. Technol. 2019, 5, 672–683. [Google Scholar] [CrossRef]
  60. Eiji, I.; Katagiri, N. Research and Development Activity on Filtration and Separation in Japan—Milestones and State of the Art. Filtration 2015, 15, 153–161. [Google Scholar]
  61. Bourcier, D.; Féraud, J.P.; Colson, D.; Mandrick, K.; Ode, D.; Brackx, E.; Puel, F. Influence of particle size and shape properties on cake resistance and compressibility during pressure filtration. Chem. Eng. Sci. 2016, 144, 176–187. [Google Scholar] [CrossRef]
  62. Poorasgari, E.; Bugge, T.V.; Christensen, M.L.; Jørgensen, M.K. Compressibility of fouling layers in membrane bioreactors. J. Membr. Sci. 2015, 475, 65–70. [Google Scholar] [CrossRef]
  63. Shamsuddin, N.; Cao, C.; Starov, V.M.; Das, D.B. A comparative study between stirred dead end and circular flow in microfiltration of China clay suspensions. Water Supply 2015, 16, 481–492. [Google Scholar] [CrossRef]
  64. Aslam, M.; Lee, P.-H.; Kim, J. Analysis of membrane fouling with porous membrane filters by microbial suspensions for autotrophic nitrogen transformations. Sep. Purif. Technol. 2015, 146, 284–293. [Google Scholar] [CrossRef]
  65. Wang, F.; Tarabara, V. Pore blocking mechanisms during early stages of membrane fouling by colloids. J. Colloid Interface Sci. 2008, 328, 464–469. [Google Scholar] [CrossRef]
Figure 1. Schematic diagram and picture of the laboratory frontal (dead-end) filtration equipment (top) and the commercial crossflow filtration rig with KOCH ABCOR® tubular membrane (bottom).
Energies 15 05976 g001
Figure 2. Particle size distribution for the digestate sample.
Energies 15 05976 g002
Figure 3. Clean water flux comparison for the two membranes used in this study. (a) The PSUH Nadir US100 membrane, used in the frontal (dead-end) filtration experiments; and (b) the PVDF KOCH ABCOR® tubular membrane system.
Energies 15 05976 g003
Figure 4. Permeate flux data for the frontal (dead-end) filtration experiments with digestate, no stirring, and a water wash following each experiment. (a) Variation of permeate flux with diluted digestate as a function of time at four pressures/300-min experiment; (b) permeate flux for four filtration cycles (data truncated on time axis for ease of display)/60-min experiment; and (c) initial permeate flux versus applied pressure.
Energies 15 05976 g004
Figure 5. Manipulation of the frontal (dead-end) filtration experimental data from which to derive filtration characteristics. (a) Plot of t/V versus V from which to derive the membrane resistance and specific cake resistance; (b) log-log plot of specific cake resistance and applied pressure from which to derive the compressibility index (inset shows values of fouling index (I) versus applied pressure).
Energies 15 05976 g005
Figure 6. Derived membrane resistances for the frontal (dead-end) filtration experiments. (a) Total filtration resistance Rt and intrinsic membrane resistance Rm versus applied pressure; (b) normalised cake filtration resistance as the ratio Rc/Rm, and pore resistance Rp/Rm versus applied pressure.
Energies 15 05976 g006
Figure 7. Scanning electron microscopy images for the Nadir US100 membrane. (a) Surface morphology of the clean membrane; (b) surface morphology of fouled membrane with cake layer; (c) cross-section of fouled membrane showing cake layer; (d) surface morphology of the membrane following one filtration and washing cycle; (e) surface morphology of the membrane after four filtration and washing cycles; and (f) surface morphology of the membrane following filtration but without washing.
Energies 15 05976 g007
Figure 8. Permeate flux variation using a commercial crossflow membrane plant fitted with the KOCH ABCOR® tubular membrane (system operated at 0.5 bar; fluid temperature is shown as TEMP). The three sections from left to right are: pre-flushing with water, introduction of raw digestate and post-filtration washing with water.
Energies 15 05976 g008
Figure 9. t/V versus V plot for the commercial crossflow filtration experiment at 0.5 bar.
Energies 15 05976 g009
Table 1. Characteristics of the ABCOR®-INDUCOR module used in this study.
Intersection Shape Energies 15 05976 i001
SupplierKoch Membrane Systems
Part number (KPN)0712510
Molecular weight cut-off (Daltons)100,000
Membrane chemistryPolyvinylidene fluoride (PVDF)
Faceplate materialAcrylonitrile butadiene styrene (ABS)
Construction30 0.5inch diameter tubules in a PVC shell
GasketVITON®
Membrane typeHFM (neutral charge)
Membrane effective area (m2)4.2
Continuous pH exposure range2.0–10.0
Short term pH exposure range1.5–10.5
Max. inlet pressure (bar @ 48 °C)6.2
Max. operation temperature (°C @ 5.6 bar max.)50
Max. permeate side back pressure (bar)0.2
Min. outlet pressure (bar)0.3
Max. feeding pressure drop (bar @ 48 °C)0.5
Table 2. Characteristics of the raw digestate.
ParameterDigestate Mean ± SDUnit
pH7.66-
Total solids4.37 ± 1.08g L−1
Total suspended solids2.49 ± 0.29g L−1
Publisher’s Note: MDPI stays neutral with regard to jurisdictional claims in published maps and institutional affiliations.

