Computational Modelling of the Impacts of Saltmarsh Management Interventions on Hydrodynamics of a Small Macro-Tidal Estuary

 , ,
, ,
Abstract
:1. Introduction
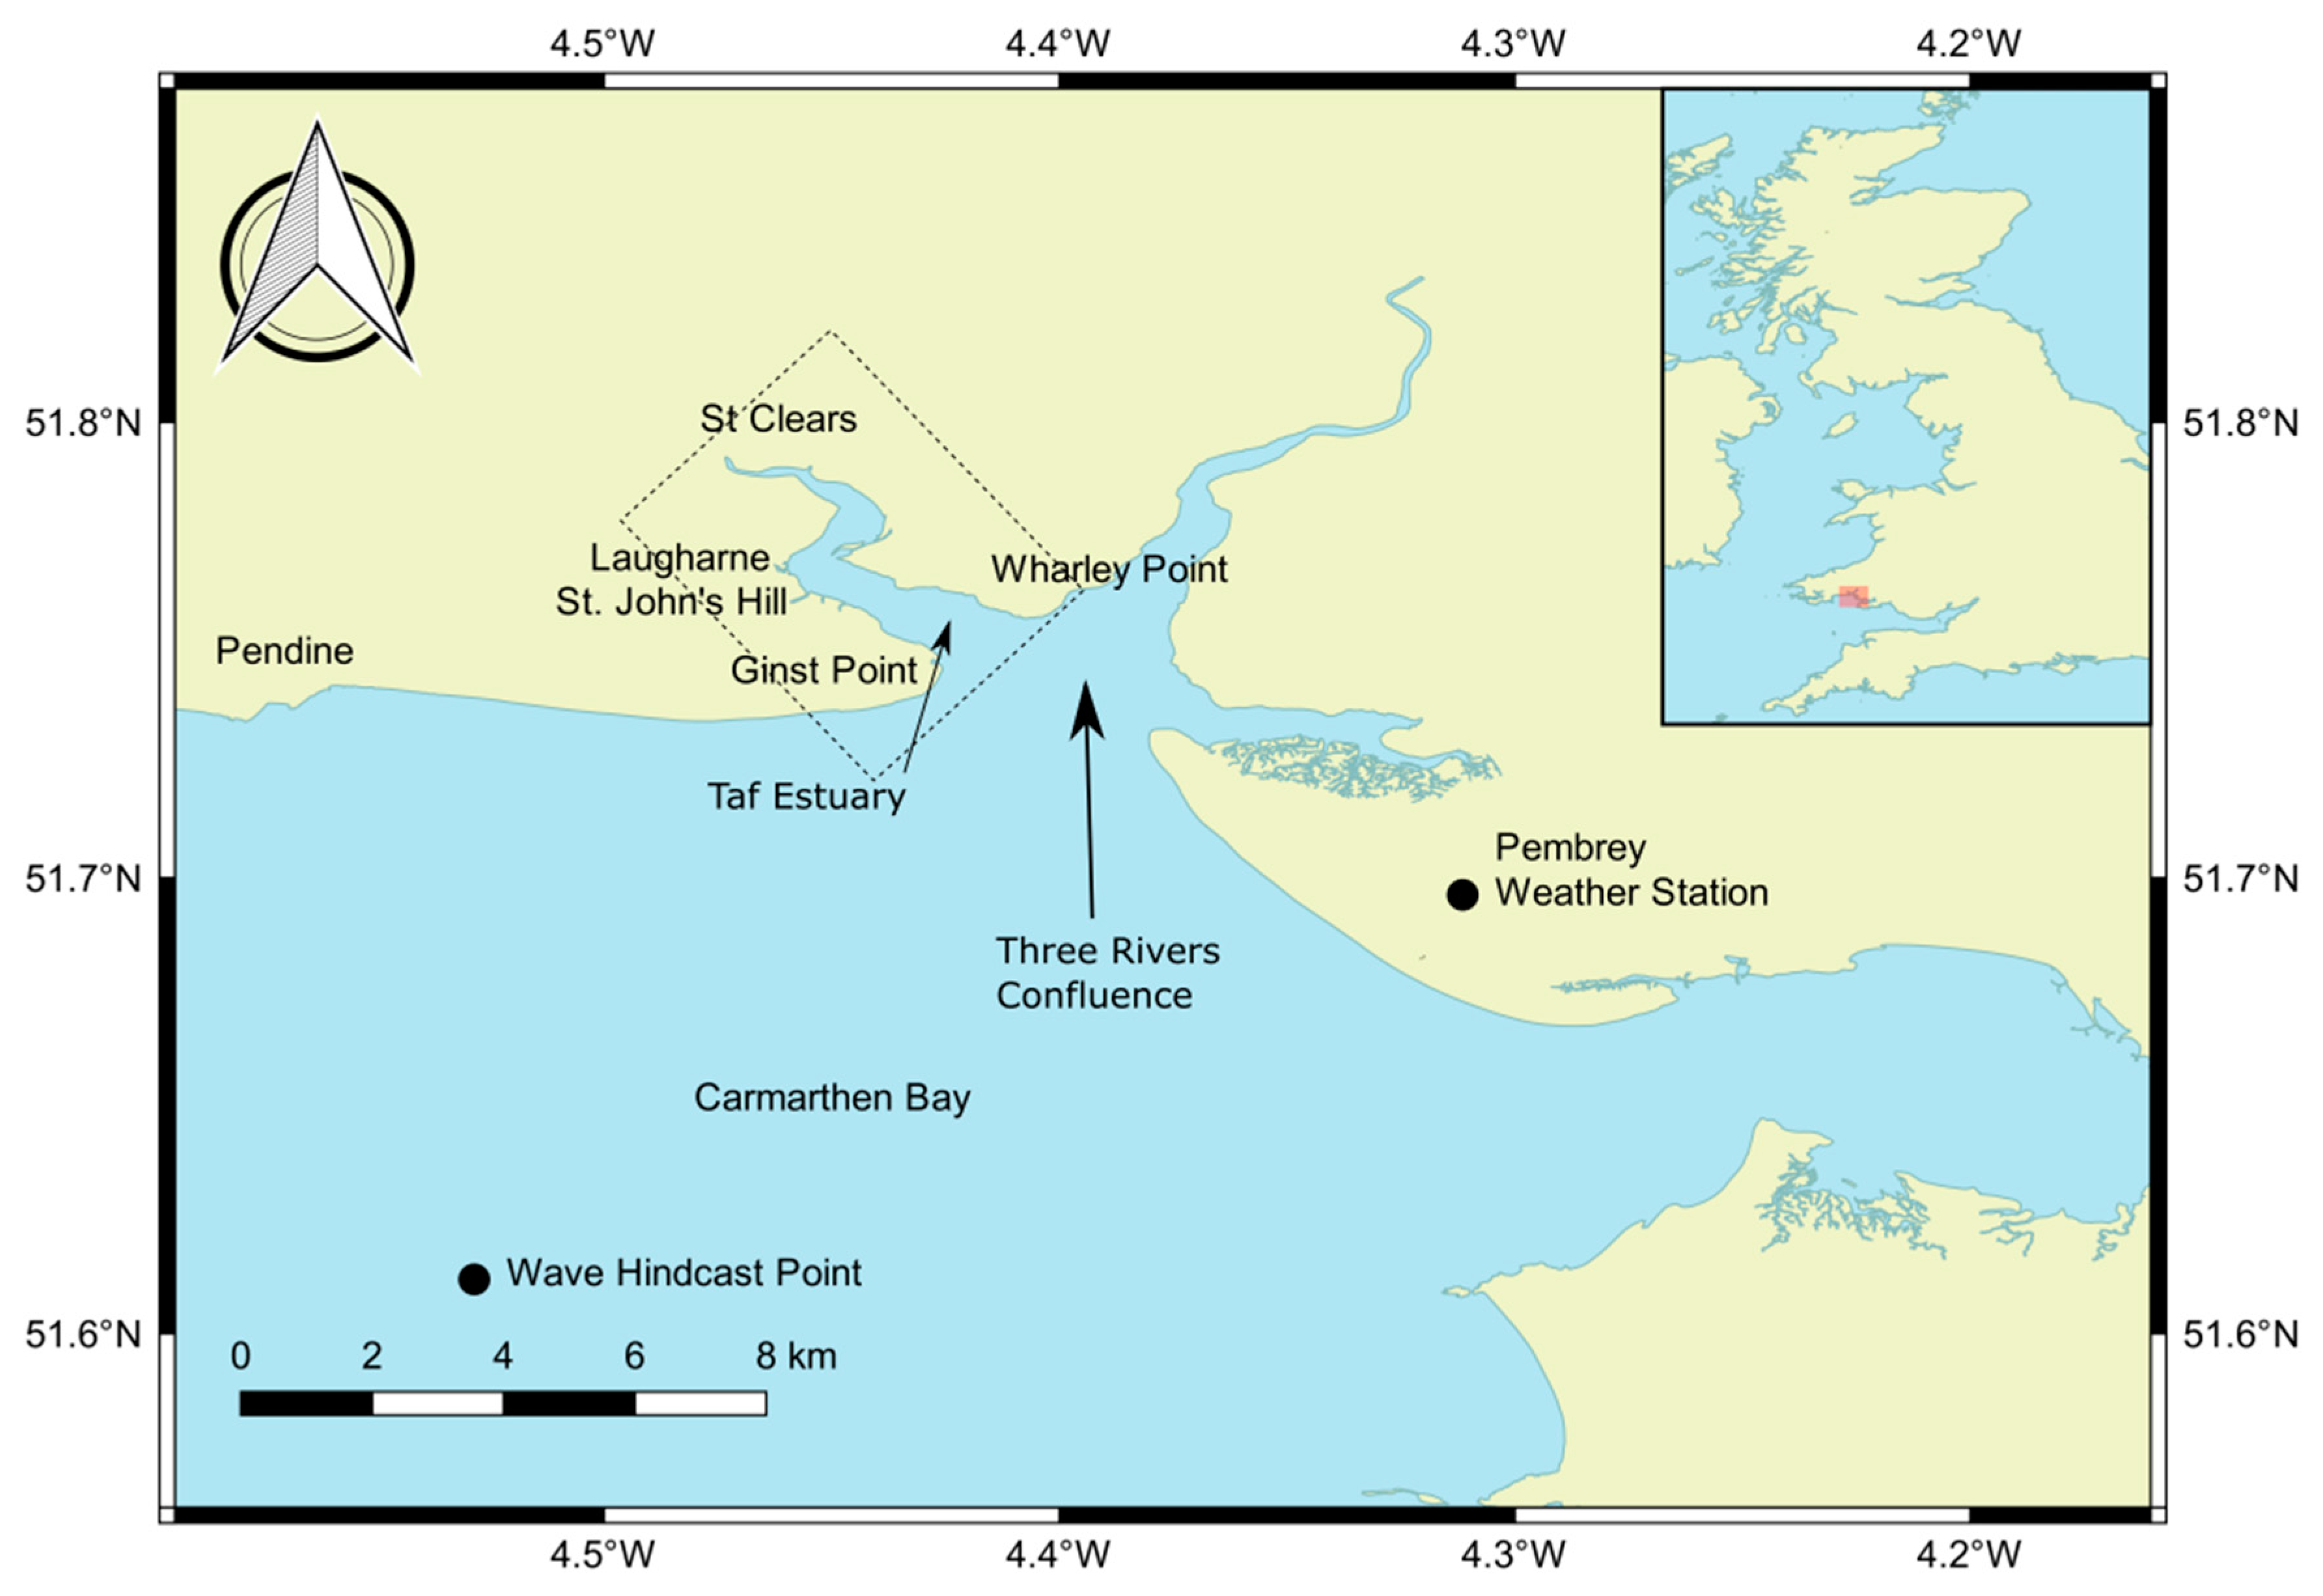
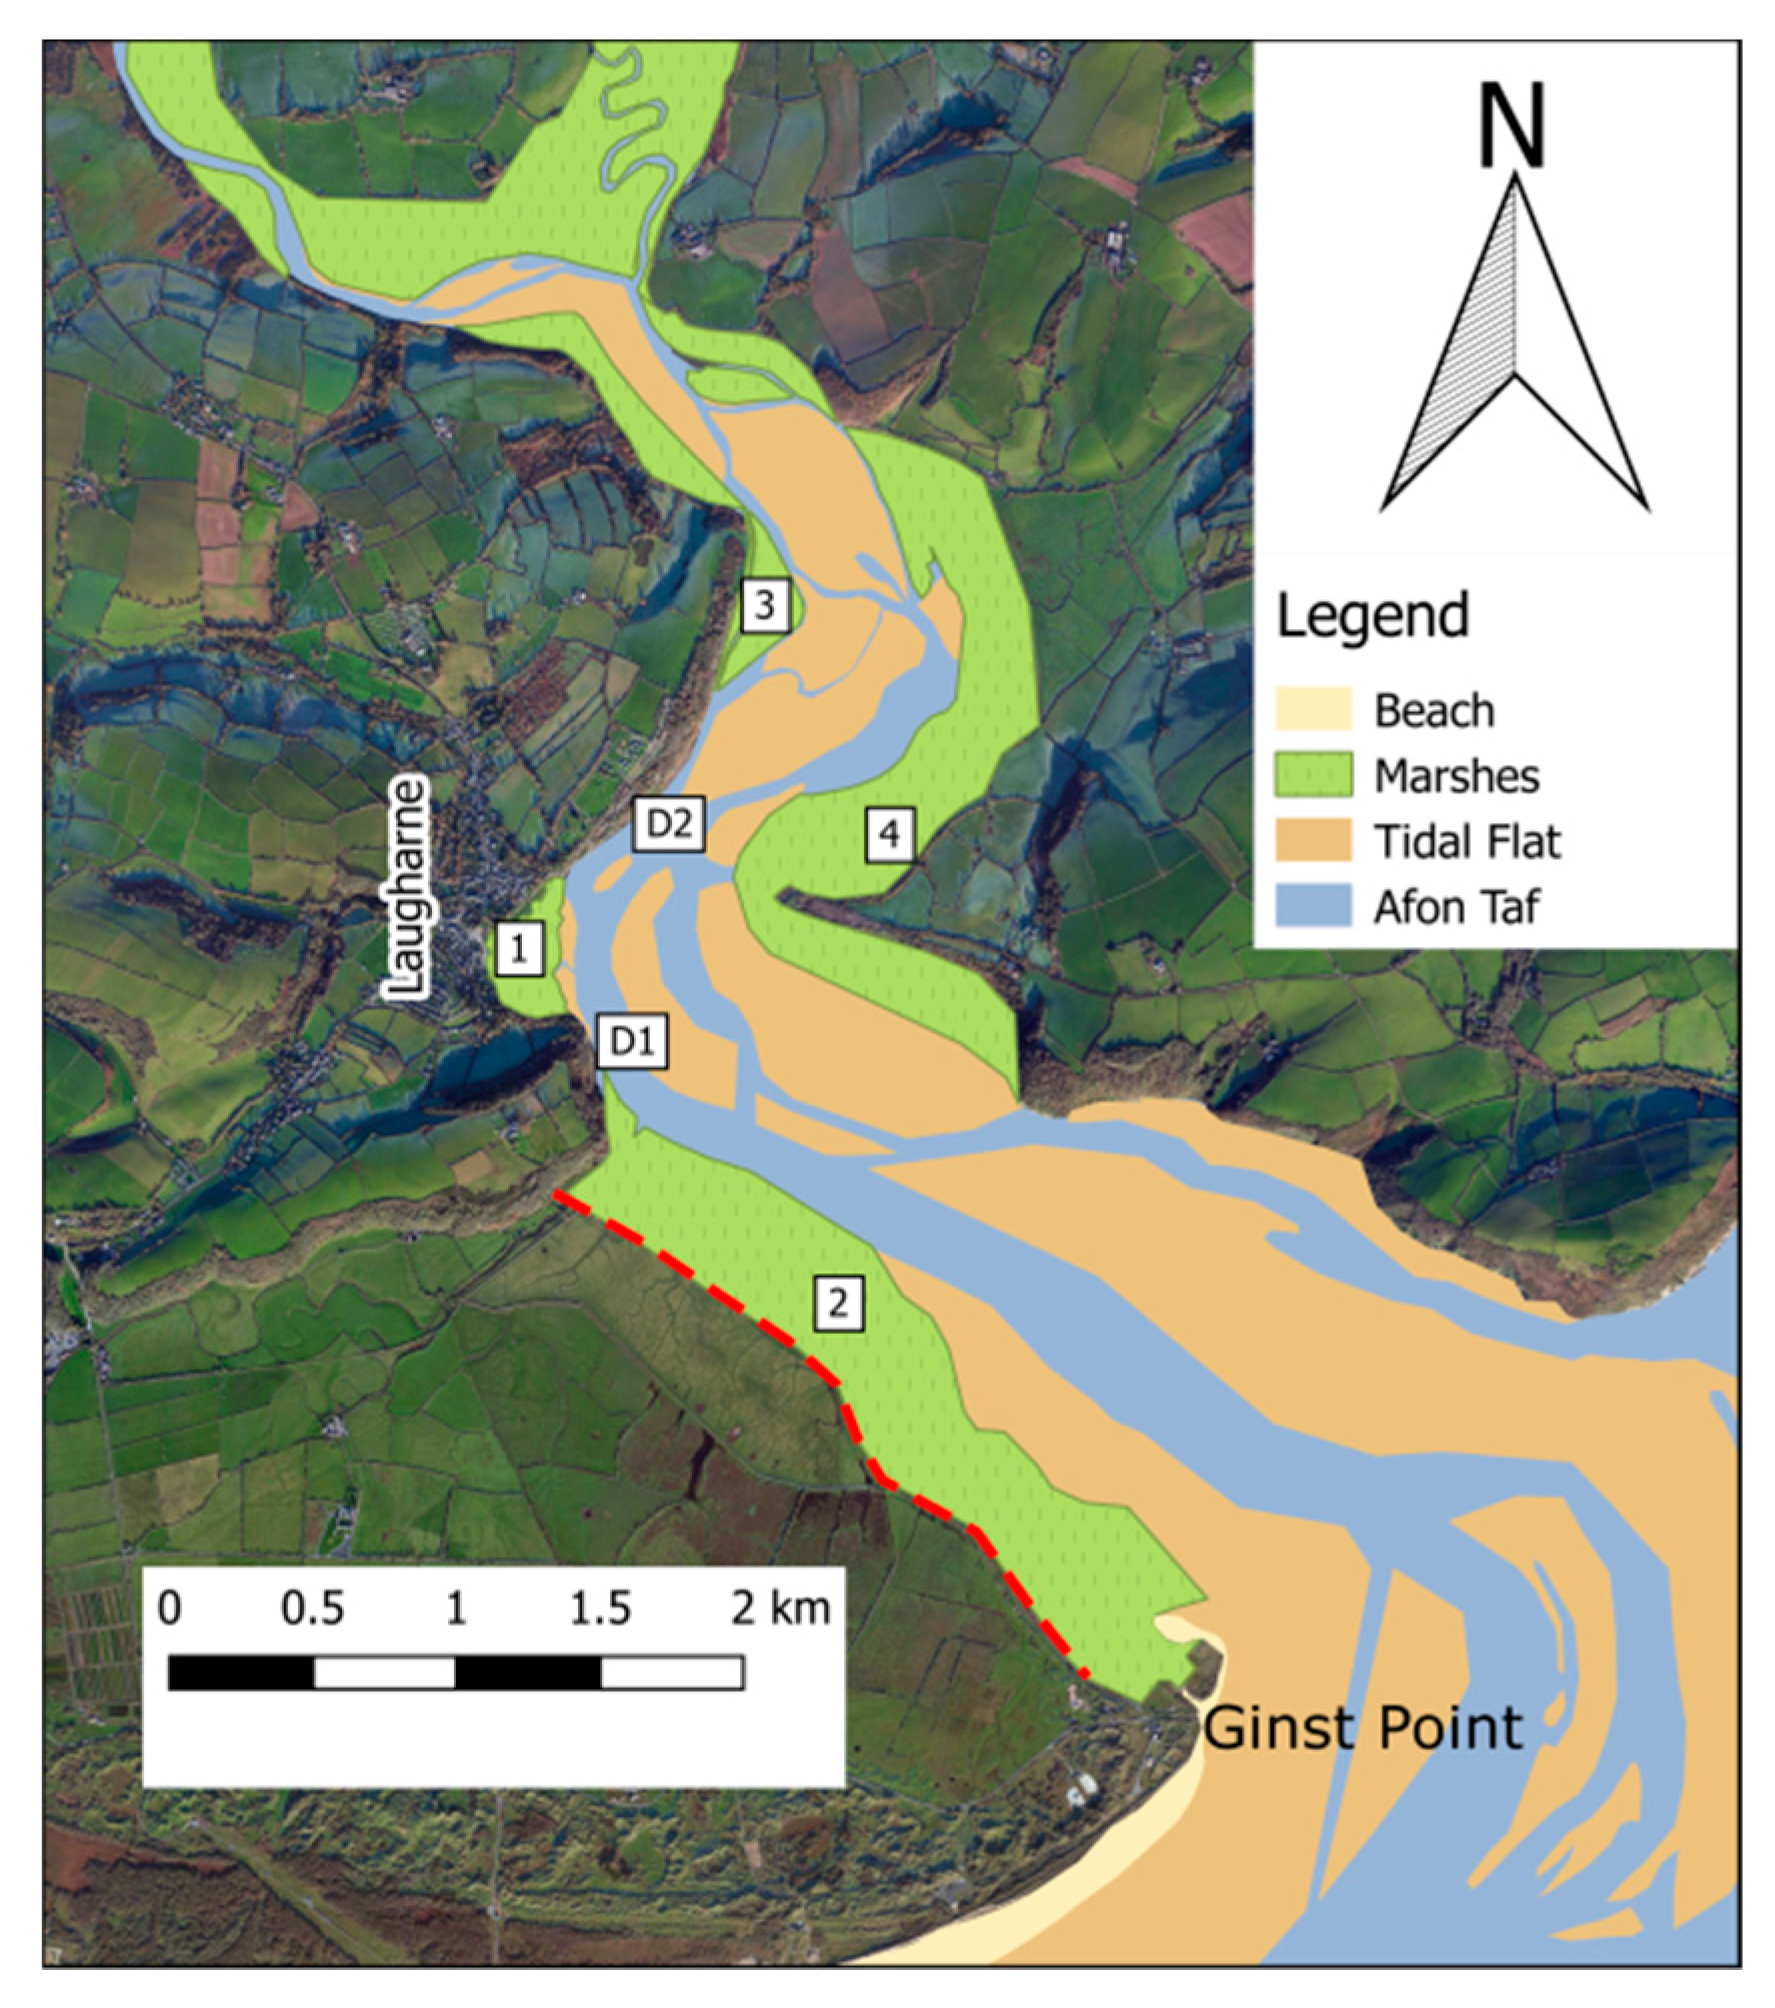
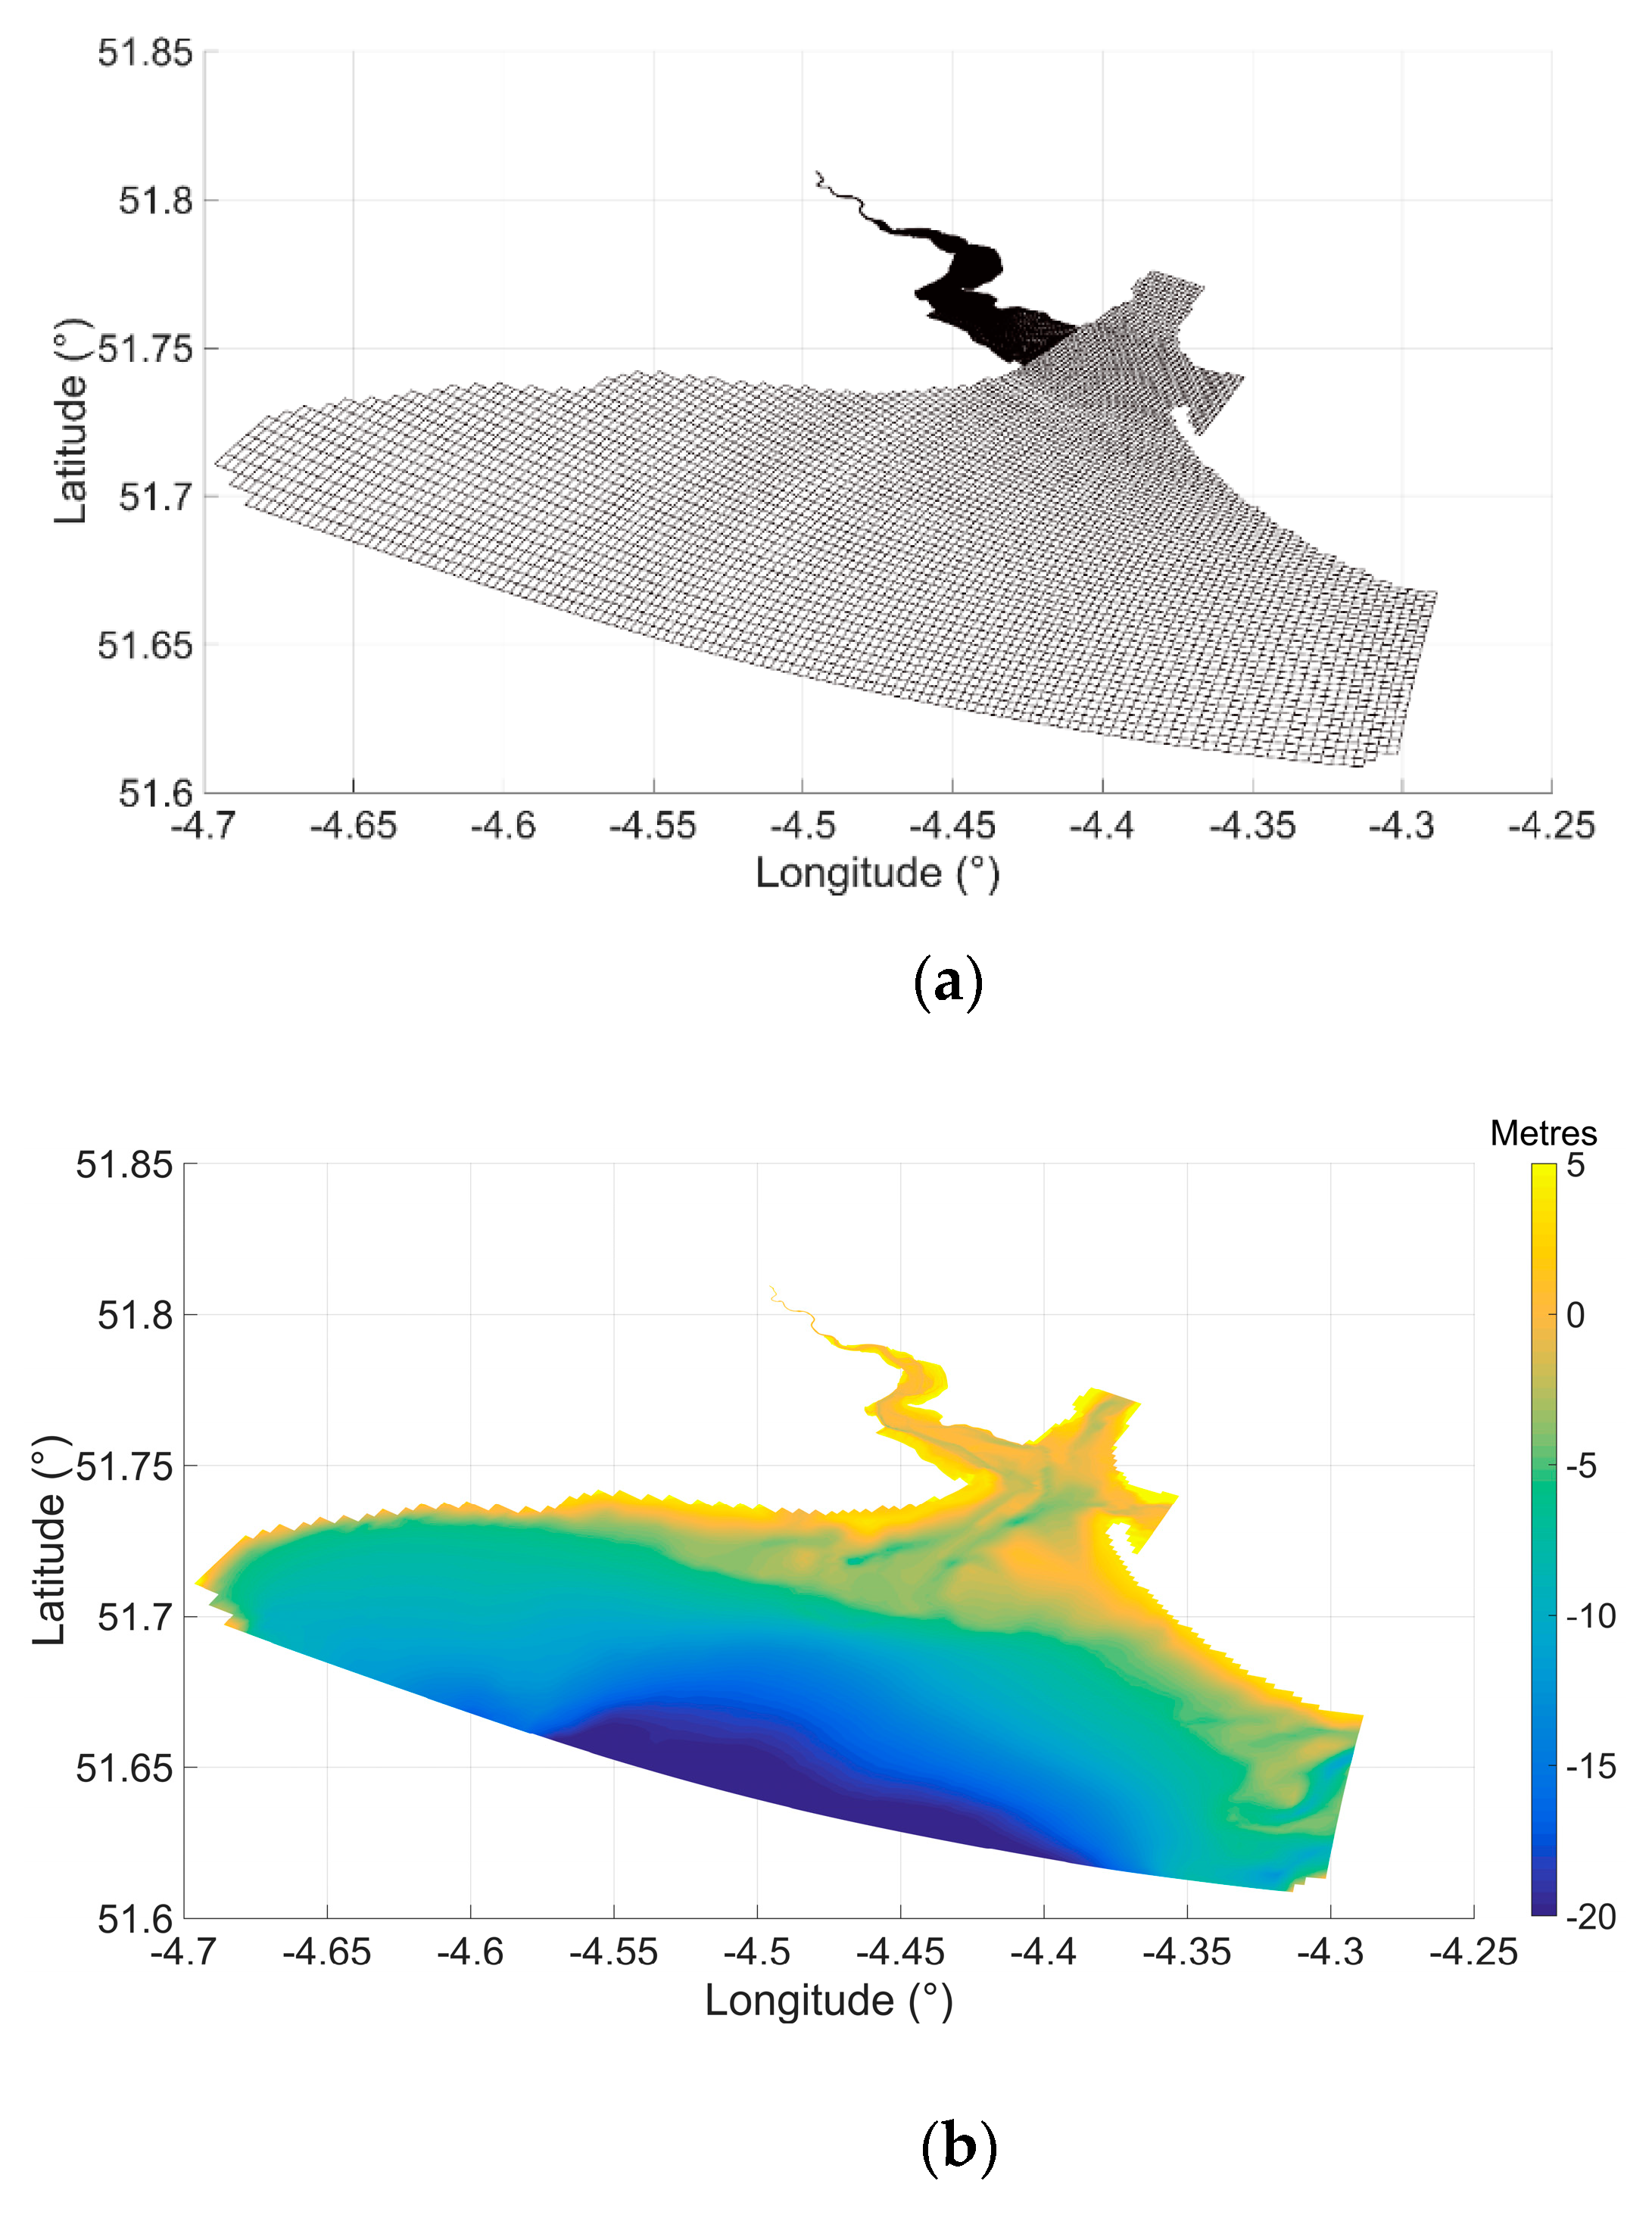
2. Taf Estuary
3. Methodology
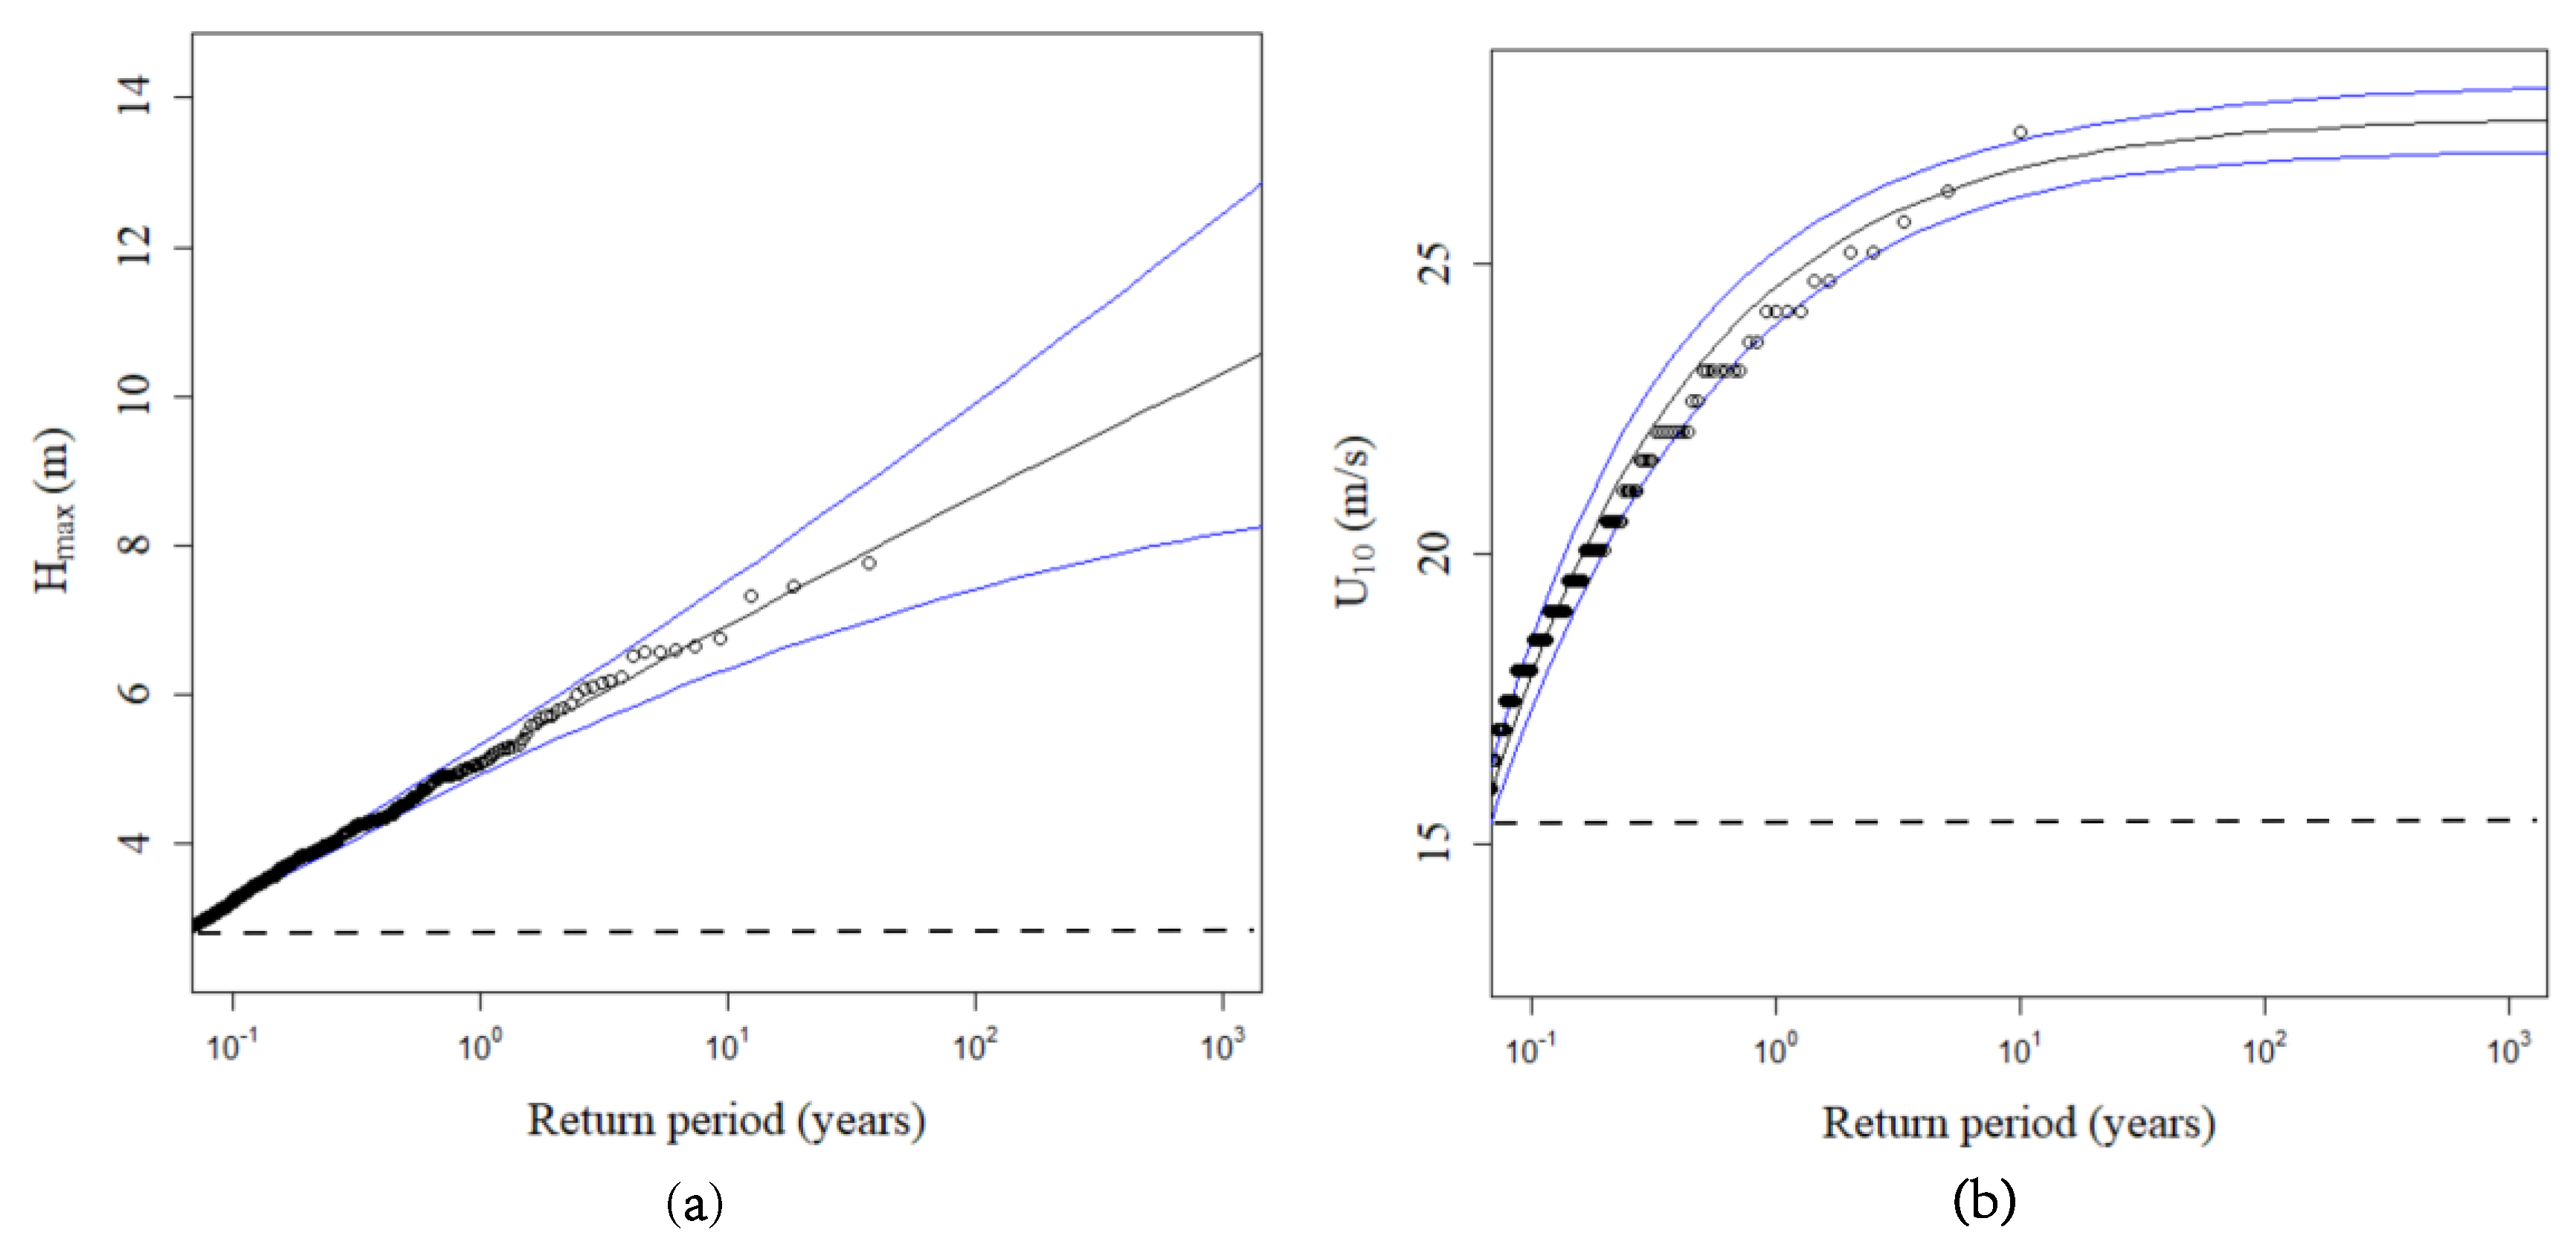
3.1. Storm Boundary Conditions
3.1.1. Waves
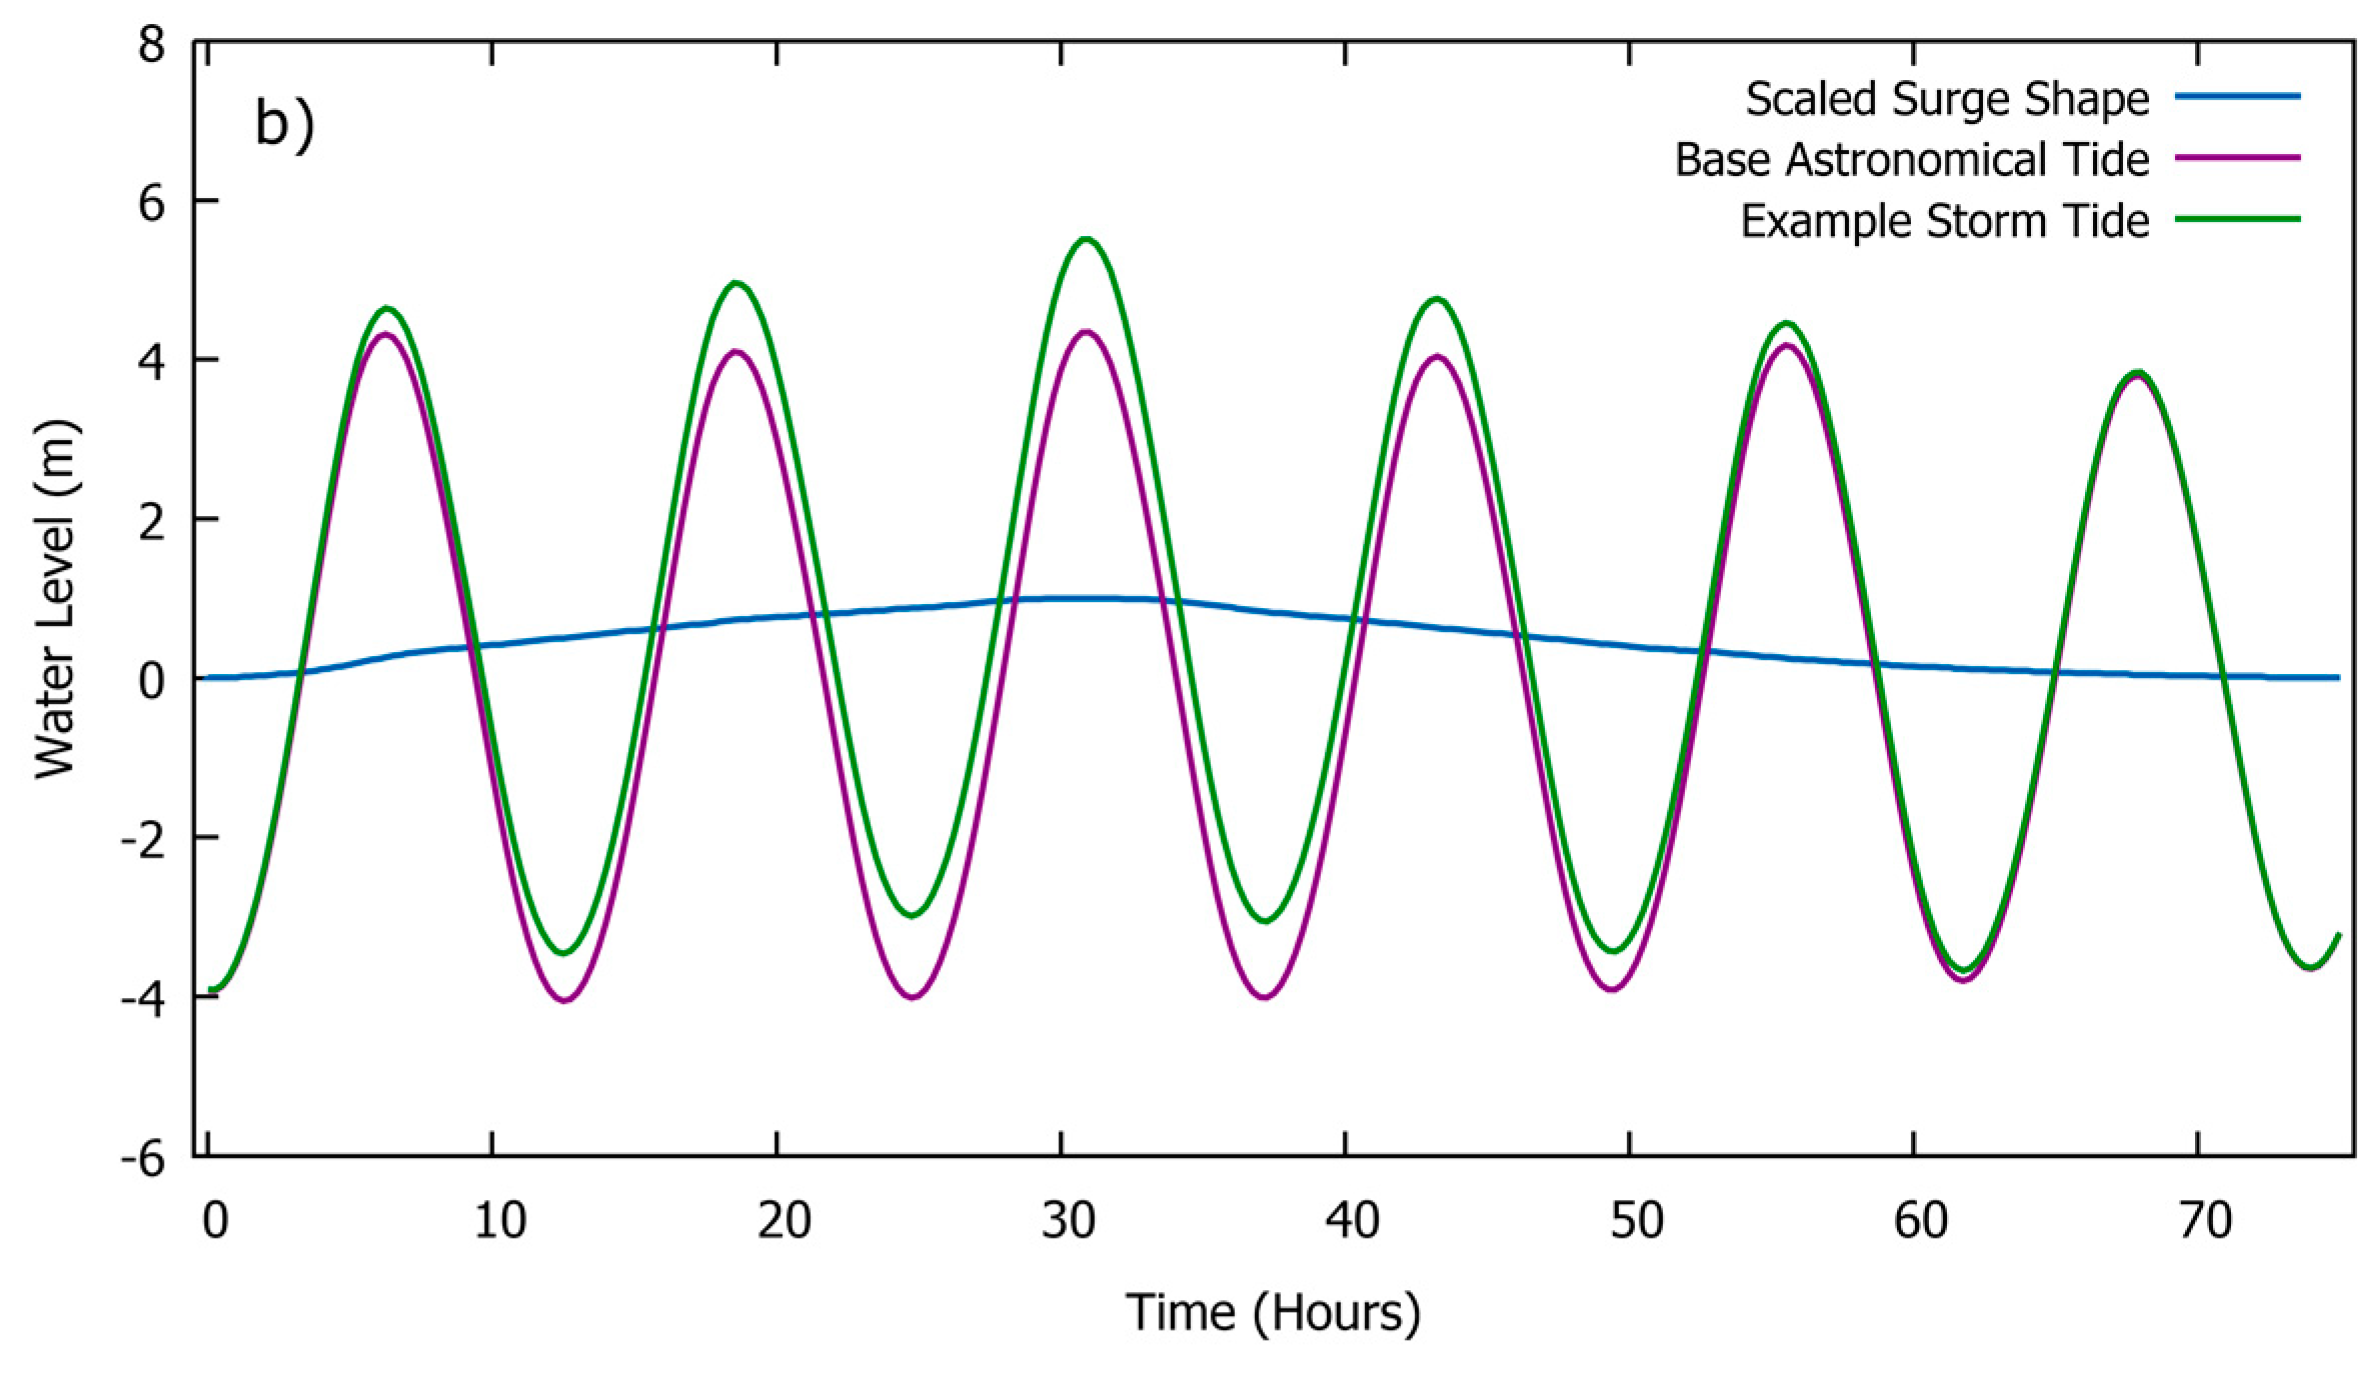
3.1.2. Water Levels
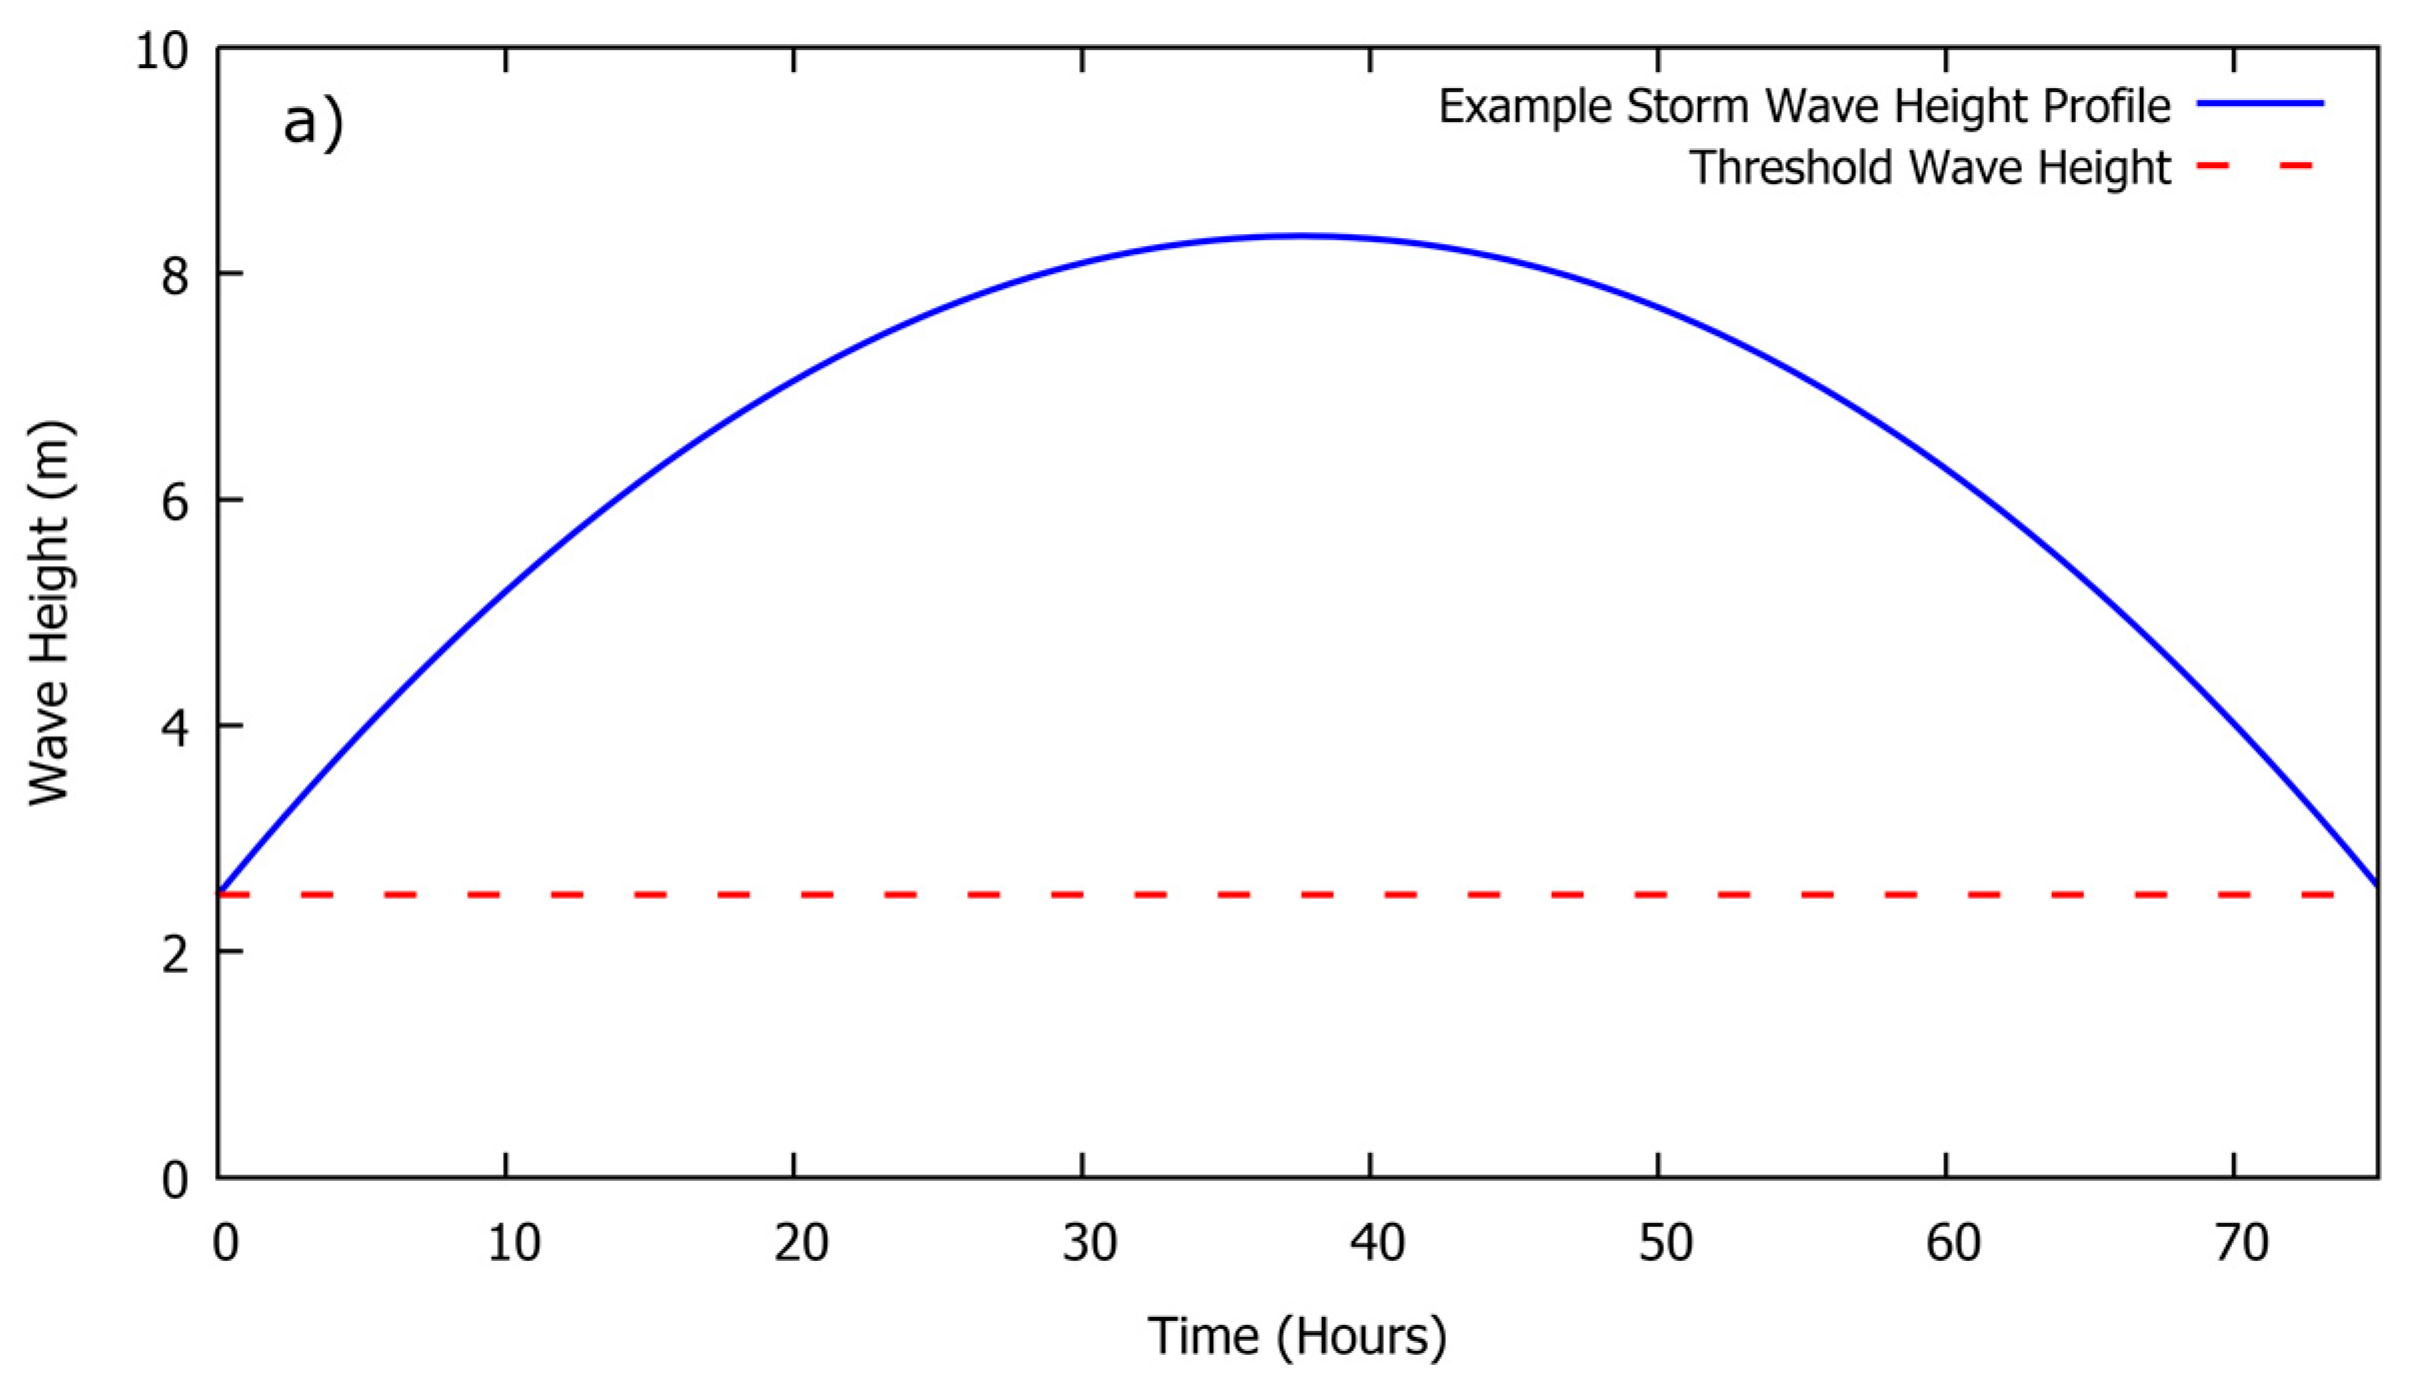
3.1.3. Storm Conditions
3.2. Modelling Approach
3.3. Vegetation Module
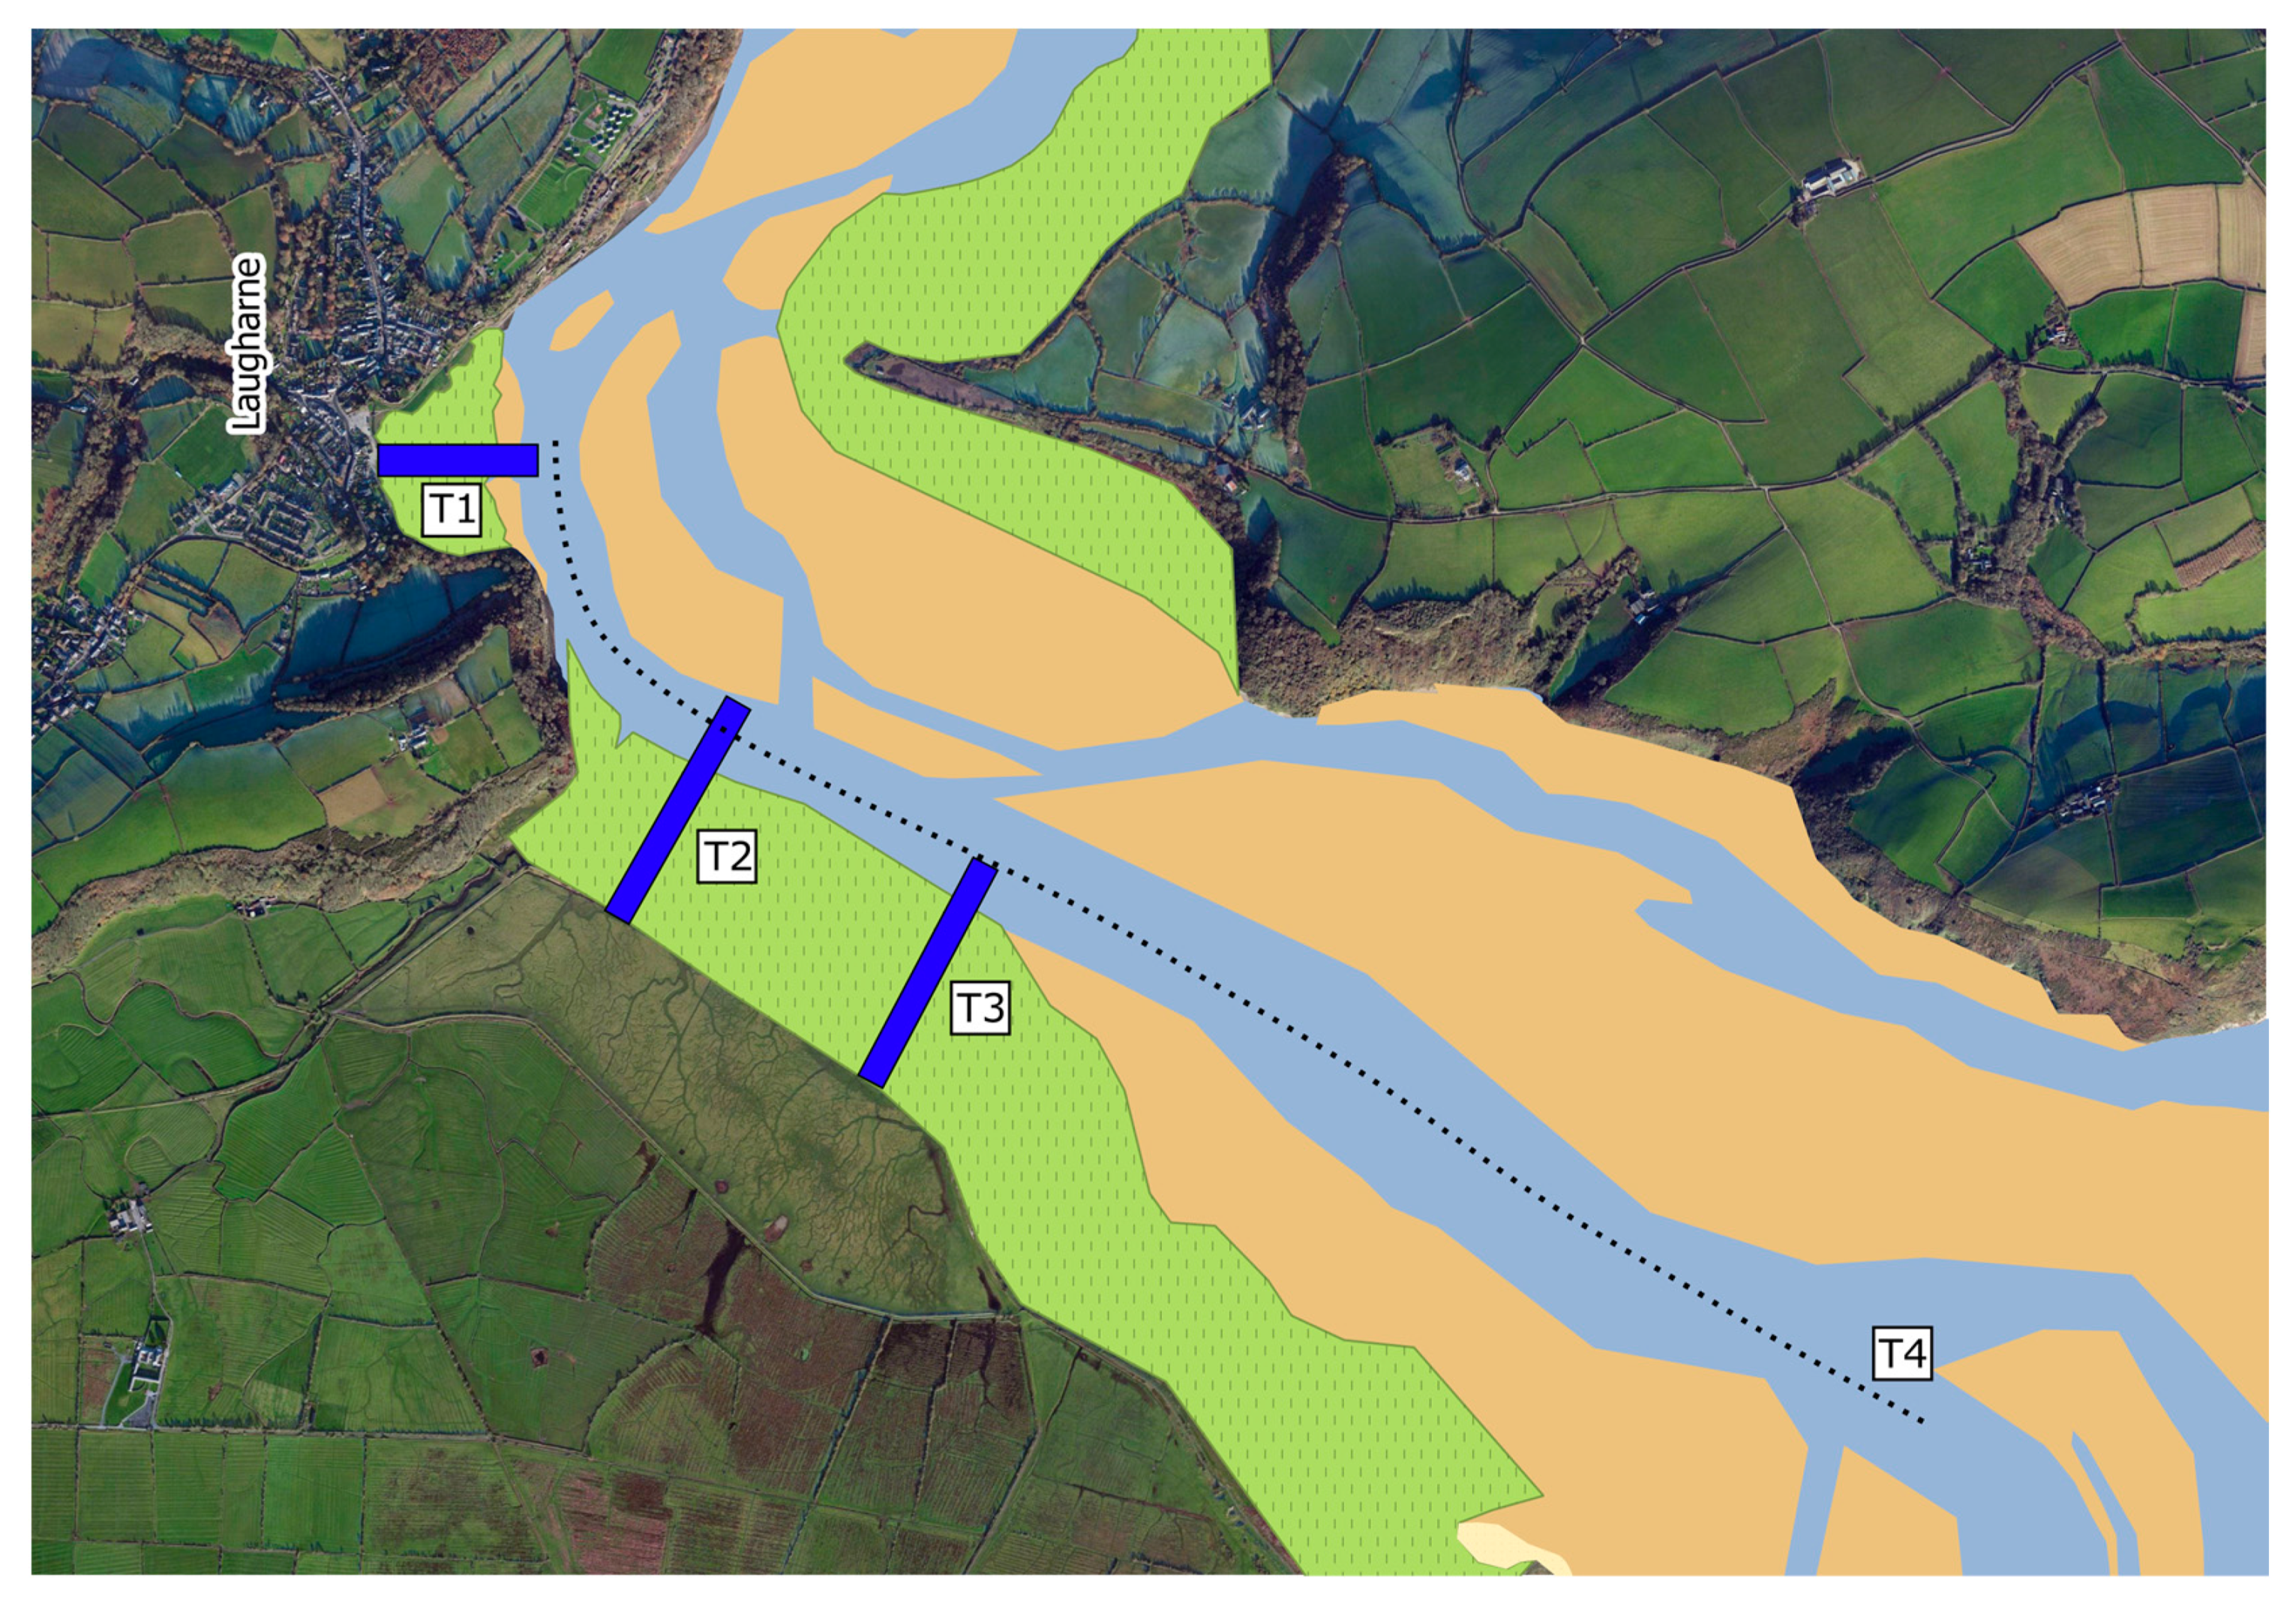
3.4. Model Validation
3.4.1. Validation of Water Depth
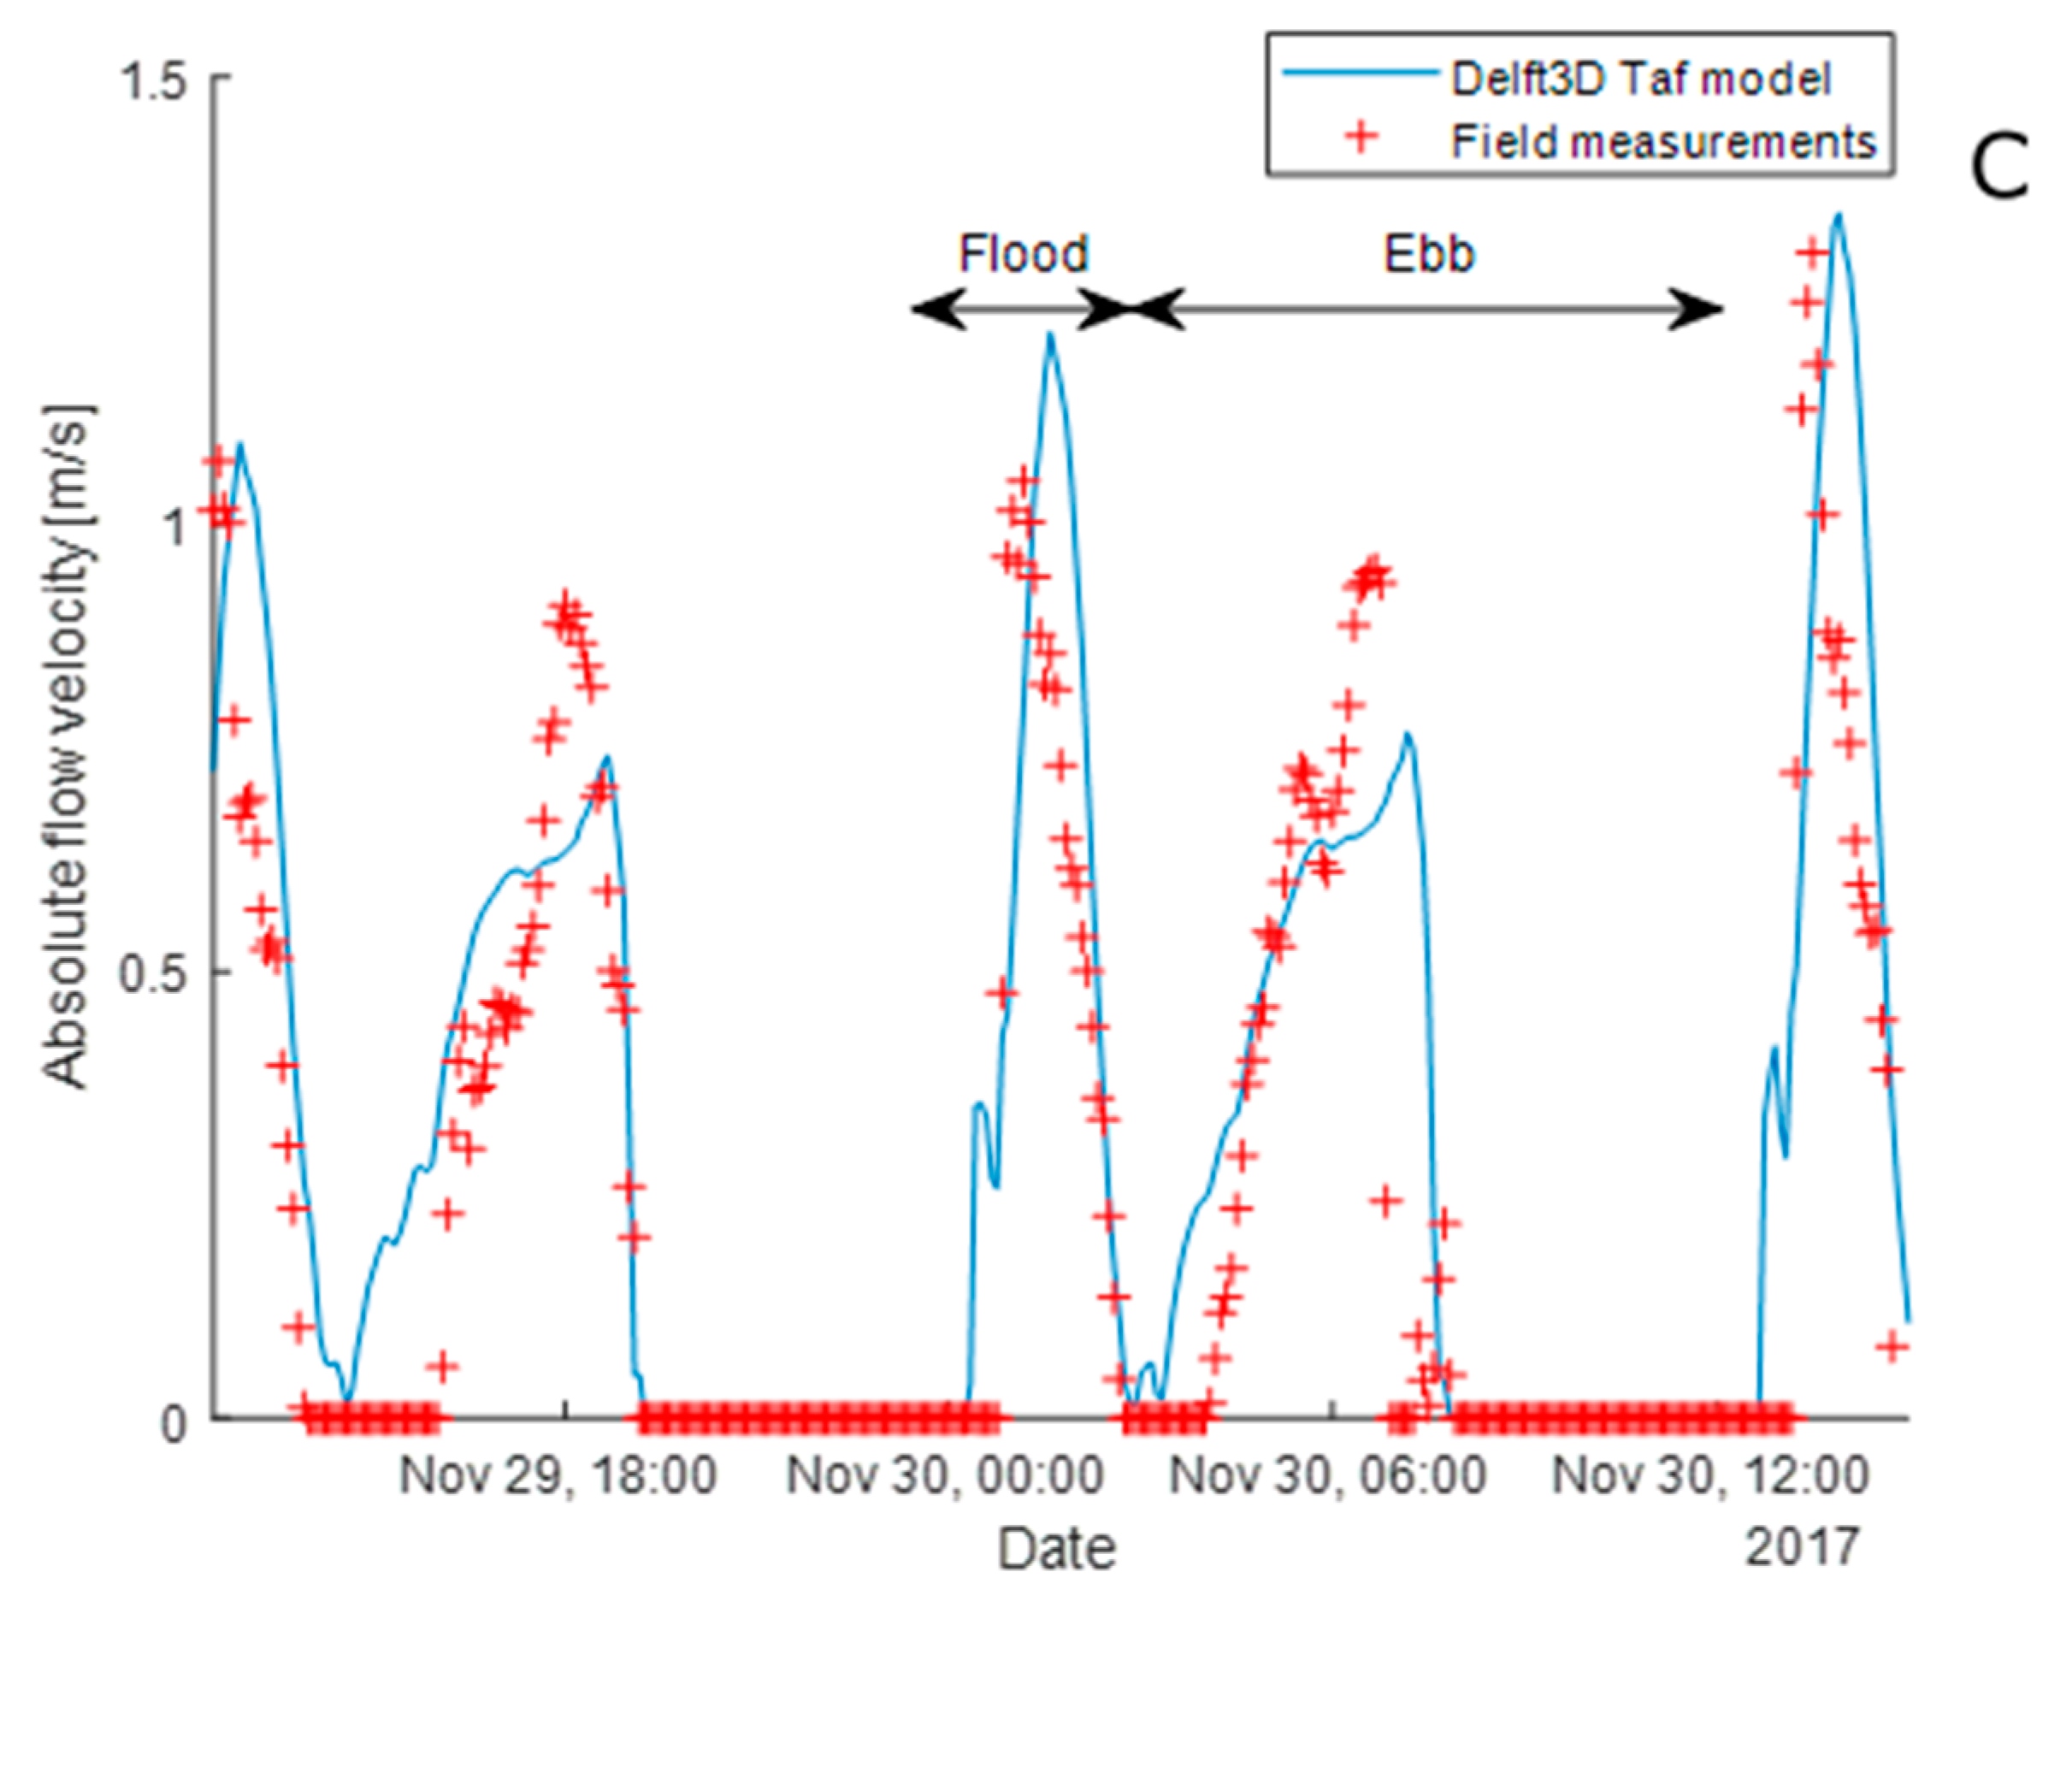
3.4.2. Validation of Flow Velocity
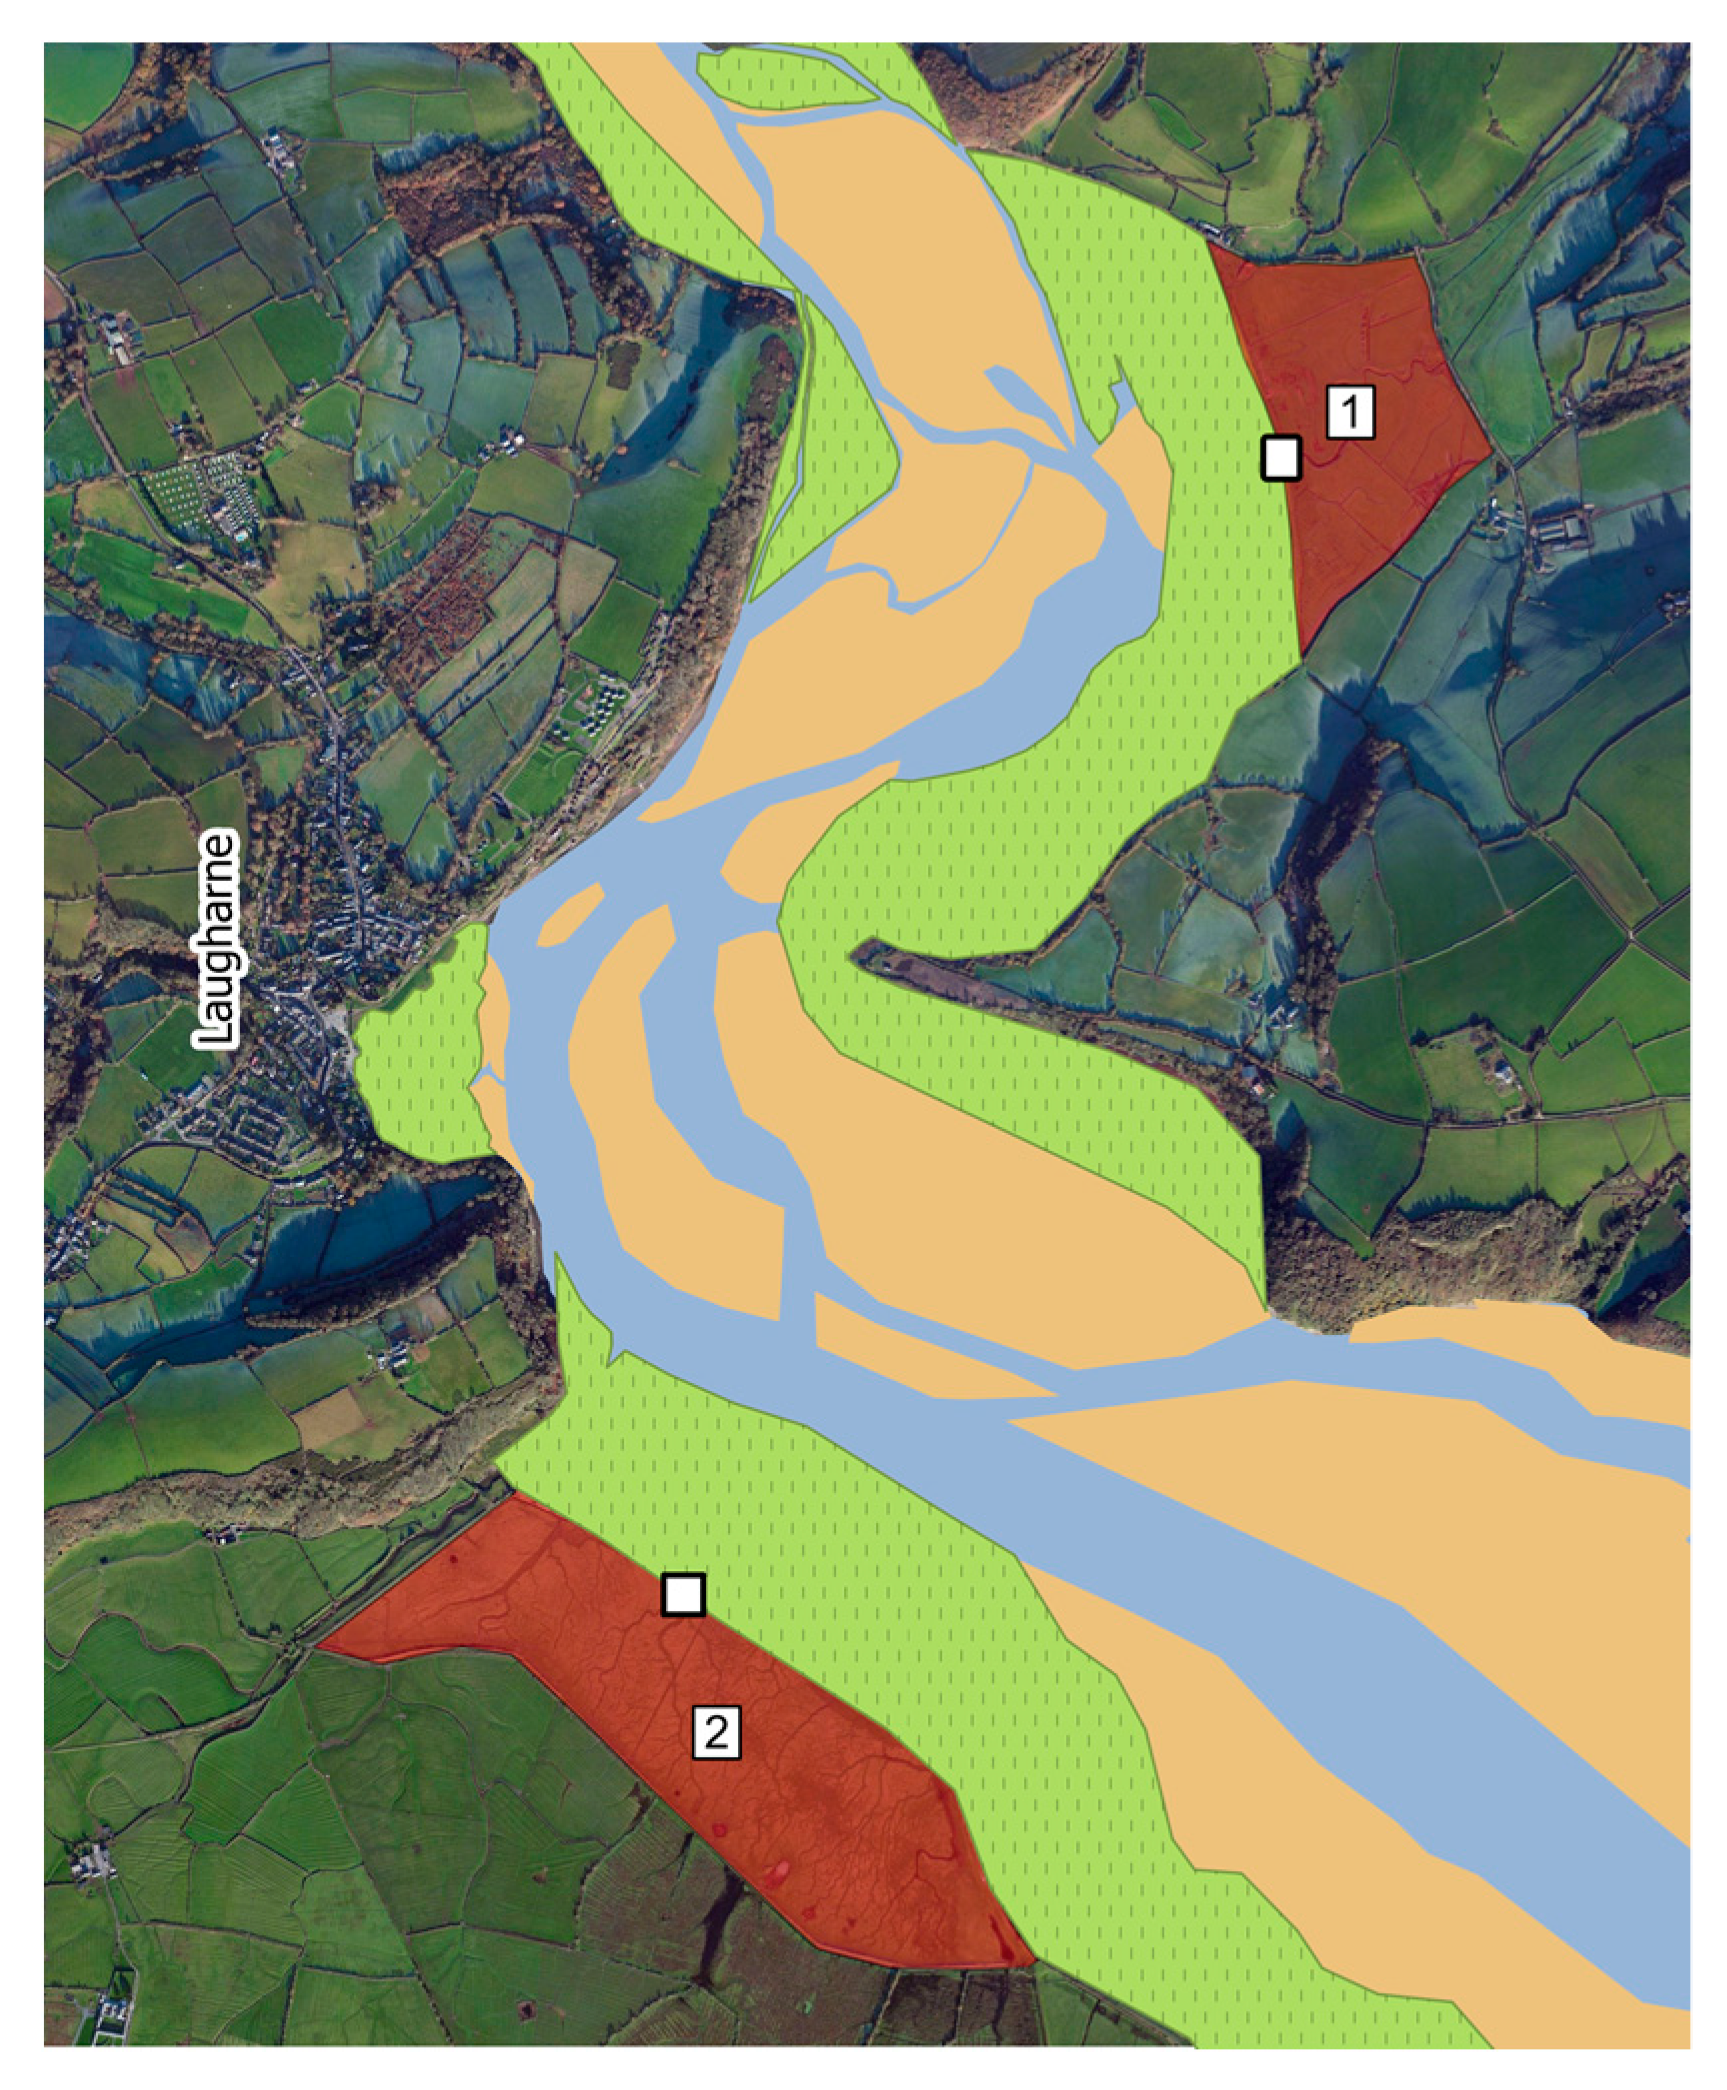
3.5. Implementation of Coastal Management Interventions
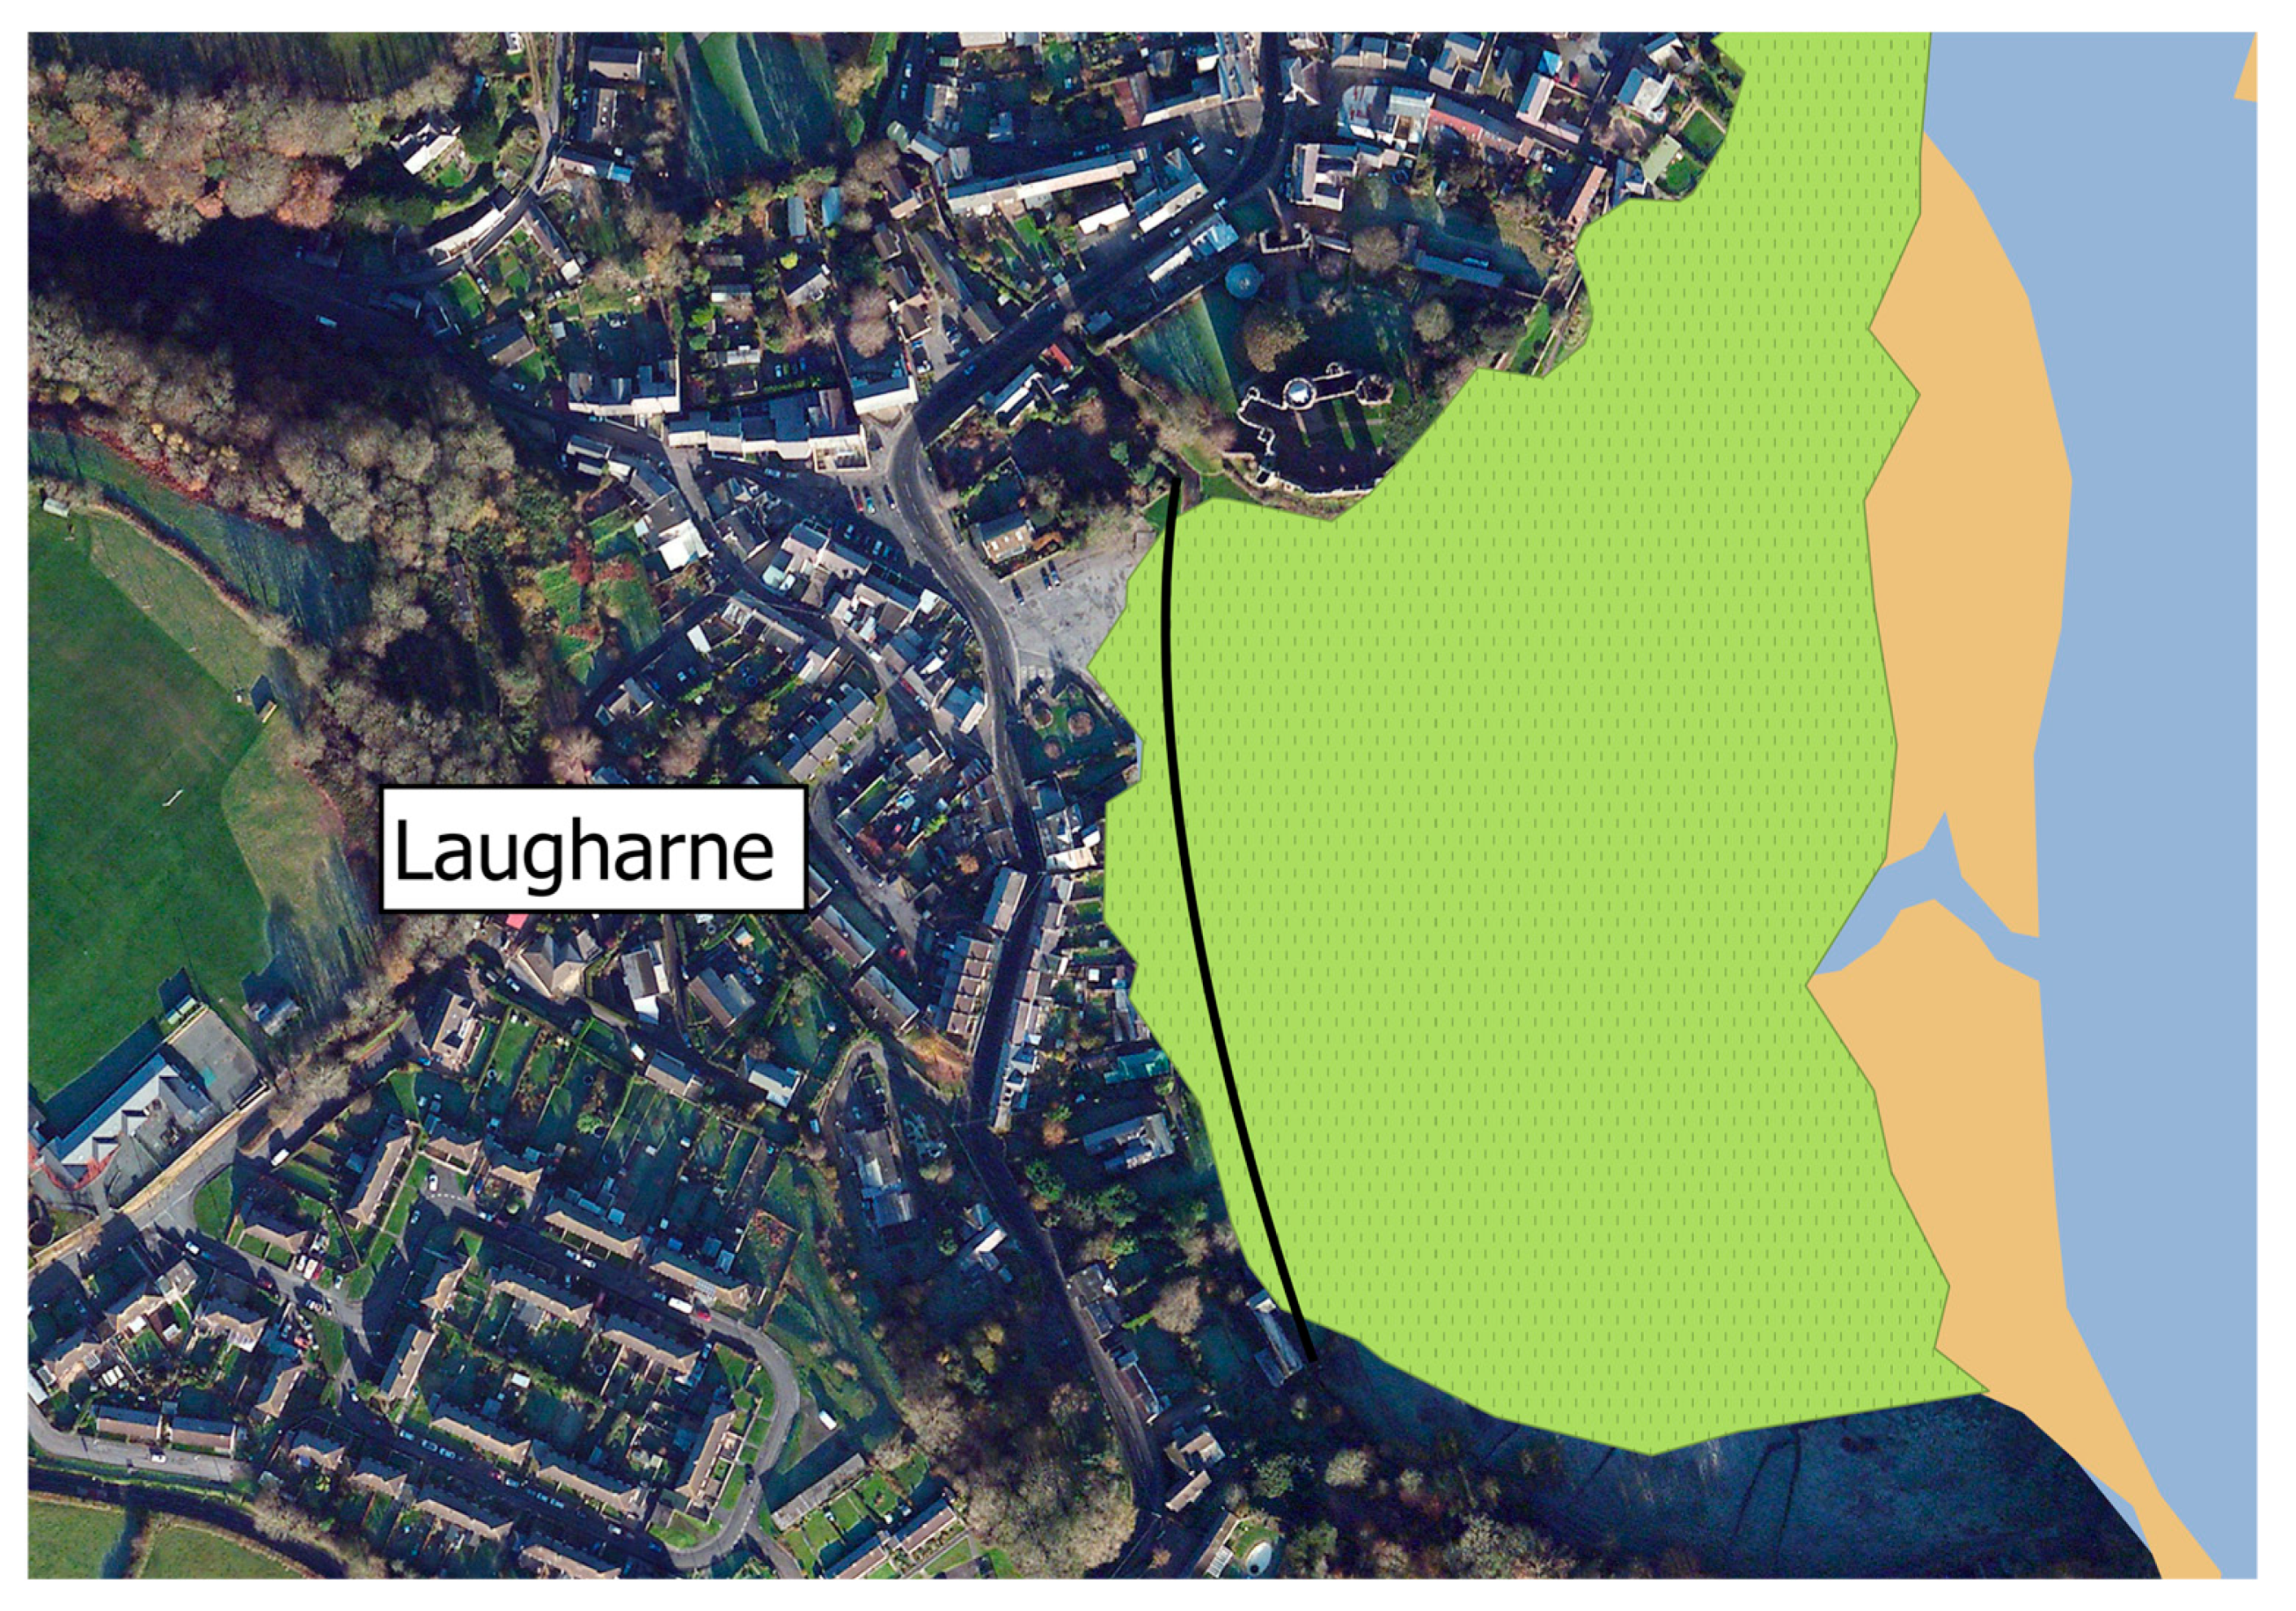
3.5.1. Managed Realignment
3.5.2. Grazing
3.5.3. Hard Defences
4. Results
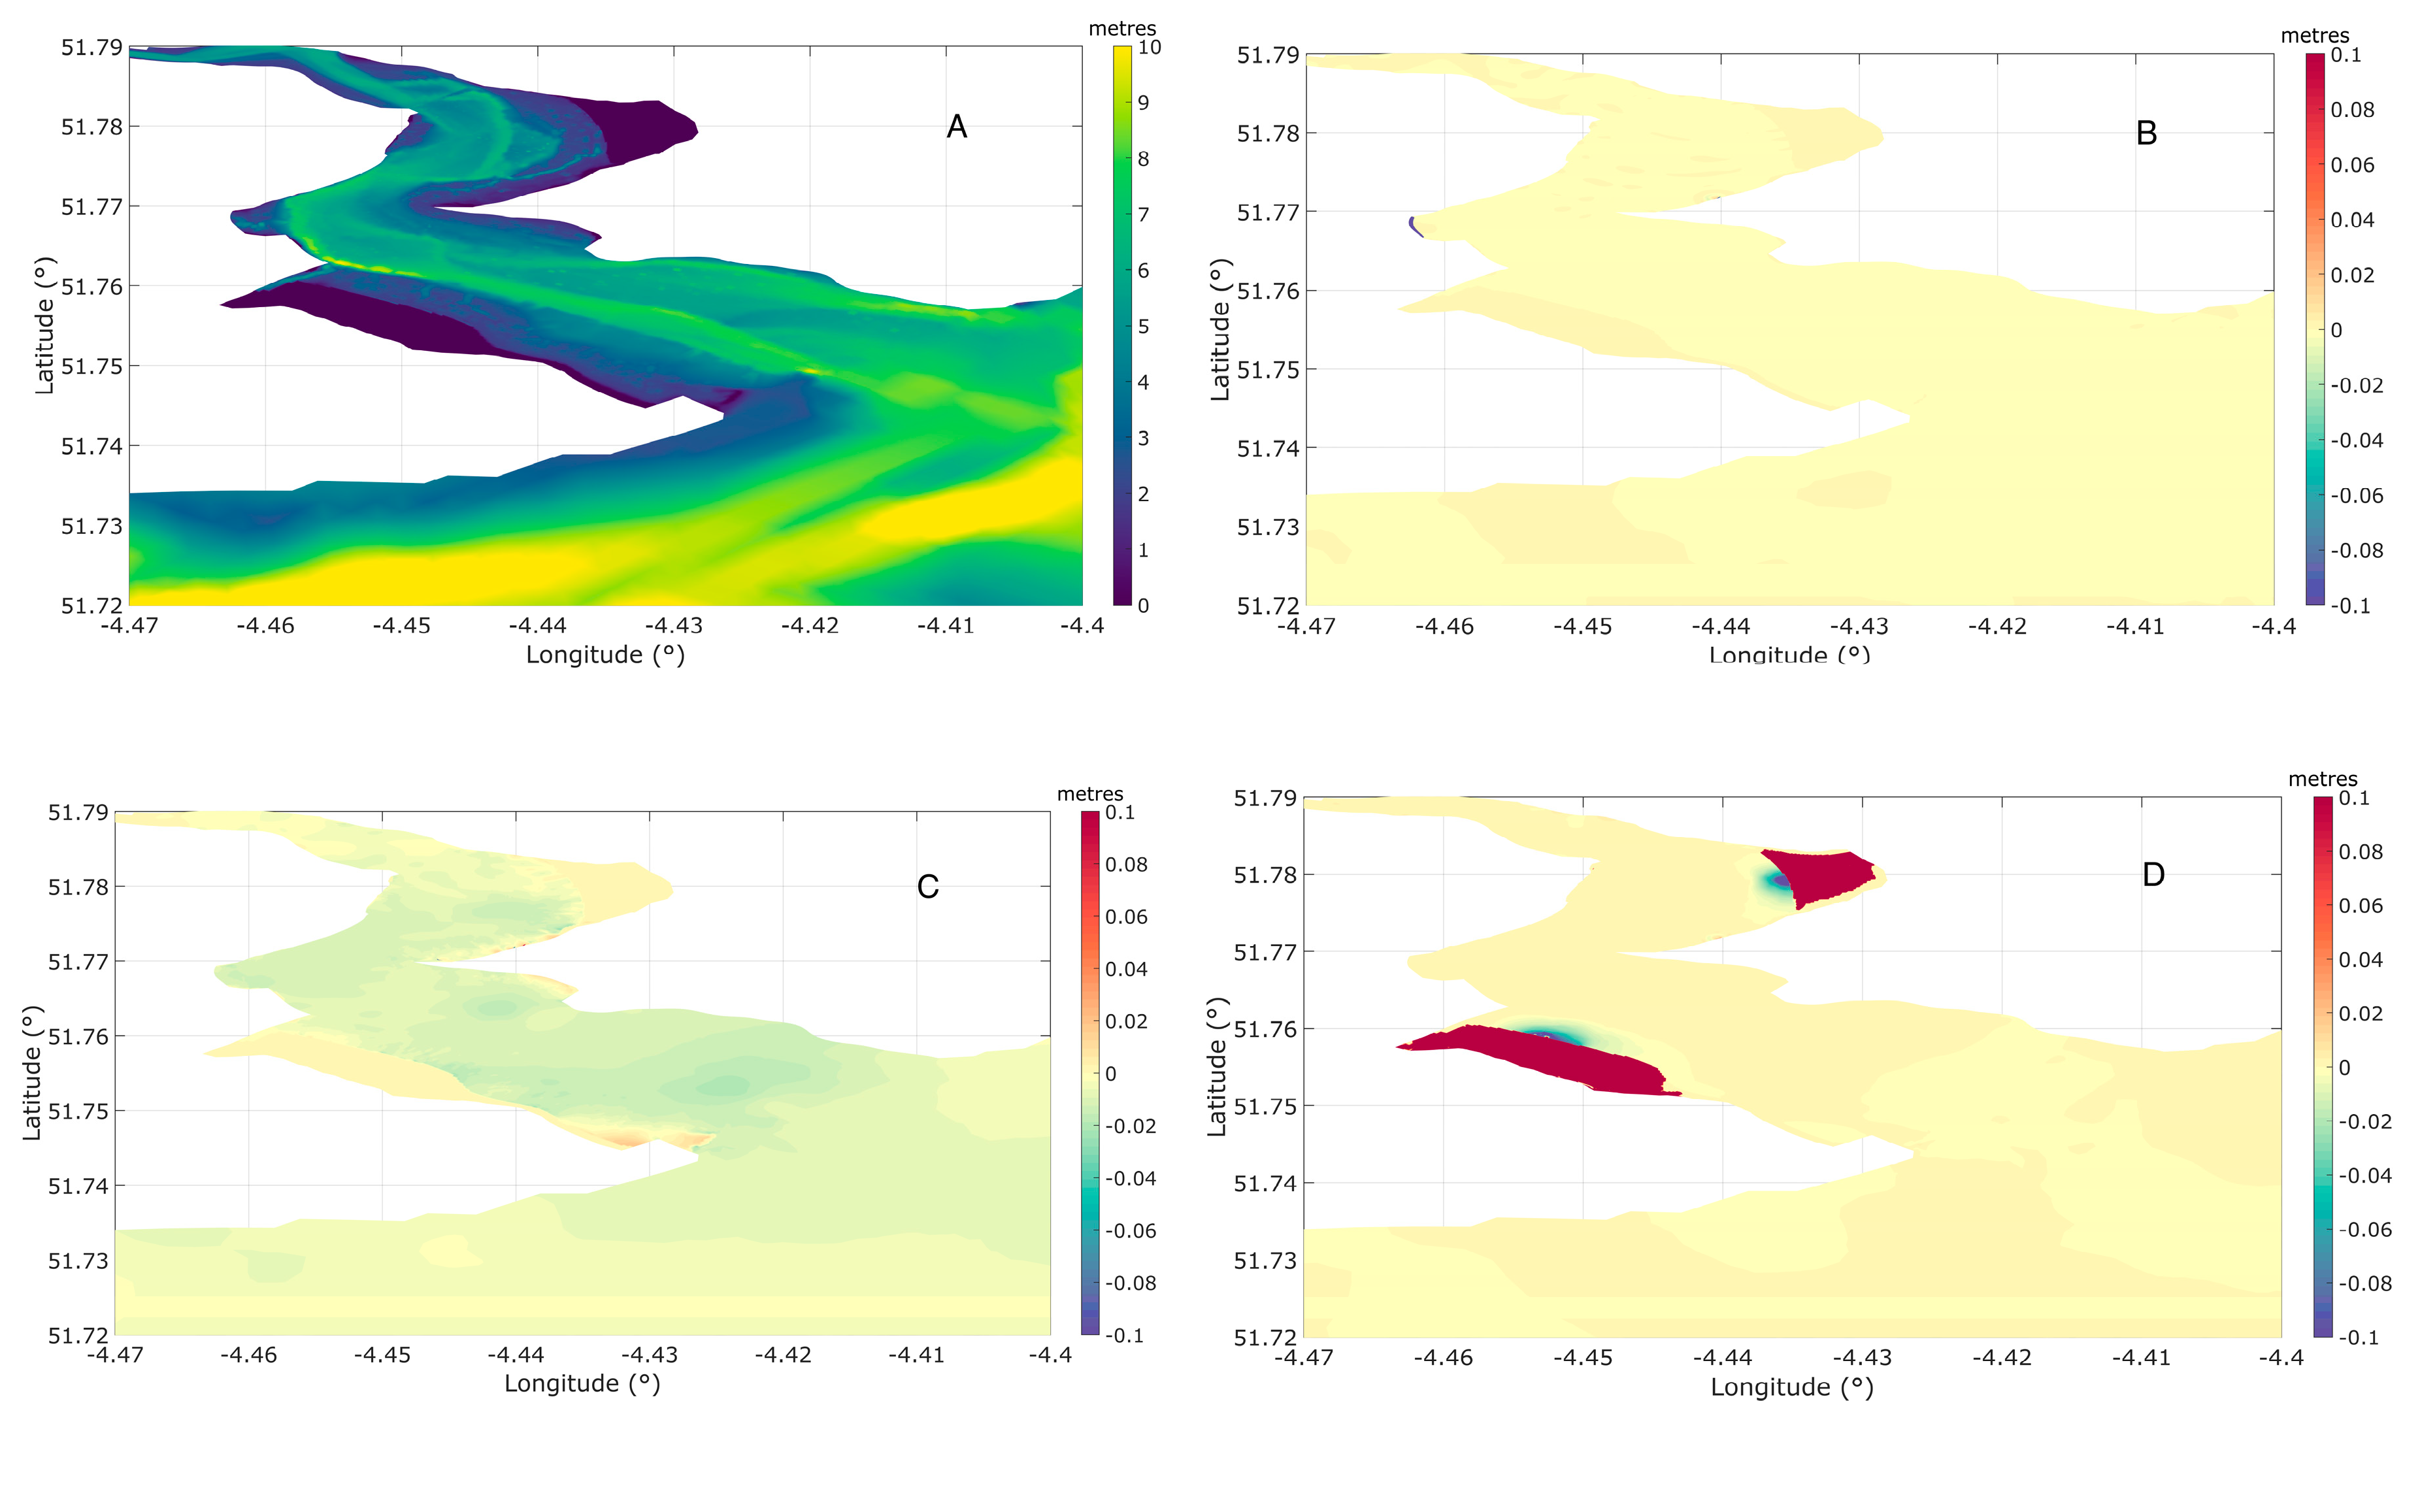
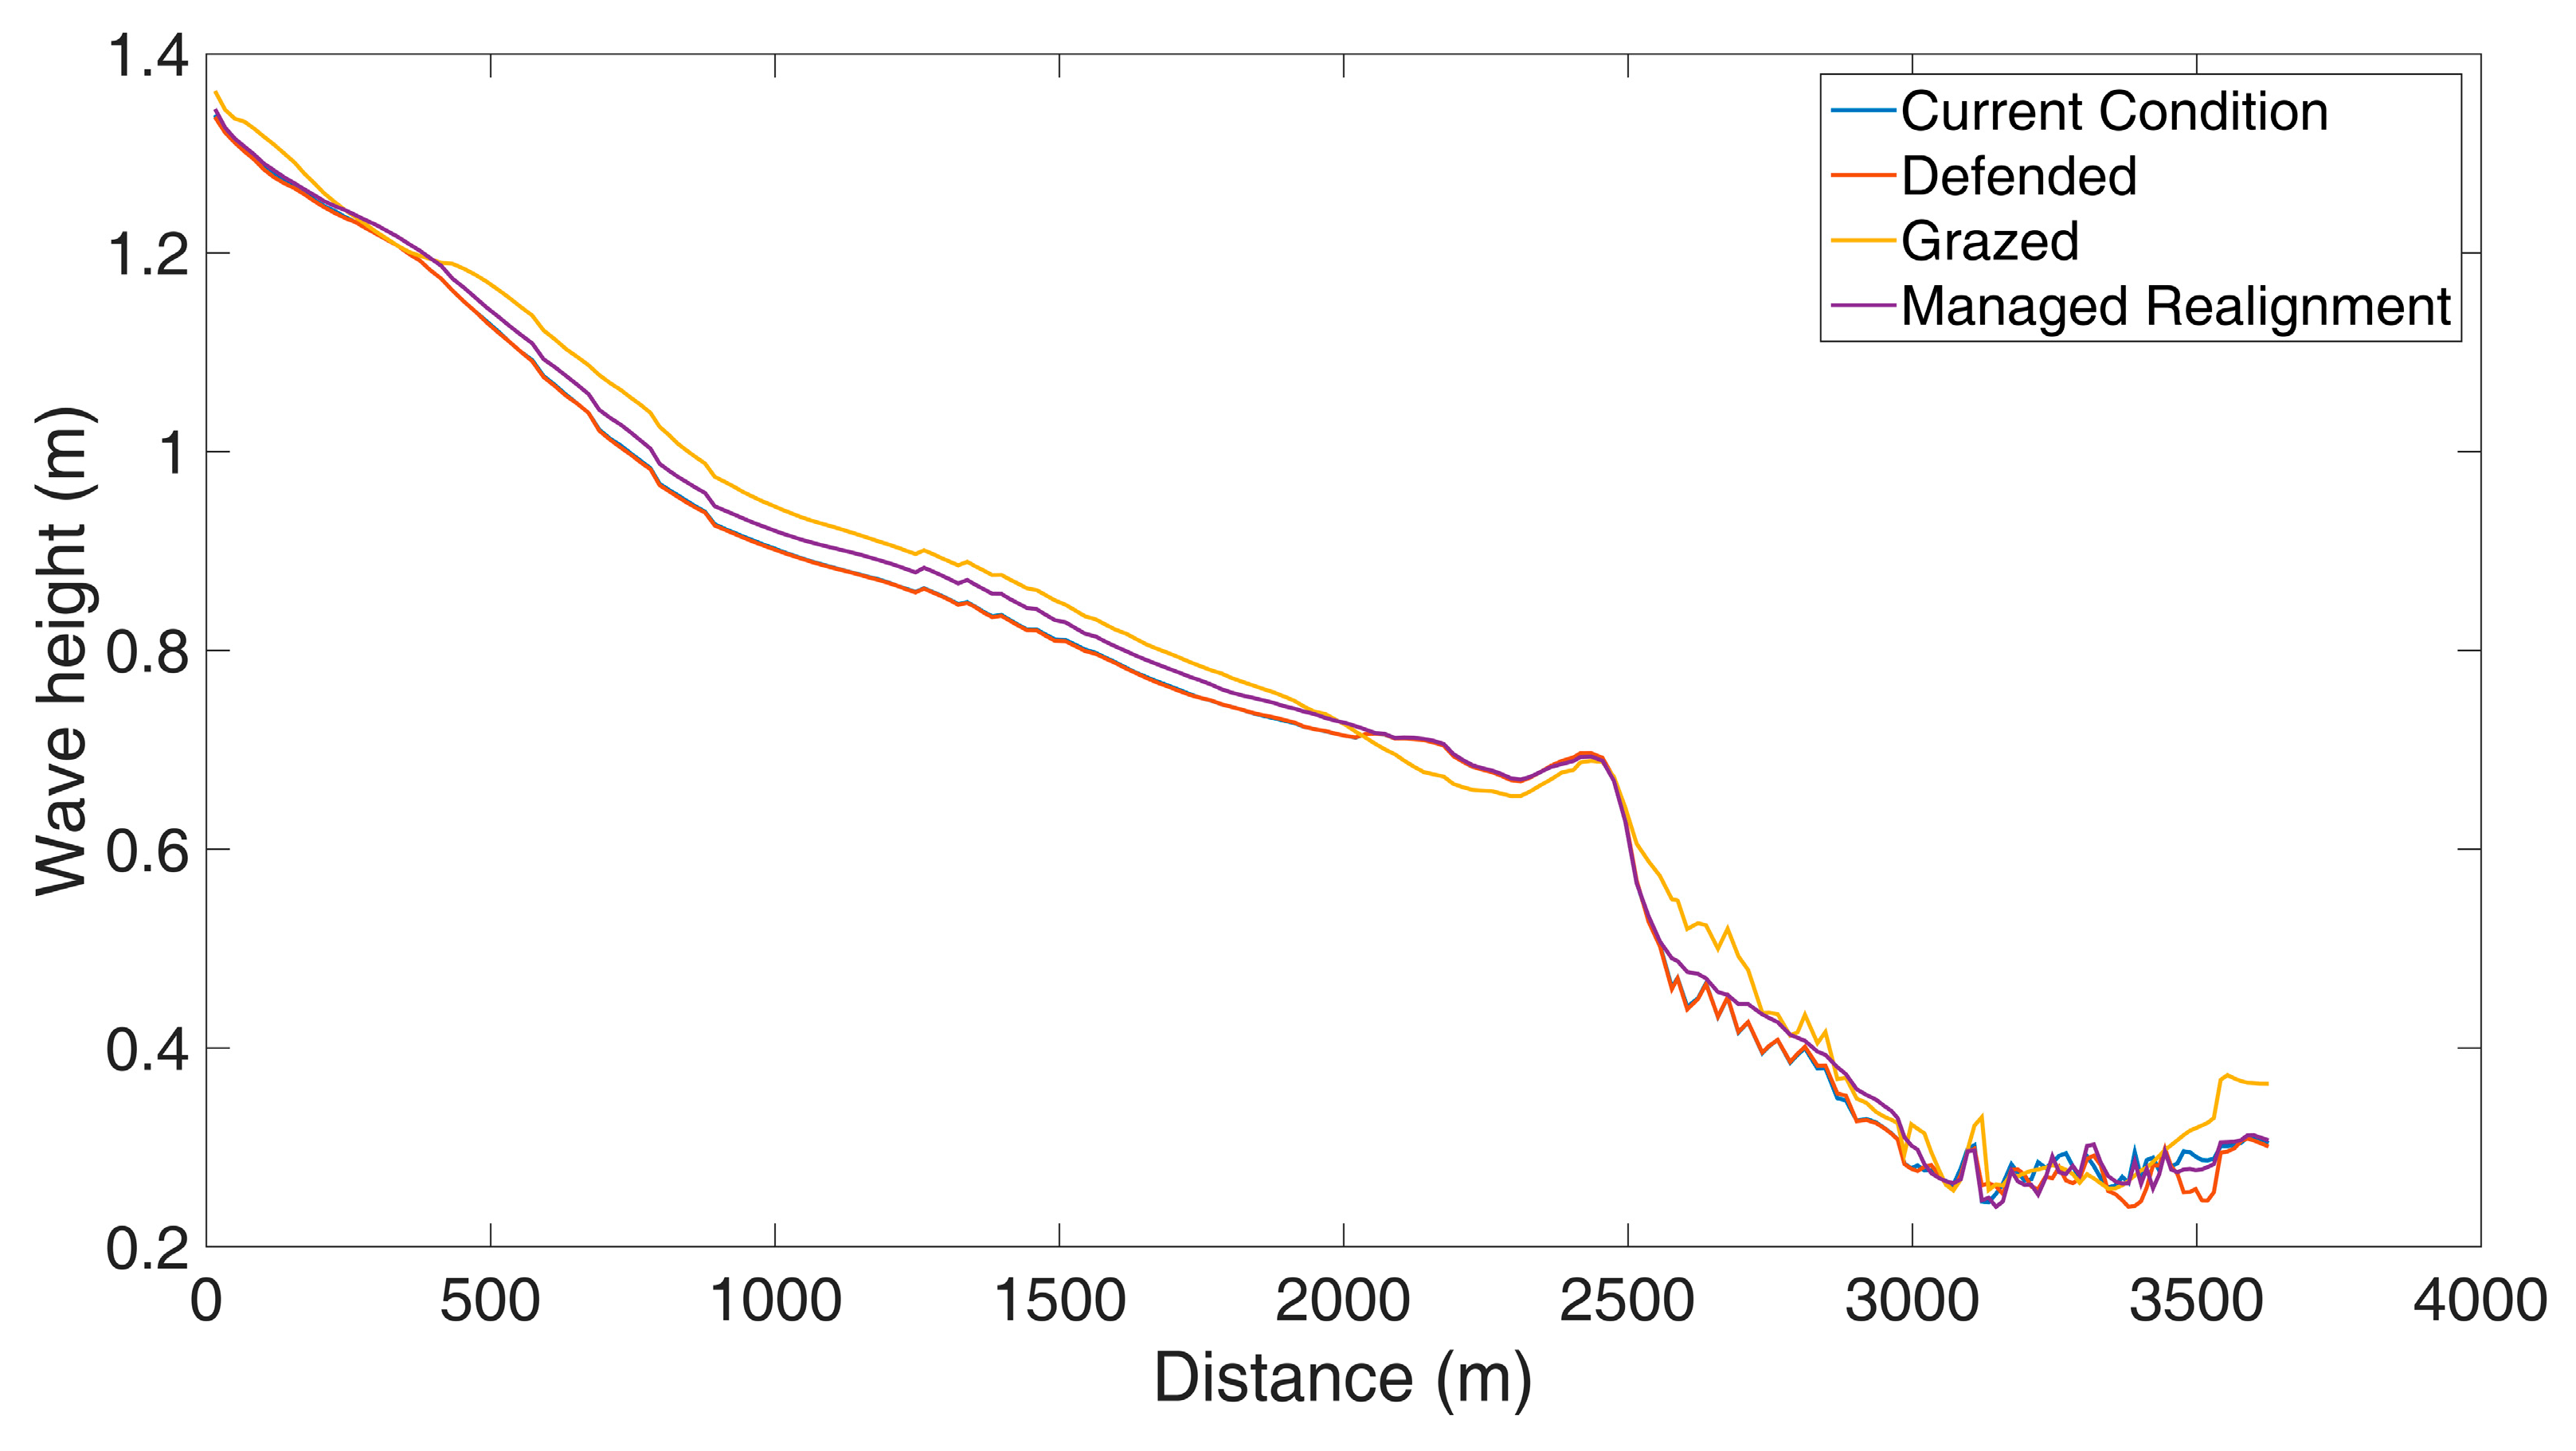
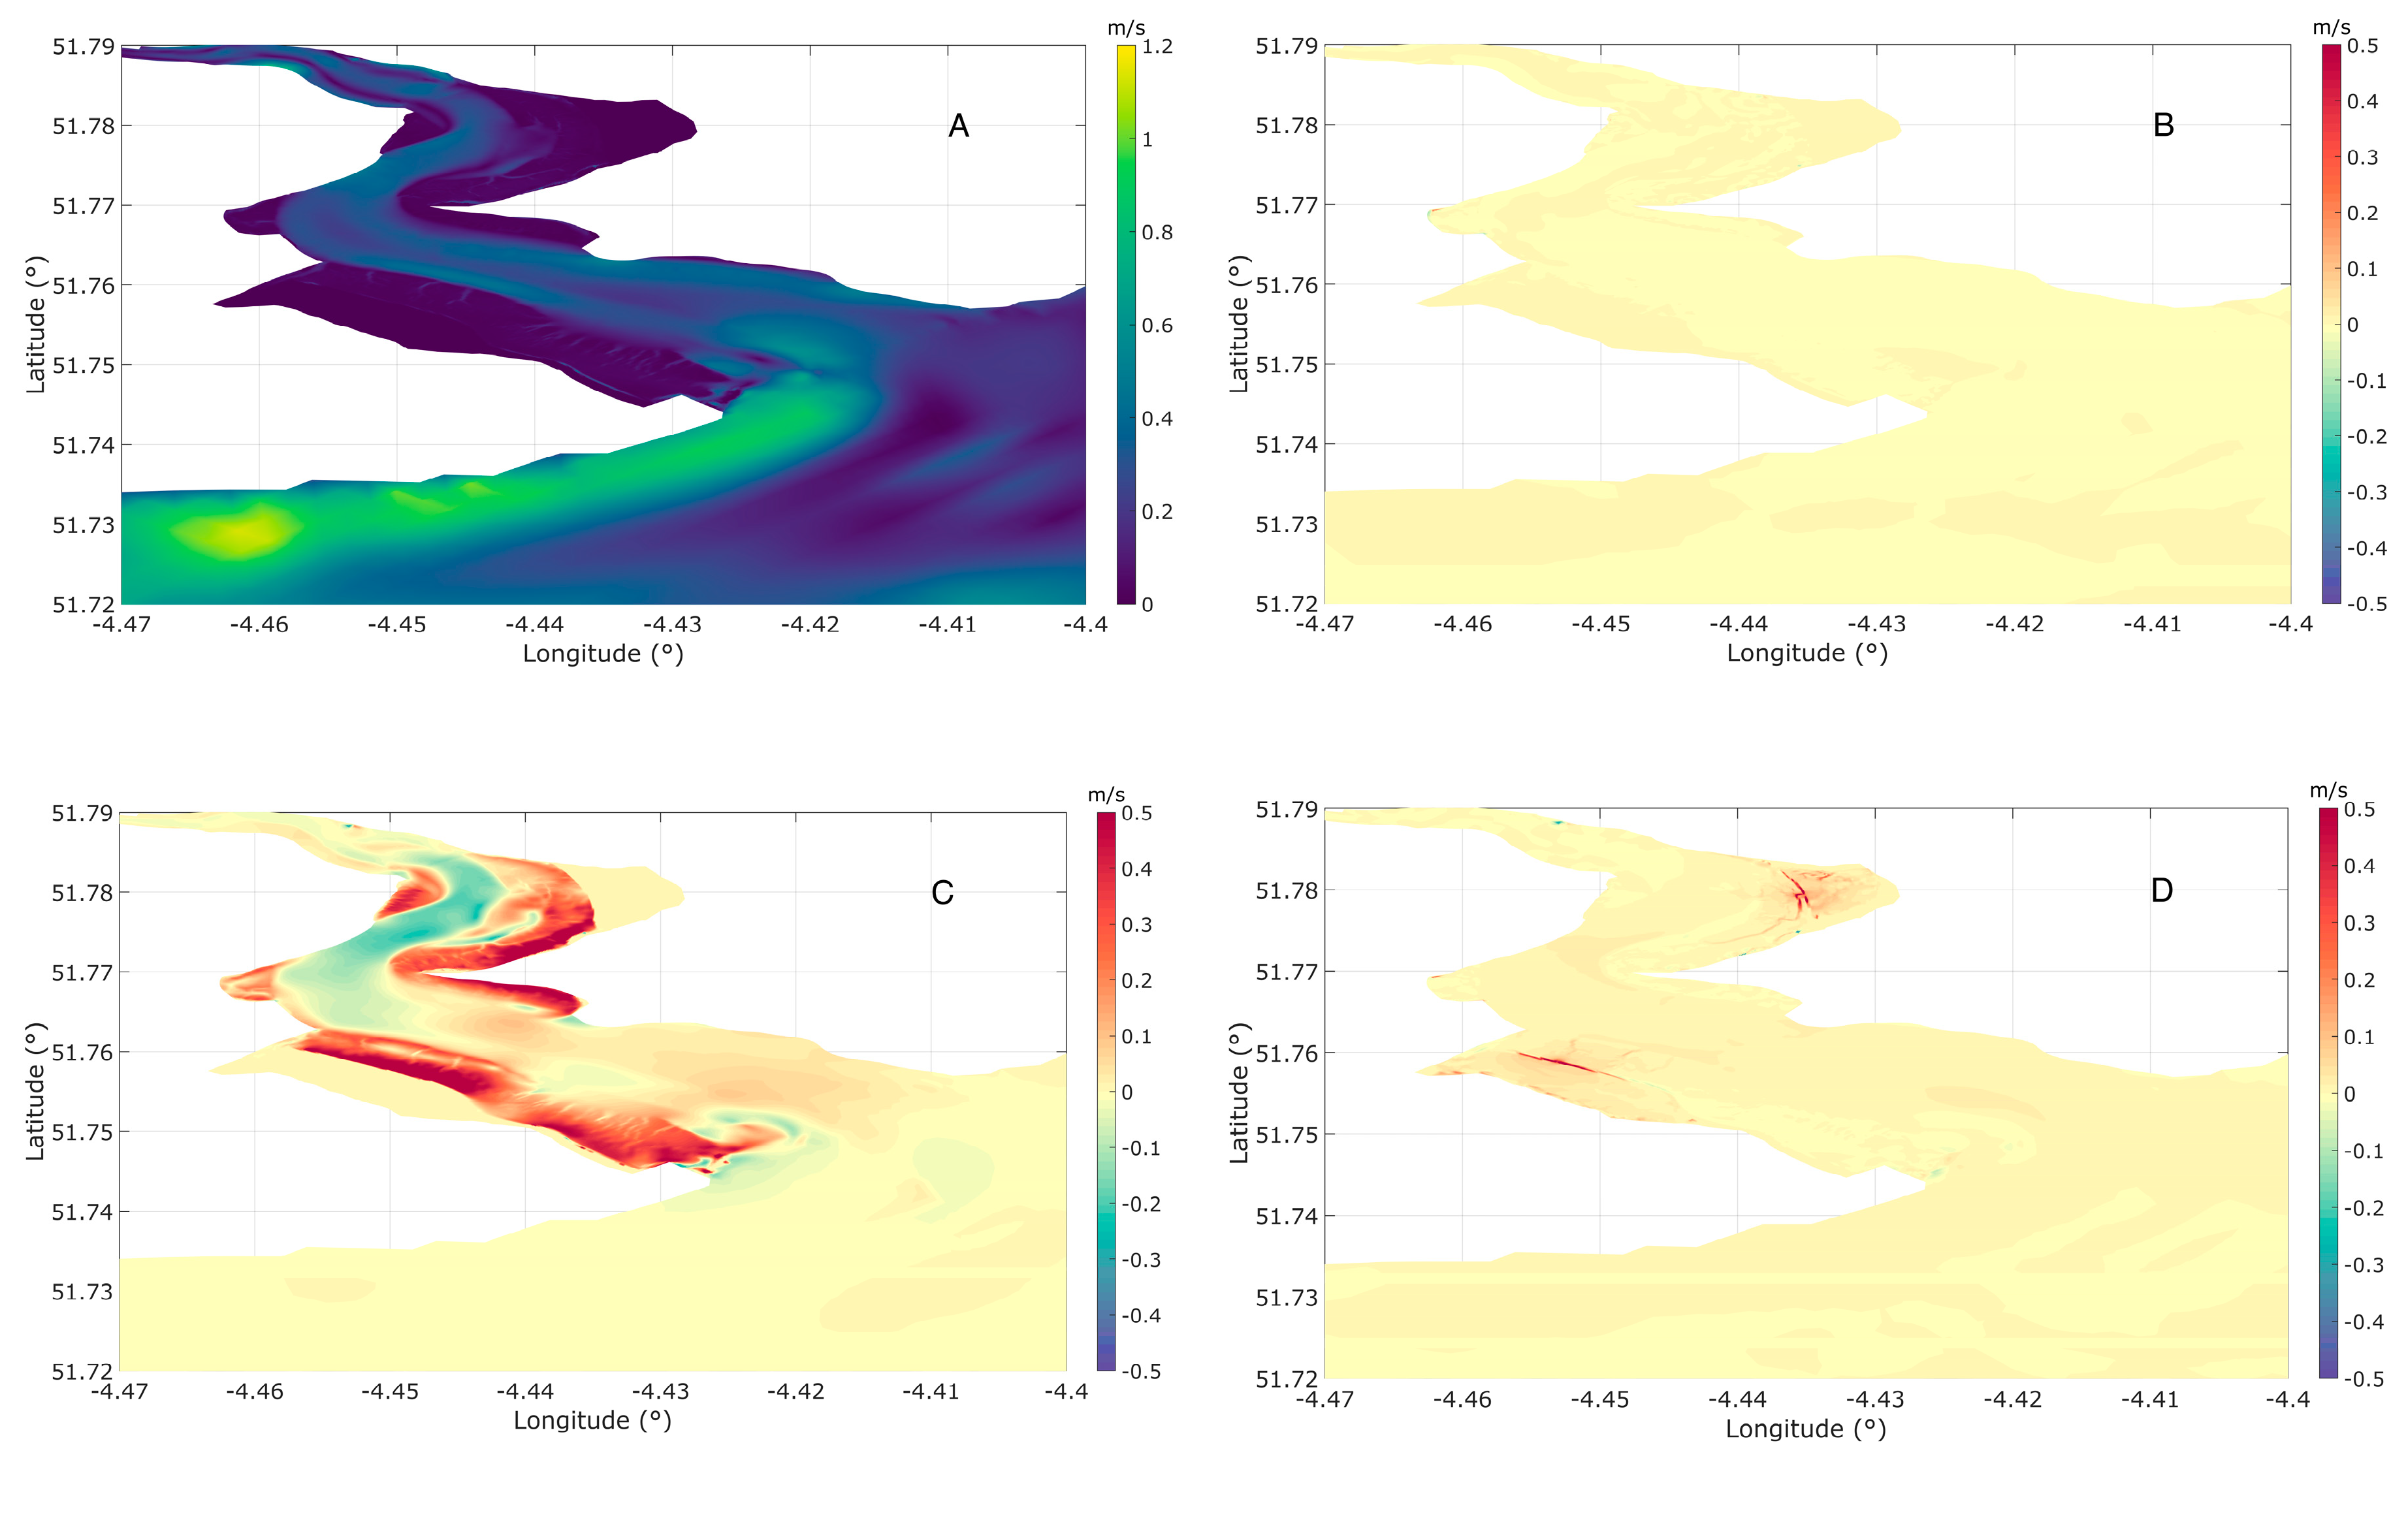
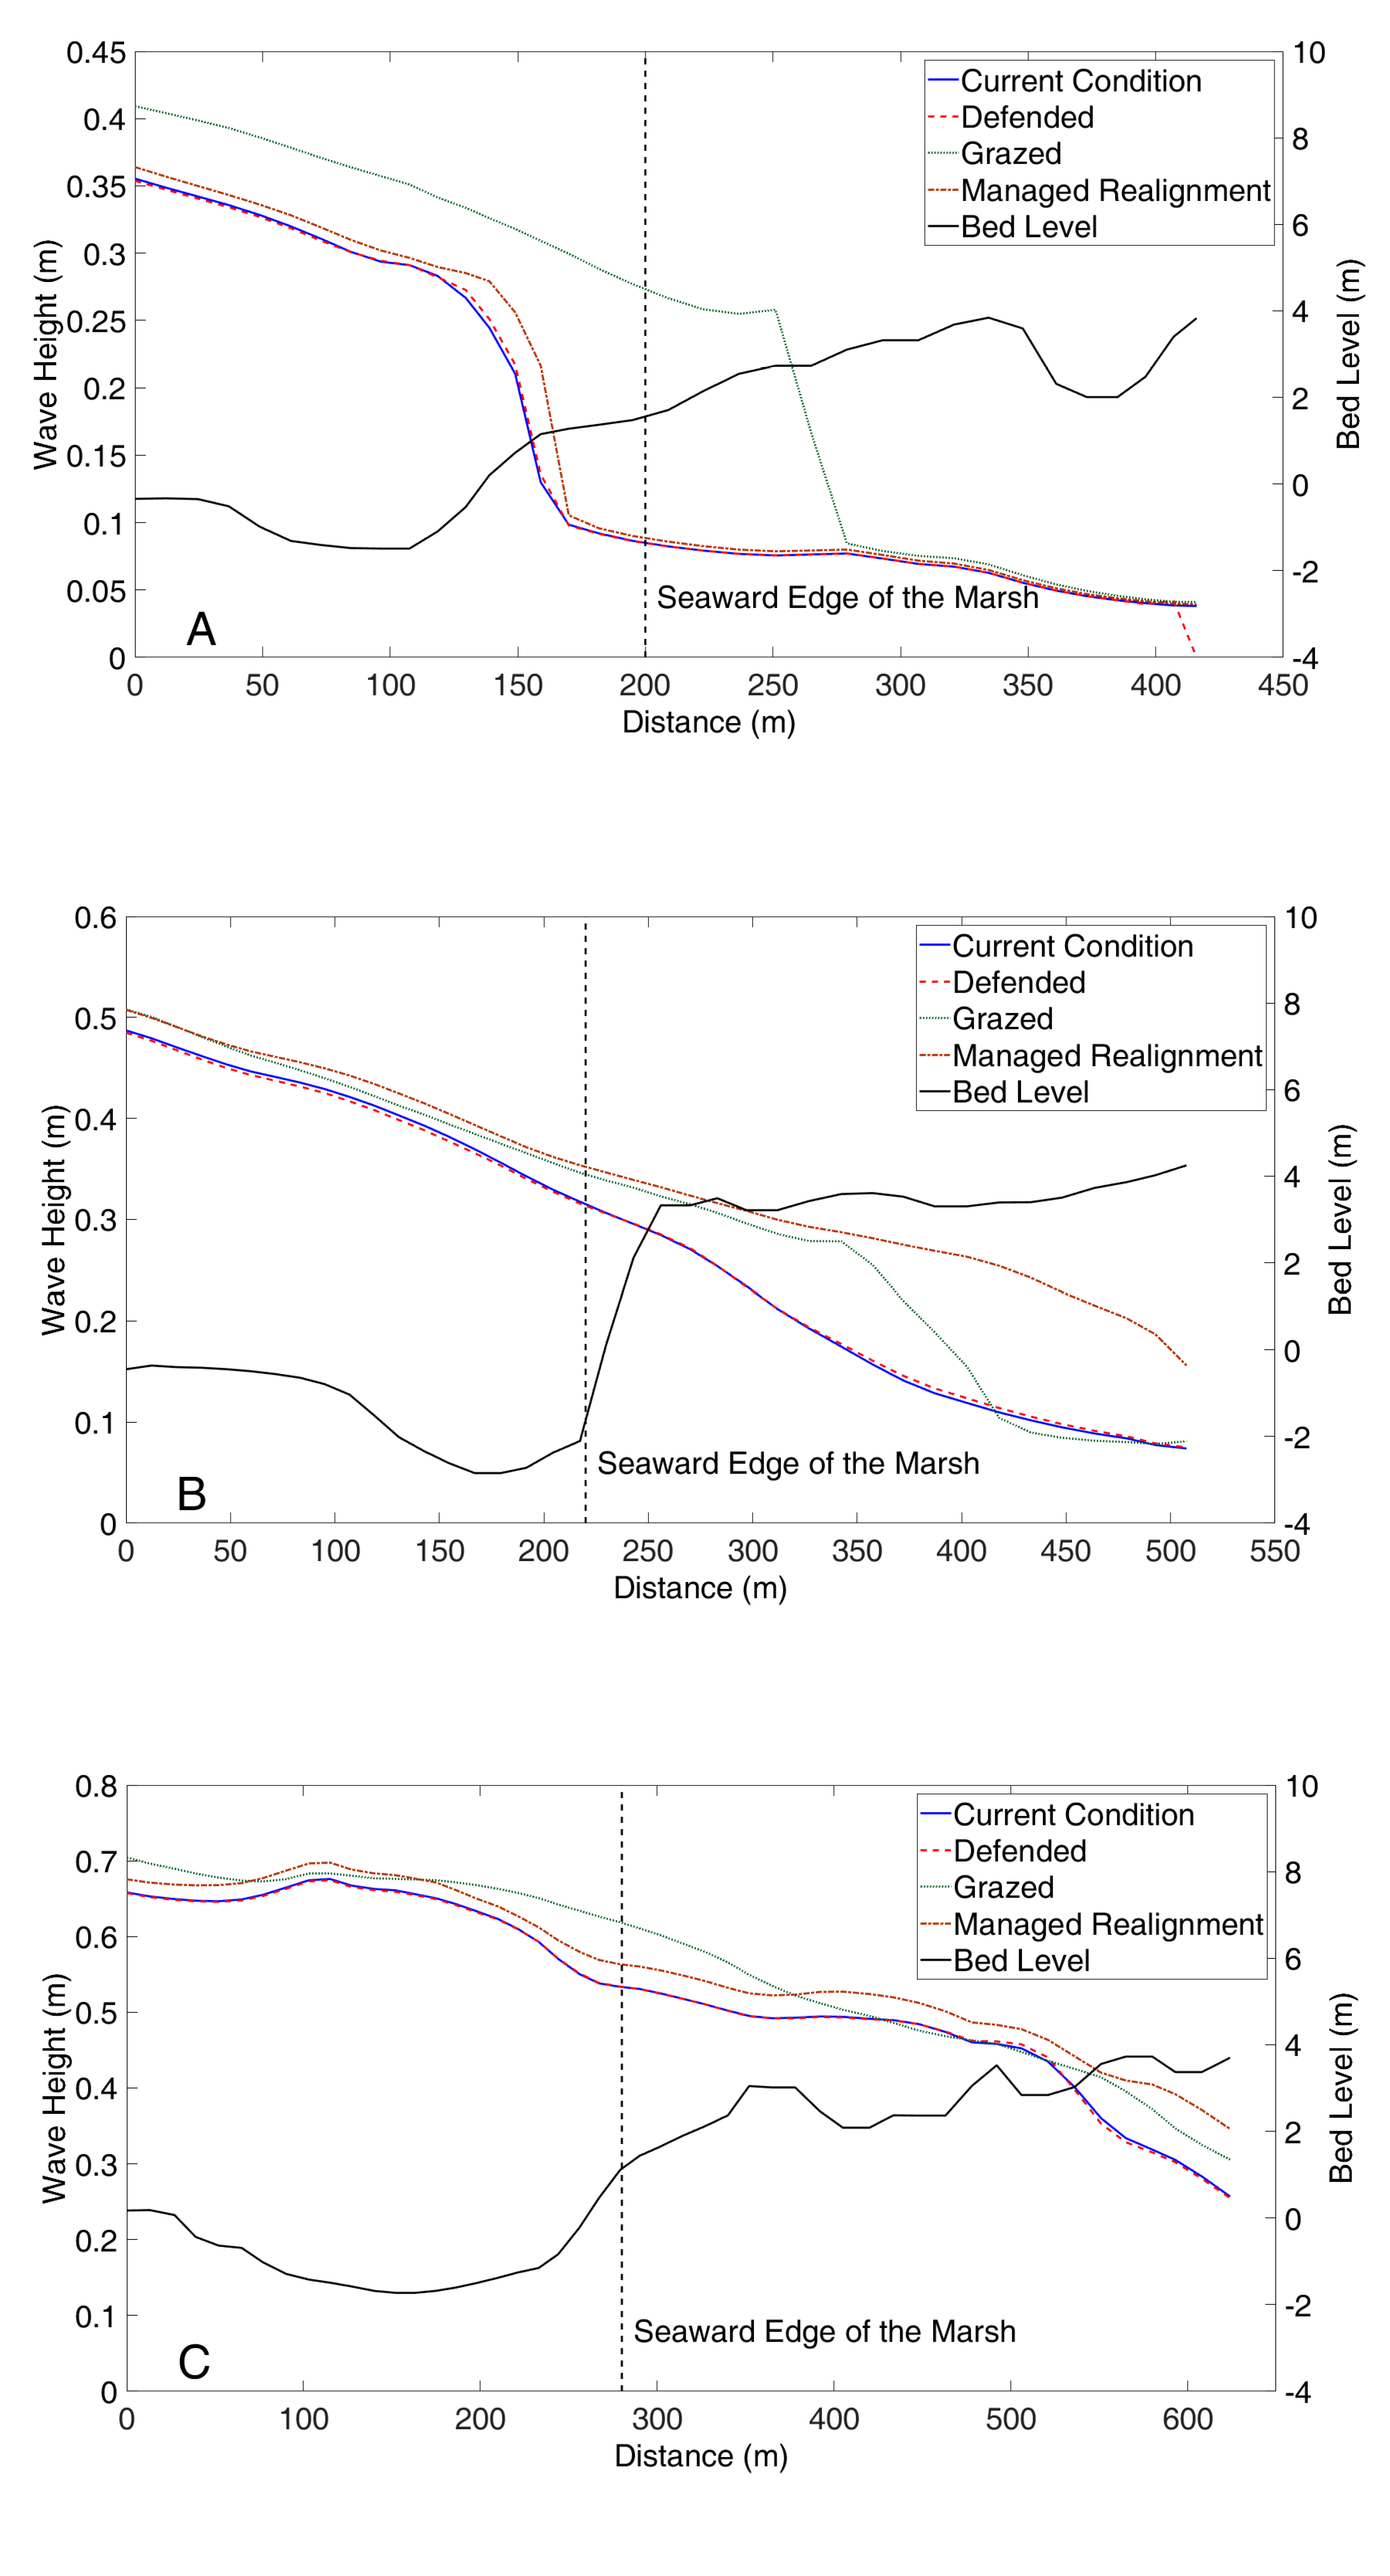
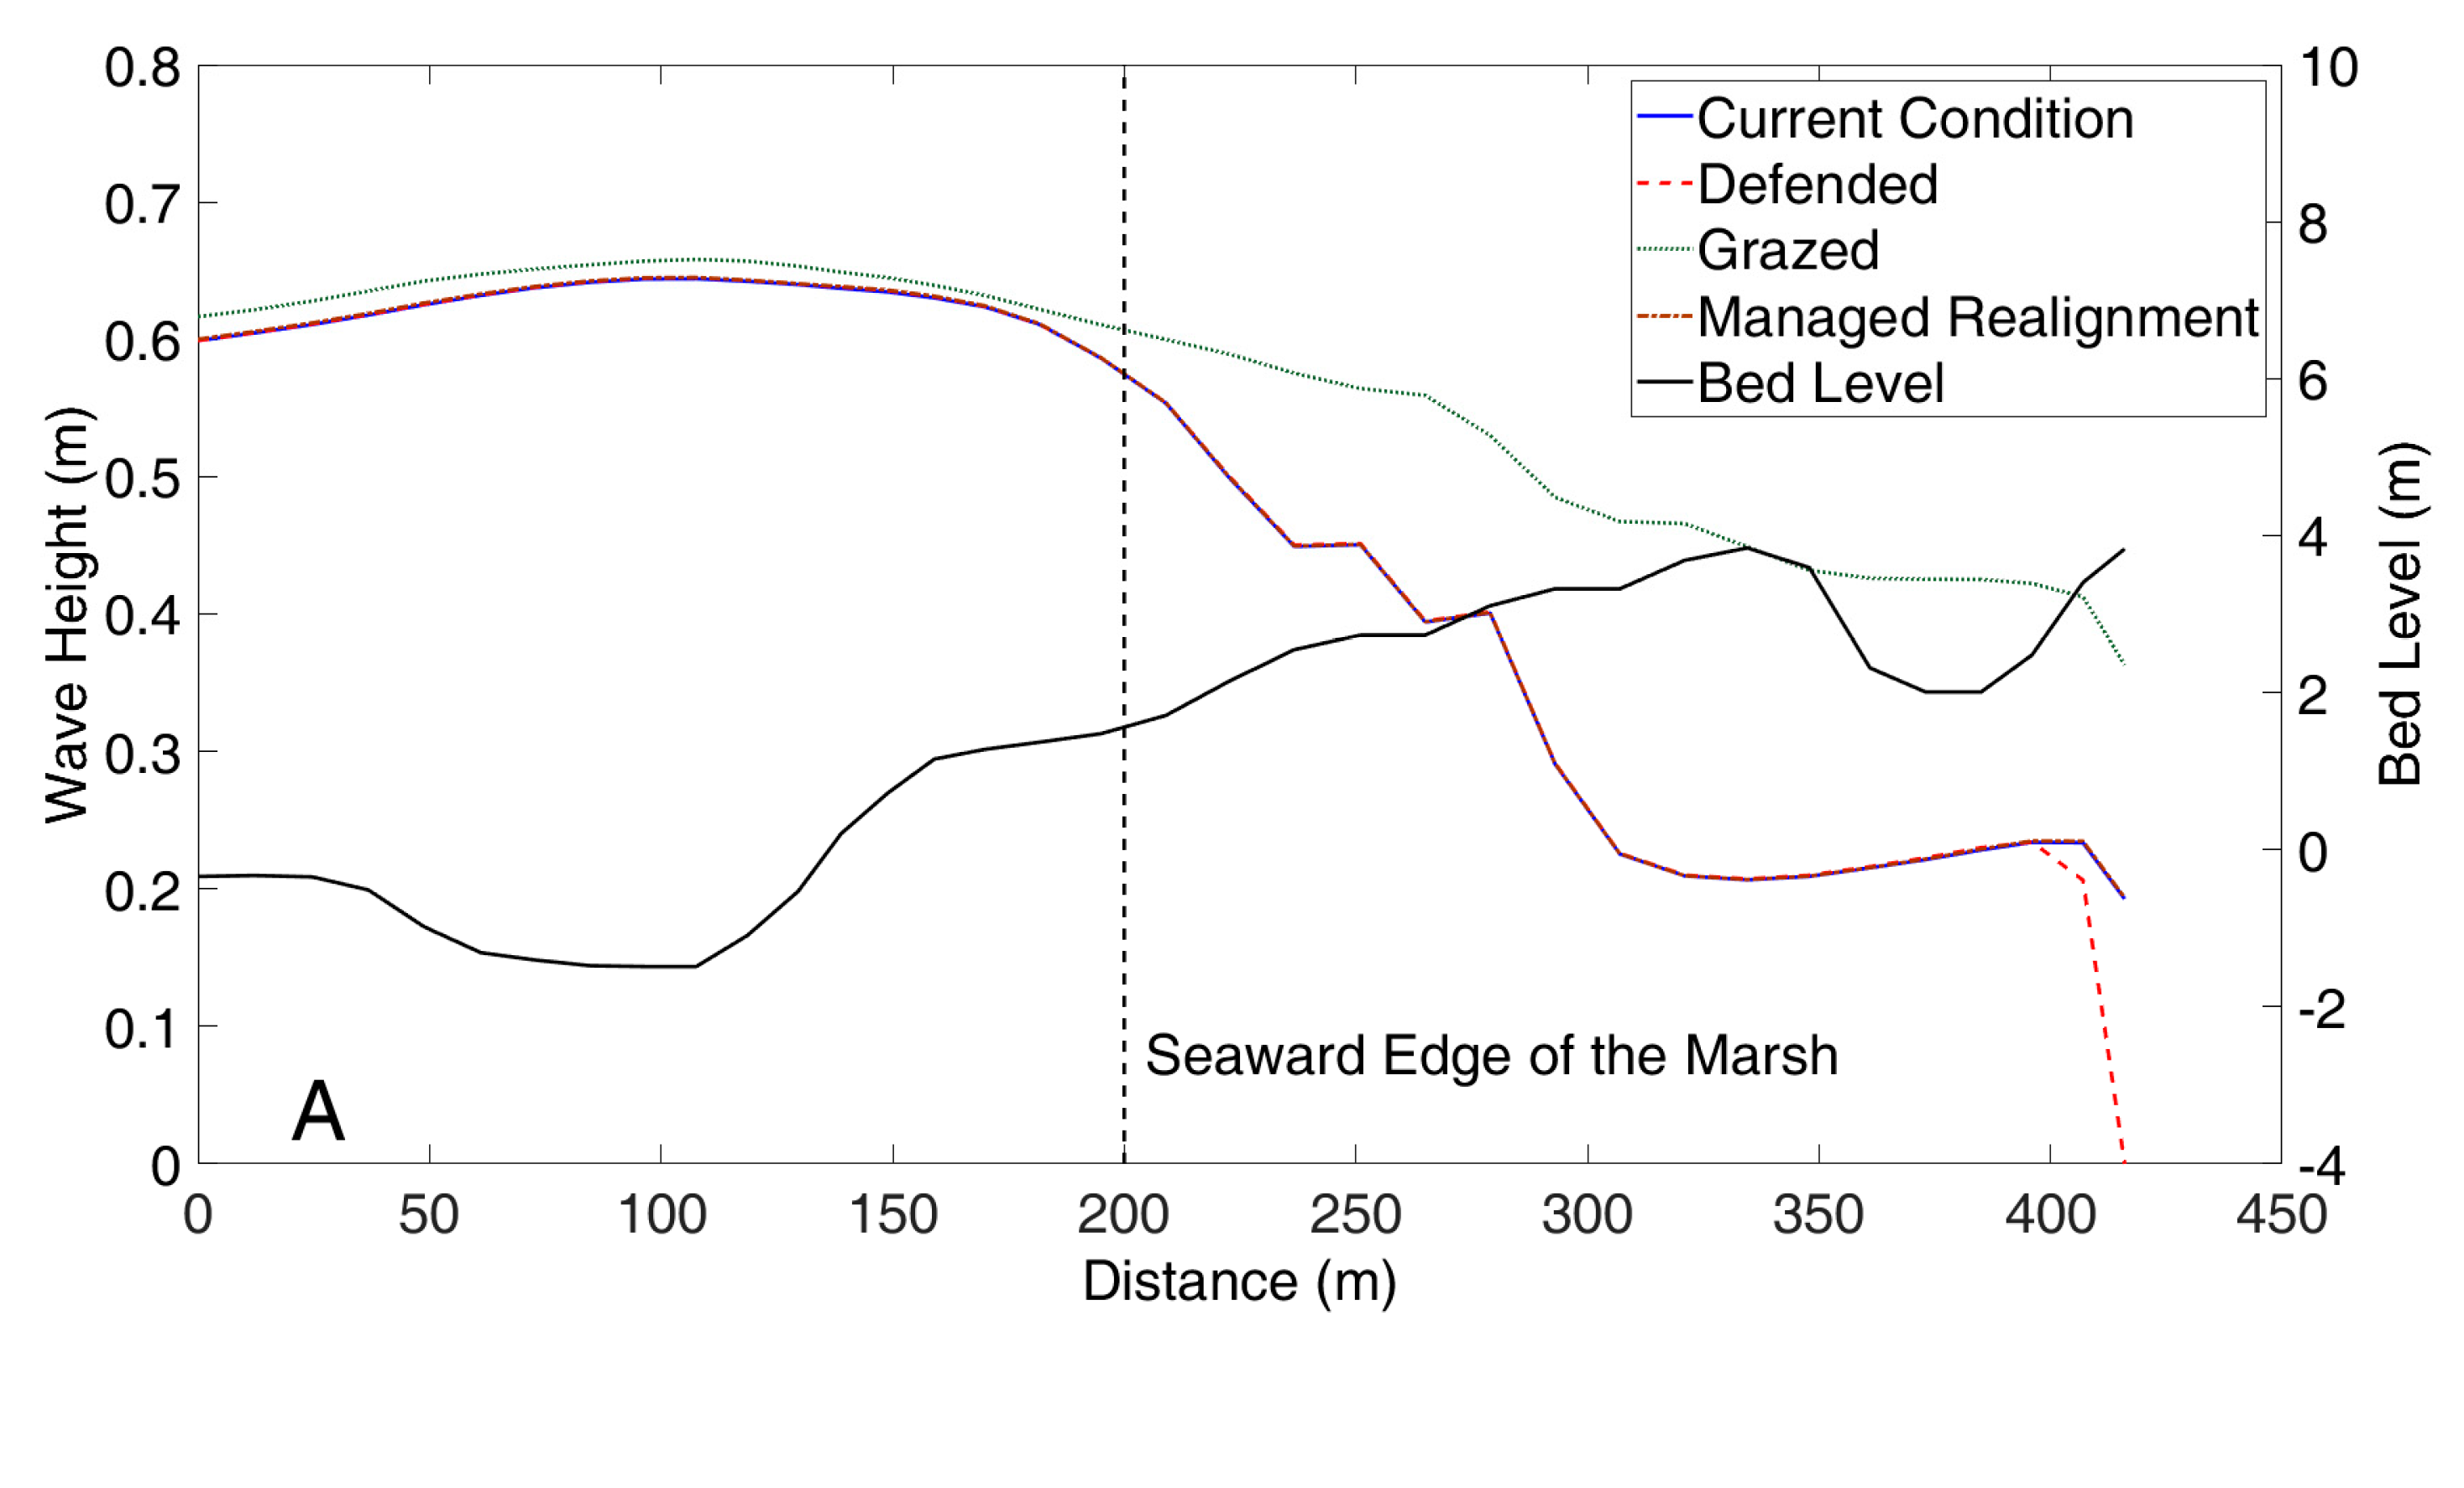
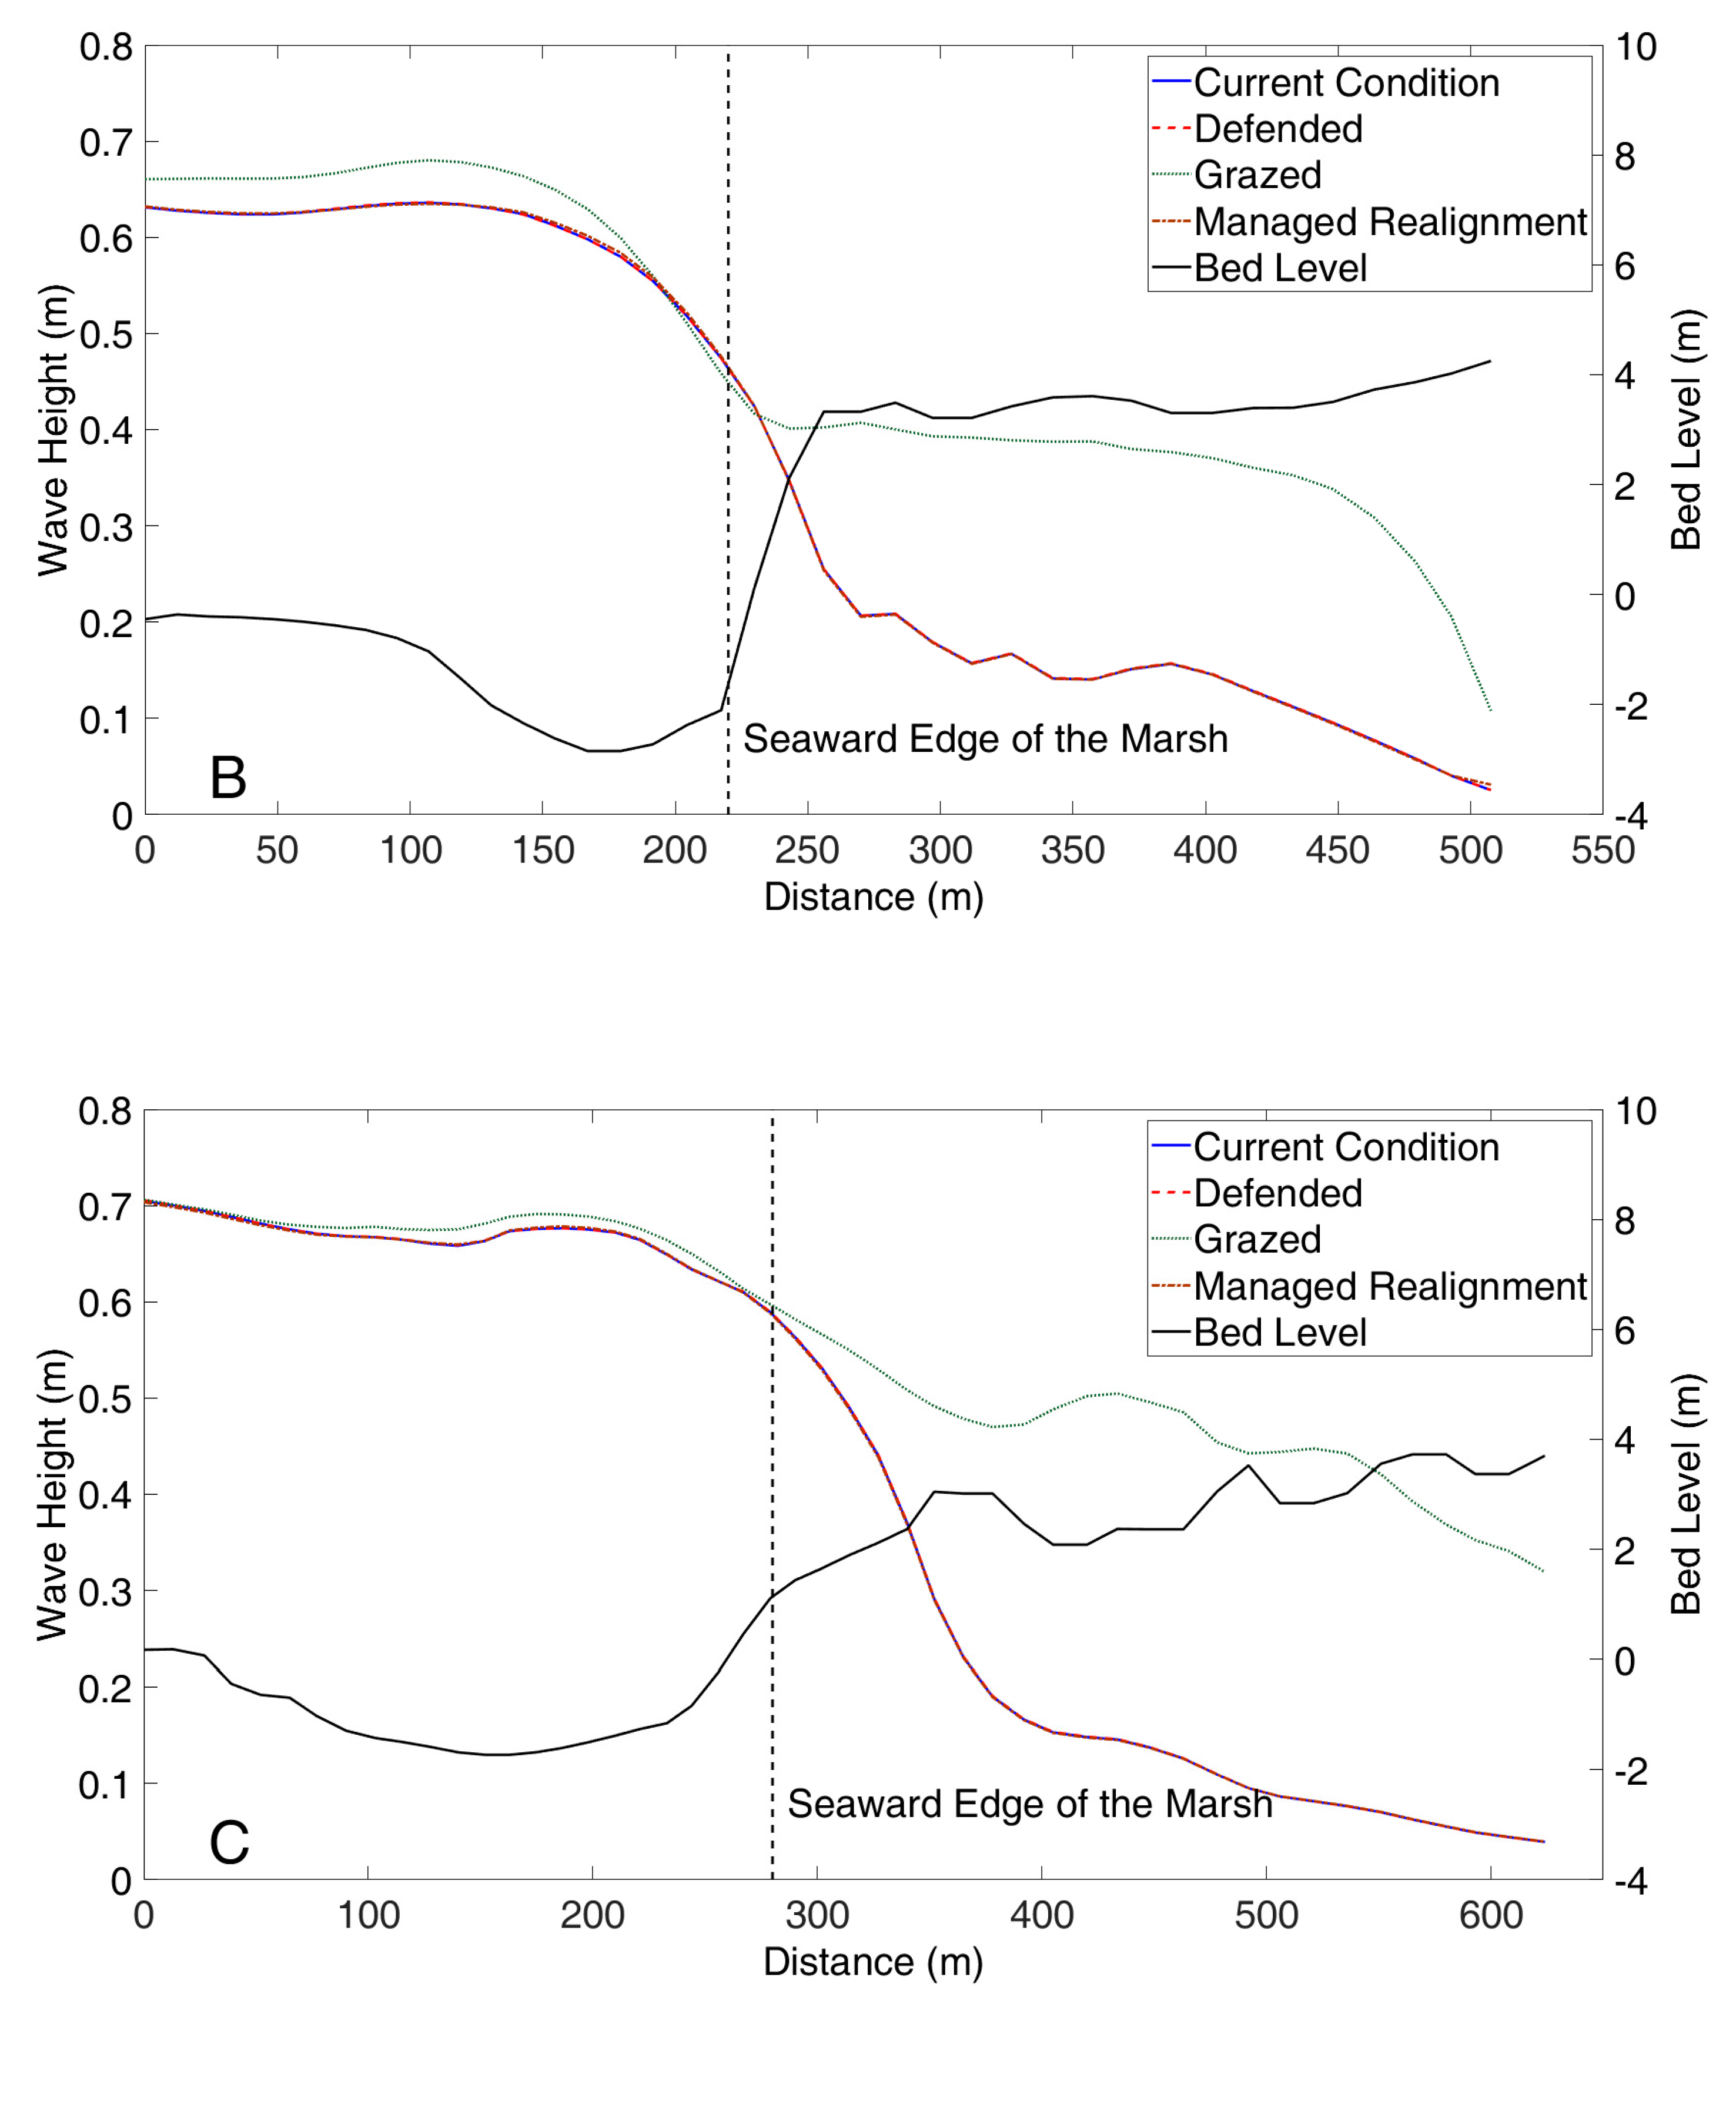
4.1. South-Westerly Storm Conditions
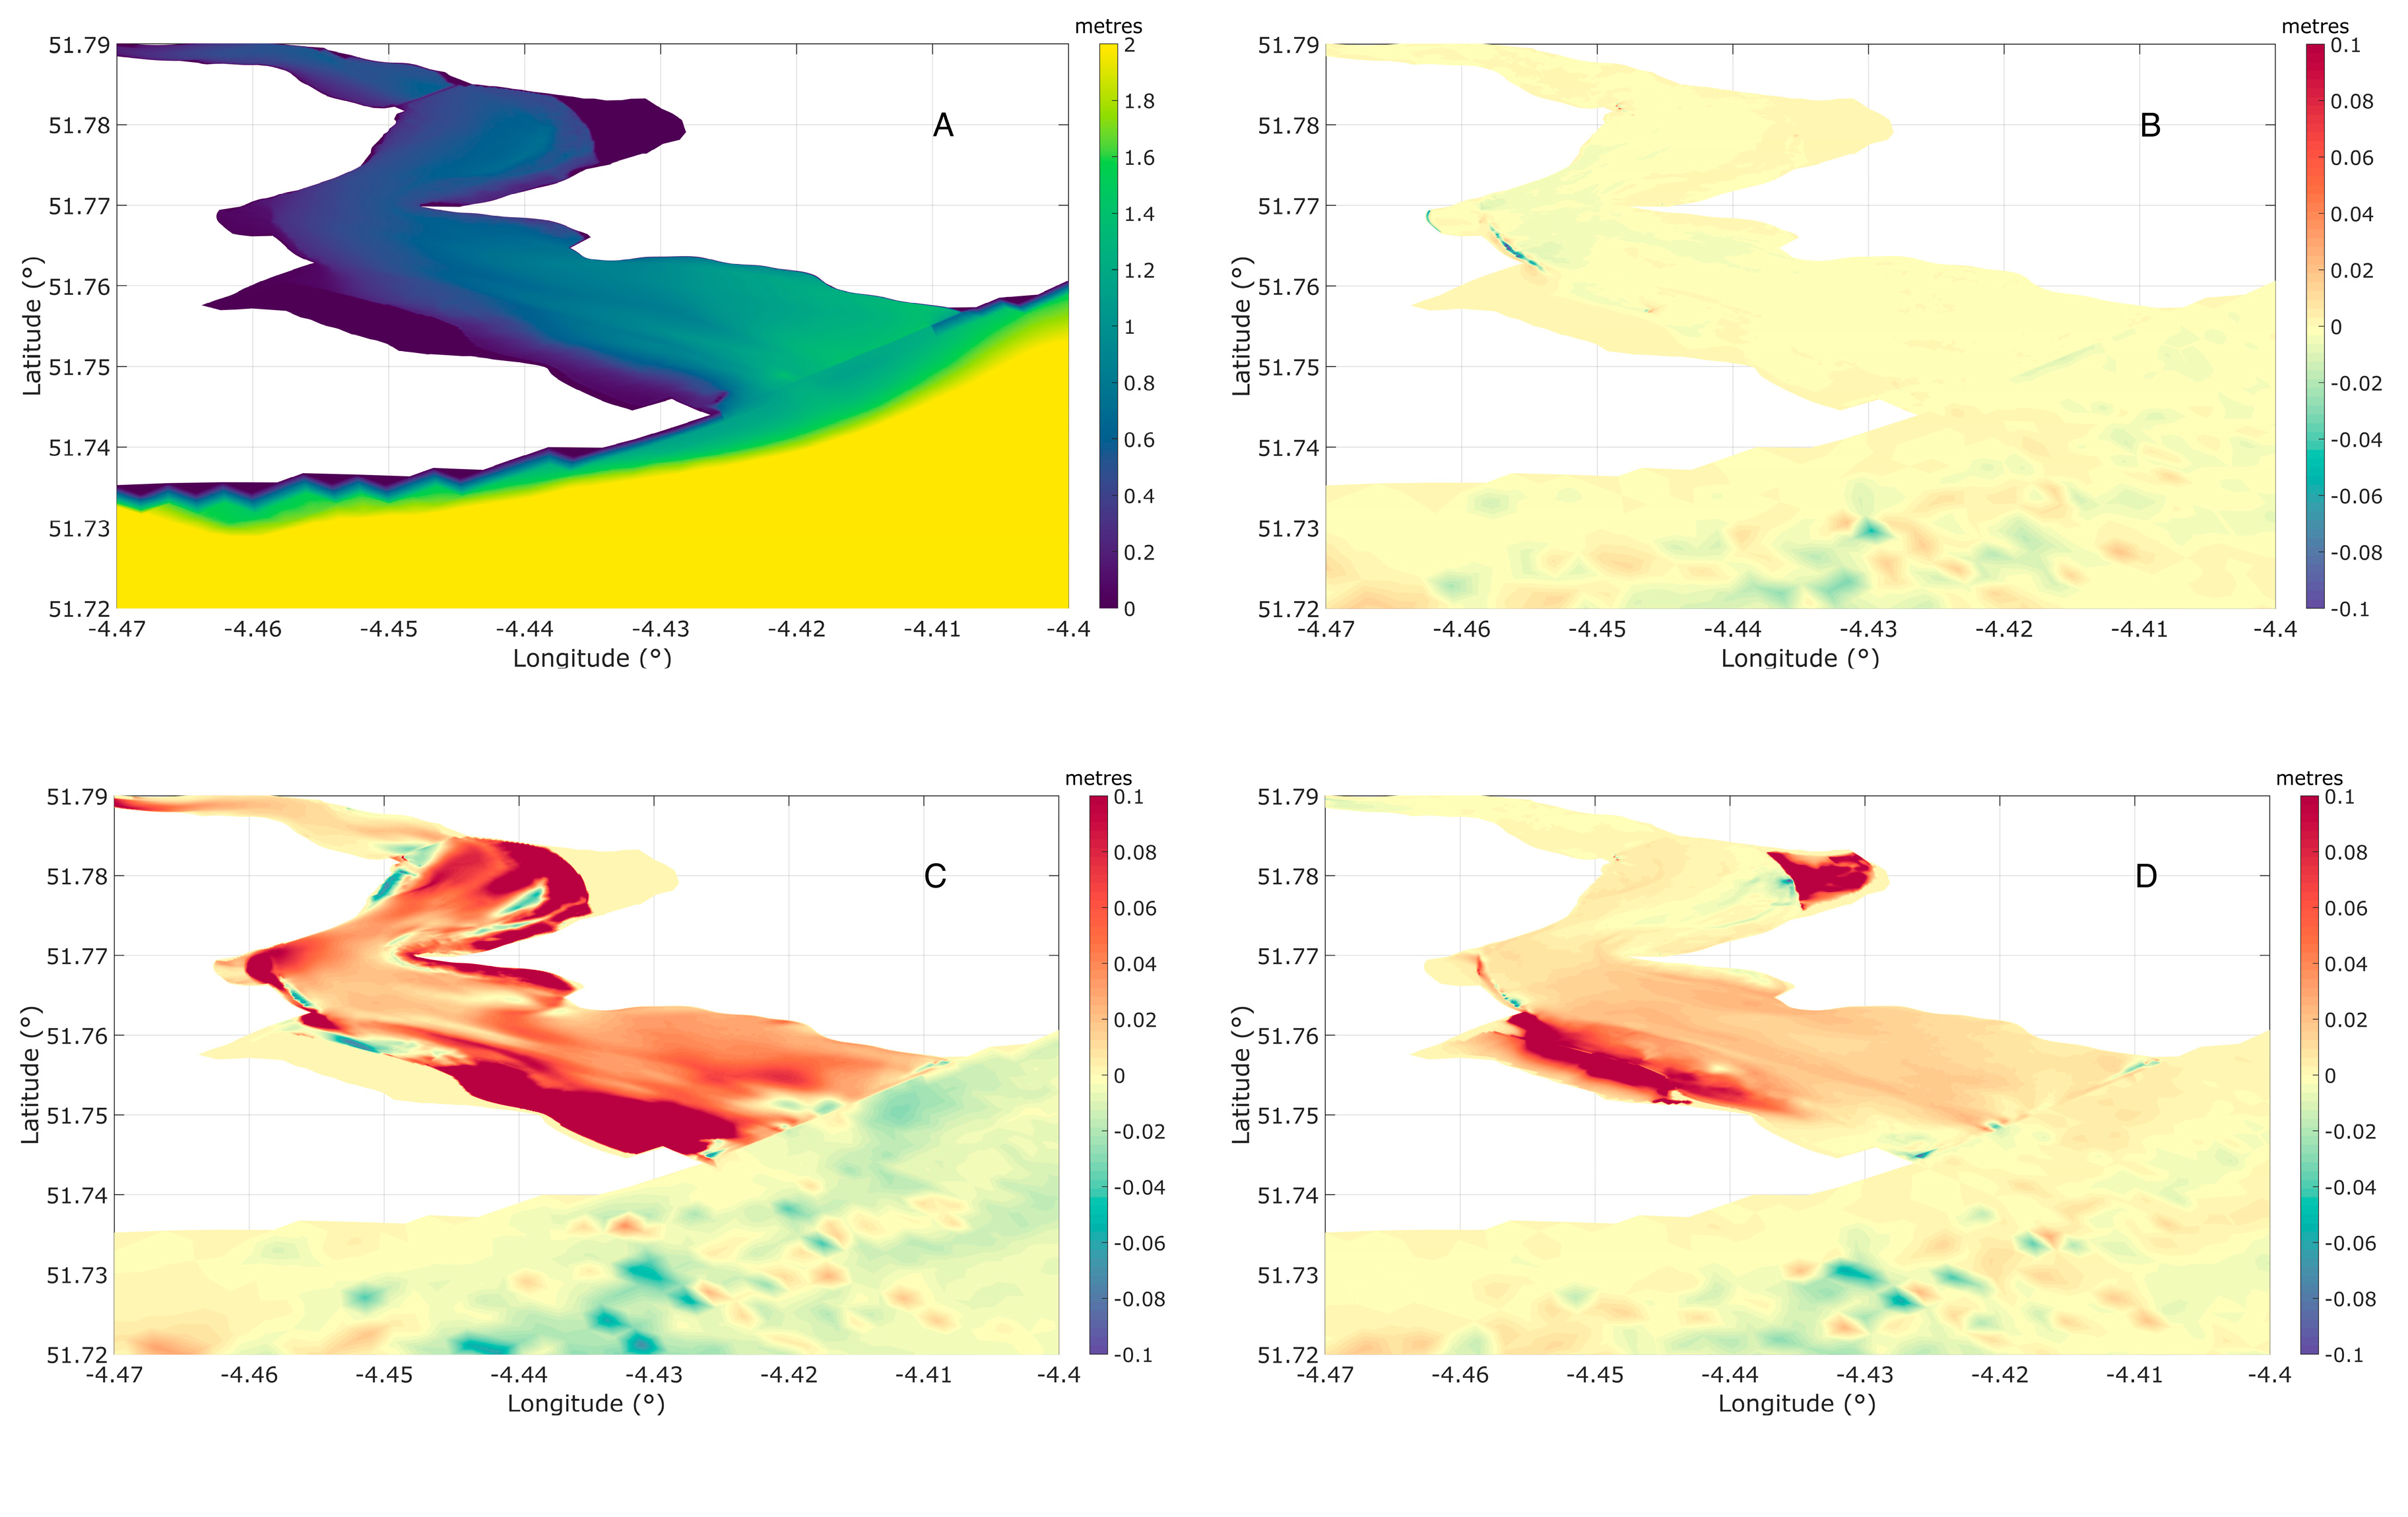
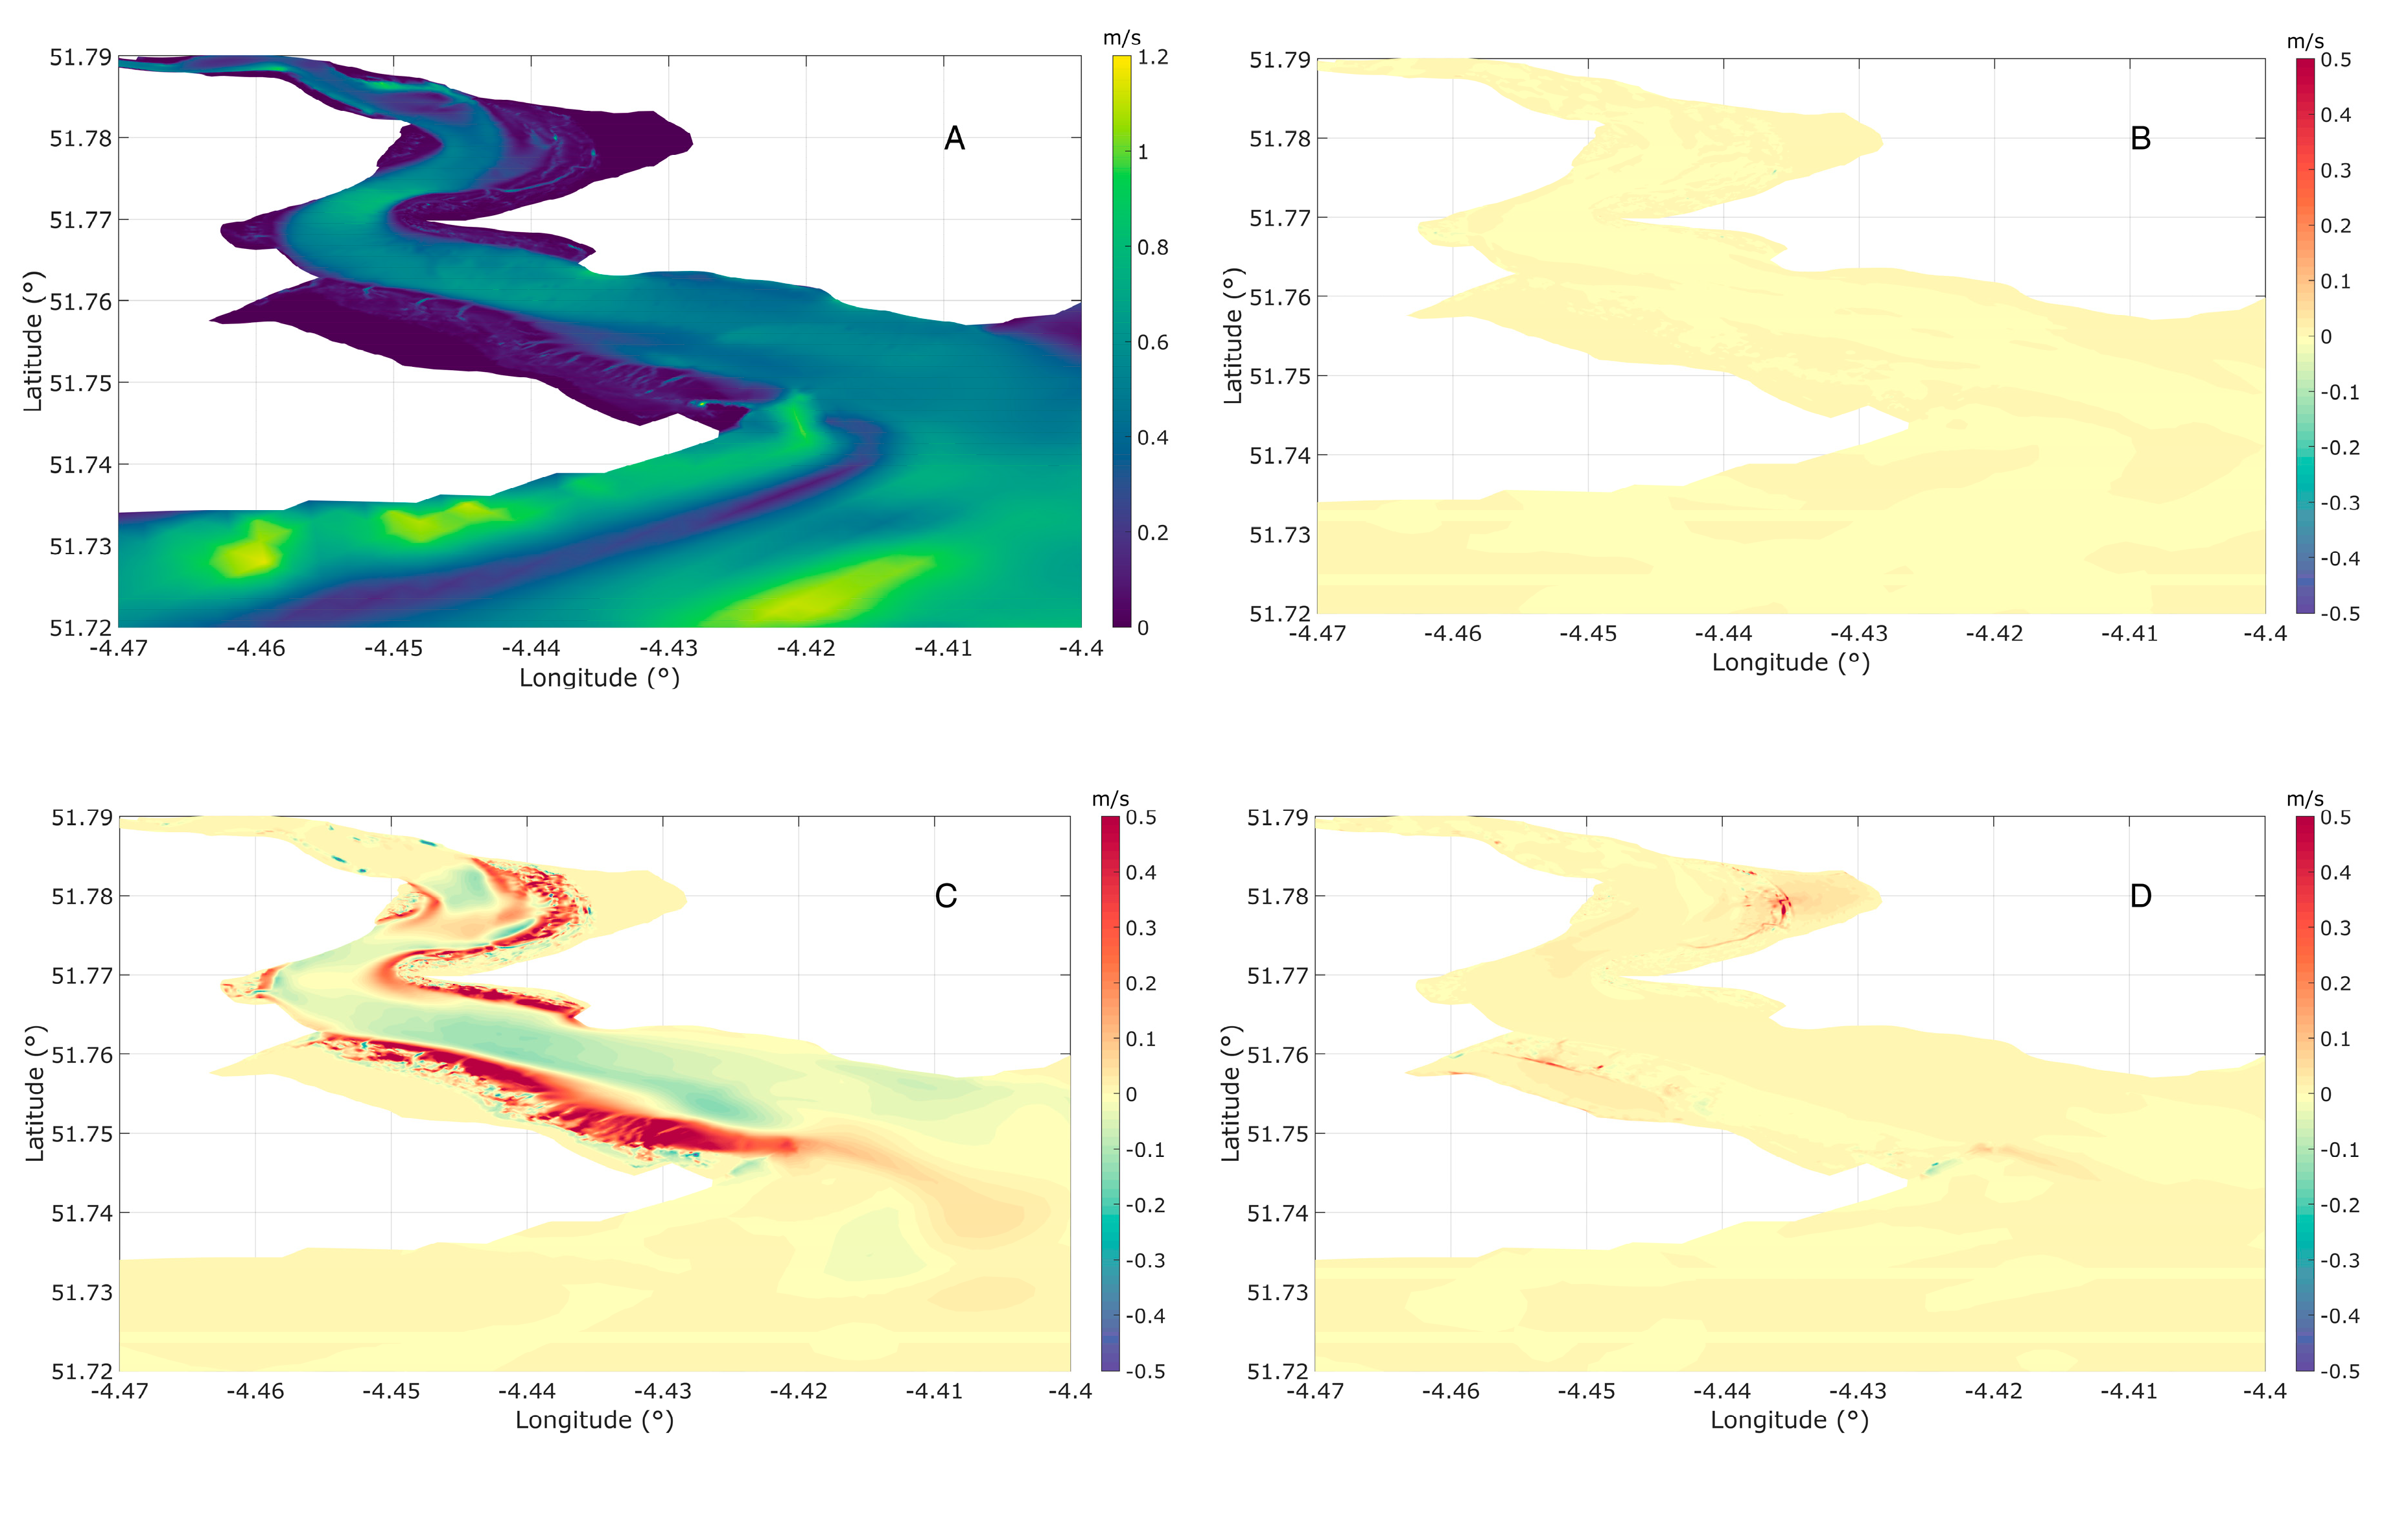
4.2. Easterly Storm Conditions
5. Discussion
6. Conclusions
Author Contributions
Funding
Acknowledgments
Conflicts of Interest
References
- Temmerman, S.; Meire, P.; Bouma, T.J.; Herman, P.M.J.; Ysebaert, T.; De Vriend, H.J. Ecosystem-based coastal defence in the face of global change. Nature 2013, 504, 79–83. [Google Scholar] [CrossRef] [PubMed]
- Dixon, M.; Morris, R.K.A.; Scott, C.R.; Birchenough, A.; Colclough, S. Managed realignment–lessons from Wallasea, UK. Proc. Inst. Civ. Eng. Marit. Eng. 2008. [Google Scholar] [CrossRef]
- Möller, I.; Spencer, T.; French, J.R.; Leggett, D.J.; Dixon, M. The sea-defence value of salt marshes: Field evidence from north norfolk. Water Environ. J. 2001, 15, 109–116. [Google Scholar] [CrossRef]
- Möller, I.; Spencer, T.; French, J.R.; Leggett, D.J.; Dixon, M. Wave transformation over saltmarshes: A field and numerical modelling study from North Norfolk, England. Estuar. Coast. Shelf Sci. 1999, 49, 411–426. [Google Scholar] [CrossRef]
- Möller, I.; Kudella, M.; Rupprecht, F.; Spencer, T.; Paul, M.; Van Wesenbeeck, B.K.; Wolters, G.; Jensen, K.; Bouma, T.J.; Miranda-Lange, M.; et al. Wave attenuation over coastal salt marshes under storm surge conditions. Nat. Geosci. 2014. [Google Scholar] [CrossRef] [Green Version]
- King, S.E.; Lester, J.N. The value of salt marsh as a sea defence. Mar. Pollut. Bull. 1995, 30, 180–189. [Google Scholar] [CrossRef]
- Dixon, A.M.; Leggett, D.J.; Weight, R.C. Habitat creation opportunities for landward coastal re-alignment: Essex case studies. Water Environ. J. 1998, 12, 107–112. [Google Scholar] [CrossRef]
- Bouma, T.J.; van Belzen, J.; Balke, T.; Zhu, Z.; Airoldi, L.; Blight, A.J.; Davies, A.J.; Galvan, C.; Hawkins, S.J.; Hoggart, S.P.G.; et al. Identifying knowledge gaps hampering application of intertidal habitats in coastal protection: Opportunities & steps to take. Coast. Eng. 2014. [Google Scholar] [CrossRef]
- Dean, R.G.; Bender, C.J. Static wave setup with emphasis on damping effects by vegetation and bottom friction. Coast. Eng. 2006, 53, 149–156. [Google Scholar] [CrossRef]
- Leonard, L.A.; Luther, M.E. Flow hydrodynamics in tidal marsh canopies. Limnol. Oceanogr. 1995, 40, 1474–1484. [Google Scholar] [CrossRef]
- Shi, Z.; Pethick, J.; Pye, K. Flow Structure in and above the Various Heights of a Saltmarsh Canopy: A Laboratory Flume Study. J. Coast. Res. 1995, 11, 1204–1209. [Google Scholar]
- Leonard, L.A.; Croft, A.L. The effect of standing biomass on flow velocity and turbulence in Spartina alterniflora canopies. Estuar. Coast. Shelf Sci. 2006, 69, 325–336. [Google Scholar] [CrossRef]
- Temmerman, S.; Bouma, T.J.; Van de Koppel, J.; Van der Wal, D.; De Vries, M.B.; Herman, P.M.J. Vegetation causes channel erosion in a tidal landscape. Geology 2007, 35, 631–634. [Google Scholar] [CrossRef]
- UNEP. Marine and Coastal Ecosystems and Human Well-Being: A Synthesis Report Based on the Findings of the Millennium Ecosystem Assessment; UNEP: Nairobi, Kenya, 2006. [Google Scholar]
- Fagherazzi, S.; Mariotti, G.; Wiberg, P.; McGlathery, K. Marsh Collapse Does Not Require Sea Level Rise. Oceanography 2013, 26, 70–77. [Google Scholar] [CrossRef] [Green Version]
- Doody, J.P. ‘Coastal squeeze’—An historical perspective. J. Coast. Conserv. 2004, 10, 129. [Google Scholar] [CrossRef]
- Marani, M.; Da Lio, C.; D’Alpaos, A. Vegetation engineers marsh morphology through multiple competing stable states. Proc. Natl. Acad. Sci. USA 2013, 110, 3259–3263. [Google Scholar] [CrossRef] [Green Version]
- Pendle, M. Estuarine and Coastal Managed Realignment Sites in England Estuarine and Coastal Managed Realignment Sites in England A Comparison of Predictions with Monitoring Results for Selected Case Studies; HR Wallingford: Wallingford, UK, 2013. [Google Scholar]
- Hackney, C.T.; Cleary, W.J. Saltmarsh Loss in Southeastern North Carolina Lagoons: Importance of Sea Level Rise and Inlet Dredging. J. Coast. Res. 1987, 3, 93–97. [Google Scholar]
- Craft, C.; Clough, J.; Ehman, J.; Joye, S.; Park, R.; Pennings, S.; Guo, H.; Machmuller, M. Forecasting the effects of accelerated sea-level rise on tidal marsh ecosystem services. Front. Ecol. Environ. 2009, 7, 73–78. [Google Scholar] [CrossRef] [Green Version]
- French, P.W. Managed realignment—The developing story of a comparatively new approach to soft engineering. Estuar. Coast. Shelf Sci. 2006, 67, 409–423. [Google Scholar] [CrossRef]
- Myatt-Bell, L.B.; Scrimshaw, M.D.; Lester, J.N.; Potts, J.S. Public perception of managed realignment: Brancaster West Marsh, North Norfolk, UK. Mar. Policy 2002, 26, 45–57. [Google Scholar] [CrossRef]
- Myatt, L.B.; Scrimshaw, M.D.; Lester, J.N. Public perceptions and attitudes towards a forthcoming managed realignment scheme: Freiston Shore, Lincolnshire, UK. Ocean Coast. Manag. 2003, 46, 565–582. [Google Scholar] [CrossRef]
- Esteves, L.S. Managed Realignment: A Viable Long-Term Coastal Management Strategy? Springer: London, UK, 2014; ISBN 978-94-017-9028-4. [Google Scholar]
- Adaptation Sub-Committee. Progress Report 2013: Managing the Land in a Changing Climate; Committee on Climate Change: London, UK, 2013. [Google Scholar]
- Garbutt, R.A.; Reading, C.J.; Wolters, M.; Gray, A.J.; Rothery, P. Monitoring the development of intertidal habitats on former agricultural land after the managed realignment of coastal defences at Tollesbury, Essex, UK. Mar. Pollut. Bull. 2006. [Google Scholar] [CrossRef] [PubMed]
- Rotman, R.; Naylor, L.; McDonnell, R.; MacNiocaill, C. Sediment transport on the Freiston Shore managed realignment site: An investigation using environmental magnetism. Geomorphology 2008, 100, 241–255. [Google Scholar] [CrossRef]
- Friess, D.A.; Möller, I.; Spencer, T.; Smith, G.M.; Thomson, A.G.; Hill, R.A. Coastal saltmarsh managed realignment drives rapid breach inlet and external creek evolution, Freiston Shore (UK). Geomorphology 2014. [Google Scholar] [CrossRef]
- Townend, I.; Pethick, J. Estuarine flooding and managed retreat. Philos. Trans. R. Soc. Lond. 2011, 360, 1477–1495. [Google Scholar] [CrossRef]
- Pontee, N. Impact of managed realignment design on estuarine water levels. Proc. Inst. Civ. Eng. 2015, 168, 48–61. [Google Scholar] [CrossRef]
- French, J.R. Hydrodynamic Modelling of Estuarine Flood Defence Realignment as an Adaptive Management Response to Sea-Level Rise. J. Coast. Res. 2008, 2, 1–12. [Google Scholar] [CrossRef]
- Leggett, D.J.; Cooper, N.; Harvey, R. Coastal and Estuarine Managed Realignment—Design Issues; CIRIA: London, UK, 2004. [Google Scholar]
- Möller, I. Quantifying saltmarsh vegetation and its effect on wave height dissipation: Results from a UK East coast saltmarsh. Estuar. Coast. Shelf Sci. 2006, 69, 337–351. [Google Scholar] [CrossRef]
- Möller, I.; Spencer, T. Wave dissipation over macro-tidal saltmarshes: Effects of marsh edge typology and vegetation change. J. Coast. Res. 2002, 36, 506–521. [Google Scholar] [CrossRef]
- Manning, A.J.; Whitehouse, R.J.S. TR167—Enhanced UK Estuaries Database: Explanatory Notes and Metadata (SiTE P1). Development of Estuary Morphological Models; HR Wallingford: Wallingford, UK, 2012. [Google Scholar]
- Davis, R.A.; Fitzgerald, D.M. Beaches and Coasts, 2nd ed.; Wiley-Blackwell: Hoboken, NJ, USA, 2019; ISBN 0632043083. [Google Scholar]
- Davidson, K.E.; Fowler, M.S.; Skov, M.W.; Doerr, S.H.; Beaumont, N.; Griffin, J.N. Livestock grazing alters multiple ecosystem properties and services in salt marshes: A meta-analysis. J. Appl. Ecol. 2017, 54, 1395–1405. [Google Scholar] [CrossRef]
- Ishak, A.K. Bin Suspended Sediment Dynamics and Flux in the Macrotidal Taf Estuary, South Wales. Ph.D. Thesis, University of Wales, Bangor, UK, 1997. [Google Scholar]
- Bristow, C.; Pile, J. Aberoedd De Cymru Bae Caerfyrddin: Esblygiad Morffoleg Aberol ac Effaith hynny ar Reolaeth ACA South Wales Estuaries Camarthen Bay: Evolution of Estuarine Morphology and Consequences for SAC Management; Countryside Council for Wales: Bangor, UK, 2003. [Google Scholar]
- Pye, K.; Blott, S.J. Coastal Processes and Shoreline Behaviour of Estuary Dominated Systems in Swansea Bay and Carmarthen Bay; Report prepared for Halcrow Group Ltd.; K Pye Associates: Berkshire, UK, 2009. [Google Scholar]
- Halcrow. Lavernock Point to St.Ann’s Head Shoreline Management Plan SMP2; Halcrow: London, UK, 2012. [Google Scholar]
- Jago, C.F. The Sedimentology of Estuarine and Coastal Plain Deposits between Pendine and Wharley Point, Carmarthen Bay; University of London: London, UK, 1974. [Google Scholar]
- Walley, S.S. Holocene Evolution of a Coastal Barrier Complex, Pendine Sands. Ph.D. Thesis, University of Wales, Bangor, UK, 1996. [Google Scholar]
- Bennett, W.G.; Karunarathna, H.; Mori, N.; Reeve, D. Climate Change Impacts on Future Wave Climate around the UK. J. Mar. Sci. Eng. 2016, 4, 78. [Google Scholar] [CrossRef] [Green Version]
- Dissanayake, P.; Brown, J.; Wisse, P.; Karunarathna, H. Effects of storm clustering on beach/dune evolution. Mar. Geol. 2015, 370, 63–75. [Google Scholar] [CrossRef]
- Channel Coastal Observatory - Regional Coastal Monitoring Programmes: Reports. Available online: http://www.channelcoast.org/reports/ (accessed on 21 May 2020).
- Hawkes, P.P.J.; Gouldby, B.P.B.; Tawn, J.A.; Owen, M.W. The joint probability of waves and water levels in coastal engineering design. J. Hydraul. Res. 2002, 40, 241–251. [Google Scholar] [CrossRef]
- Coles, S. An Introduction to Statistical Modeling of Extreme Values; Springer: London, UK, 2001. [Google Scholar]
- Davison, A.C.; Smith, R.L. Models for Exceedances Over High Thresholds. J. R. Stat. Soc. Ser. B 1990, 52, 393–425. [Google Scholar] [CrossRef]
- R Core Team. R: A Language and Environment for Statistical Computing; R Core Team: Vienna, Austria, 2013. [Google Scholar]
- McMillan, A.; Batstone, C.; Worth, D.; Tawn, J.; Horsburgh, K.; Lawless, M. Coastal Flood Boundary Conditions for UK Mainland and Islands; Environment Agency: Bristol, UK, 2011.
- Lesser, G.R.; Roelvink, J.A.; van Kester, J.A.T.M.; Stelling, G.S. Development and validation of a three-dimensional morphological model. Coast. Eng. 2004, 51, 883–915. [Google Scholar] [CrossRef]
- Hu, K.; Chen, Q.; Wang, H. A numerical study of vegetation impact on reducing storm surge by wetlands in a semi-enclosed estuary. Coast. Eng. 2015, 95, 66–76. [Google Scholar] [CrossRef]
- Hu, K.; Chen, Q.; Wang, H.; Hartig, E.K.; Orton, P.M. Numerical Modeling of Salt Marsh Morphological Change Induced by Hurricane Sandy. Coast. Eng. 2018, 132, 63–81. [Google Scholar] [CrossRef]
- Best, S.N.; Van der Wegen, M.; Dijkstra, J.; Willemsen, P.W.J.M.; Borsje, B.W.; Roelvink, D.J.A. Do salt marshes survive sea level rise? Modelling wave action, morphodynamics and vegetation dynamics. Environ. Model. Softw. 2018, 109, 152–166. [Google Scholar] [CrossRef]
- Dalrymple, R.A.; Kirby, T.; Hwang, P.A. Wave Diffraction Due to Areas of Energy Dissipation. J. Waterw. Port Coast. Ocean Eng. 1984, 110, 67–79. [Google Scholar] [CrossRef]
- Ashall, L.M.; Mulligan, R.P.; Van Proosdij, D.; Poirier, E. Application and validation of a three-dimensional hydrodynamic model of a macrotidal salt marsh. Coast. Eng. 2016, 114, 35–46. [Google Scholar] [CrossRef]
- Deltares. Delft3D-WAVE. Simulation of Short-Crested Waves with Swan. User Manual; Deltares: Delft, The Netherlands, 2019. [Google Scholar]
- Tanino, Y.; Nepf, H.M. Laboratory Investigation of Mean Drag in a Random Array of Rigid, Emergent Cylinders. J. Hydraul. Eng. 2008, 134, 34–41. [Google Scholar] [CrossRef]
- van Veelen, T.J.; Fairchild, T.P.; Reeve, D.E.; Karunarathna, H. Experimental study on vegetation flexibility as control parameter for wave damping and velocity structure. Coast. Eng. 2020, 157, 103648. [Google Scholar] [CrossRef]
- Marciano, R.; Wang, Z.B.; Hibma, A.; de Vriend, H.J.; Defina, A. Modeling of Channel Patterns in Short Tidal Basins. J. Geophys. Res. Earth Surf. 2005, 110. [Google Scholar] [CrossRef] [Green Version]
- Mariotti, G.; Canestrelli, A. Long-Term Morphodynamics of Muddy Backbarrier Basins: In or Empty Out? Water Resour. Res. 2017, 53, 7029–7054. [Google Scholar] [CrossRef]
- Nash, J.E.; Sutcliffe, J.V. River flow forecasting through conceptual models part I—A discussion of principles. J. Hydrol. 1970, 10, 282–290. [Google Scholar] [CrossRef]
- Cousins, N.; Chung, P.; Coutts, H.; Doody, P.; McCue, J. Identifying Biodiversity Opportunities to Inform the Shoreline Management Review (SMP2) –Carmarthen Bay Estuaries; Countryside Council for Wales: Bangor, UK, 2008. [Google Scholar]
- Morris, R.K.A. Managed realignment as a tool for compensatory habitat creation—A re-appraisal. Ocean Coast. Manag. 2013, 73, 82–91. [Google Scholar] [CrossRef]
- Wolters, M.; Garbutt, A.; Bakker, J.P. Salt-marsh restoration: Evaluating the success of de-embankments in north-west Europe. Biol. Conserv. 2005, 123, 249–268. [Google Scholar] [CrossRef]
- Wamsley, T.V.; Cialone, M.A.; Smith, J.M.; Atkinson, J.H.; Rosati, J.D. The potential of wetlands in reducing storm surge. Ocean Eng. 2010, 37, 59–68. [Google Scholar] [CrossRef]
- Palmer, M.; Howard, T.; Tinker, J.; Lowe, J.; Bricheno, L.; Calvert, D.; Gregory, J.; Harris, G.; Krijnen, J.; Pickering, M.; et al. UKCP18 Marine Report; Met Office Hadley Centre: Exeter, UK, 2018. [Google Scholar]
- Monbet, P. Mass balance of lead through a small macrotidal estuary: The Morlaix River estuary (Brittany, France). Mar. Chem. 2006, 98, 59–80. [Google Scholar] [CrossRef]
- Selleslagh, J.; Amara, R. Environmental factors structuring fish composition and assemblages in a small macrotidal estuary (Eastern English Channel). Estuar. Coast. Shelf Sci. 2008, 79, 507–517. [Google Scholar] [CrossRef]
- Hayami, Y.; Wada, M.; Umezawa, Y.; Fujii, N.; Nakamura, A.; Mori, F. Hypoxic water mass in the highly turbid well-mixed macrotidal Rokkaku. Estuar. Coast. Shelf Sci. 2019, 219, 210–222. [Google Scholar] [CrossRef]


| Parameter | Average Storm | 1 in 1 Year | 1 in 10 Year | 1 in 50 Year | 1 in 100 Year | (s) | |
|---|---|---|---|---|---|---|---|
| Significant Wave Height (m) | 3.37 | 5.13 | 6.94 | 8.15 | 8.66 | 225 | 6.82 |
| Wind Speed (m/s) | 16.75 | 24.59 | 26.64 | 27.15 | 27.27 | ||
| Easterly Wind Speed (m/s) | 12.21 | 13.21 | 15.06 | 16.28 | 16.28 |
| Parameter | Average Storm | 1 in 1 Year | 1 in 10 Year | 1 in 50 Year | 1 in 100 Year |
|---|---|---|---|---|---|
| Peak Storm Water Level (m) | 4.35 | 5 | 5.26 | 5.43 | 5.51 |
| Storm Condition | Peak Storm Water Level (m) | Peak Storm Wave Height (m) | Peak Storm Wind Speed (m/s) | Predominant Wind Direction (Degrees) |
|---|---|---|---|---|
| South Westerly Storm | 5.43 | 8.15 | 27.15 | 225 |
| Easterly Storm | 4.35 | 3.37 | 16.28 | 90 |
| Parameter | Symbol | Value | Unit | Motivation |
|---|---|---|---|---|
| Plant Width | 2.58 * | mm | From field campaign | |
| Plant Height | 34 | mm | From field campaign | |
| Plant Density | 2275 | From field campaign | ||
| Drag Coefficient | 1.0 | - | Tanino and Nepf [56]; van Veelen et al [57] | |
| Bed roughness | 65 | Marciano et al [61] | ||
| River discharge | 60 | Ishak [38] | ||
| Water density | 1025 | Well-mixed estuary | ||
| Horizontal eddy viscosity | 1 | Mariotti and Canestrelli [62] |
| Parameter | Intervention | ||
|---|---|---|---|
| Defended | Managed Realignment | Grazed | |
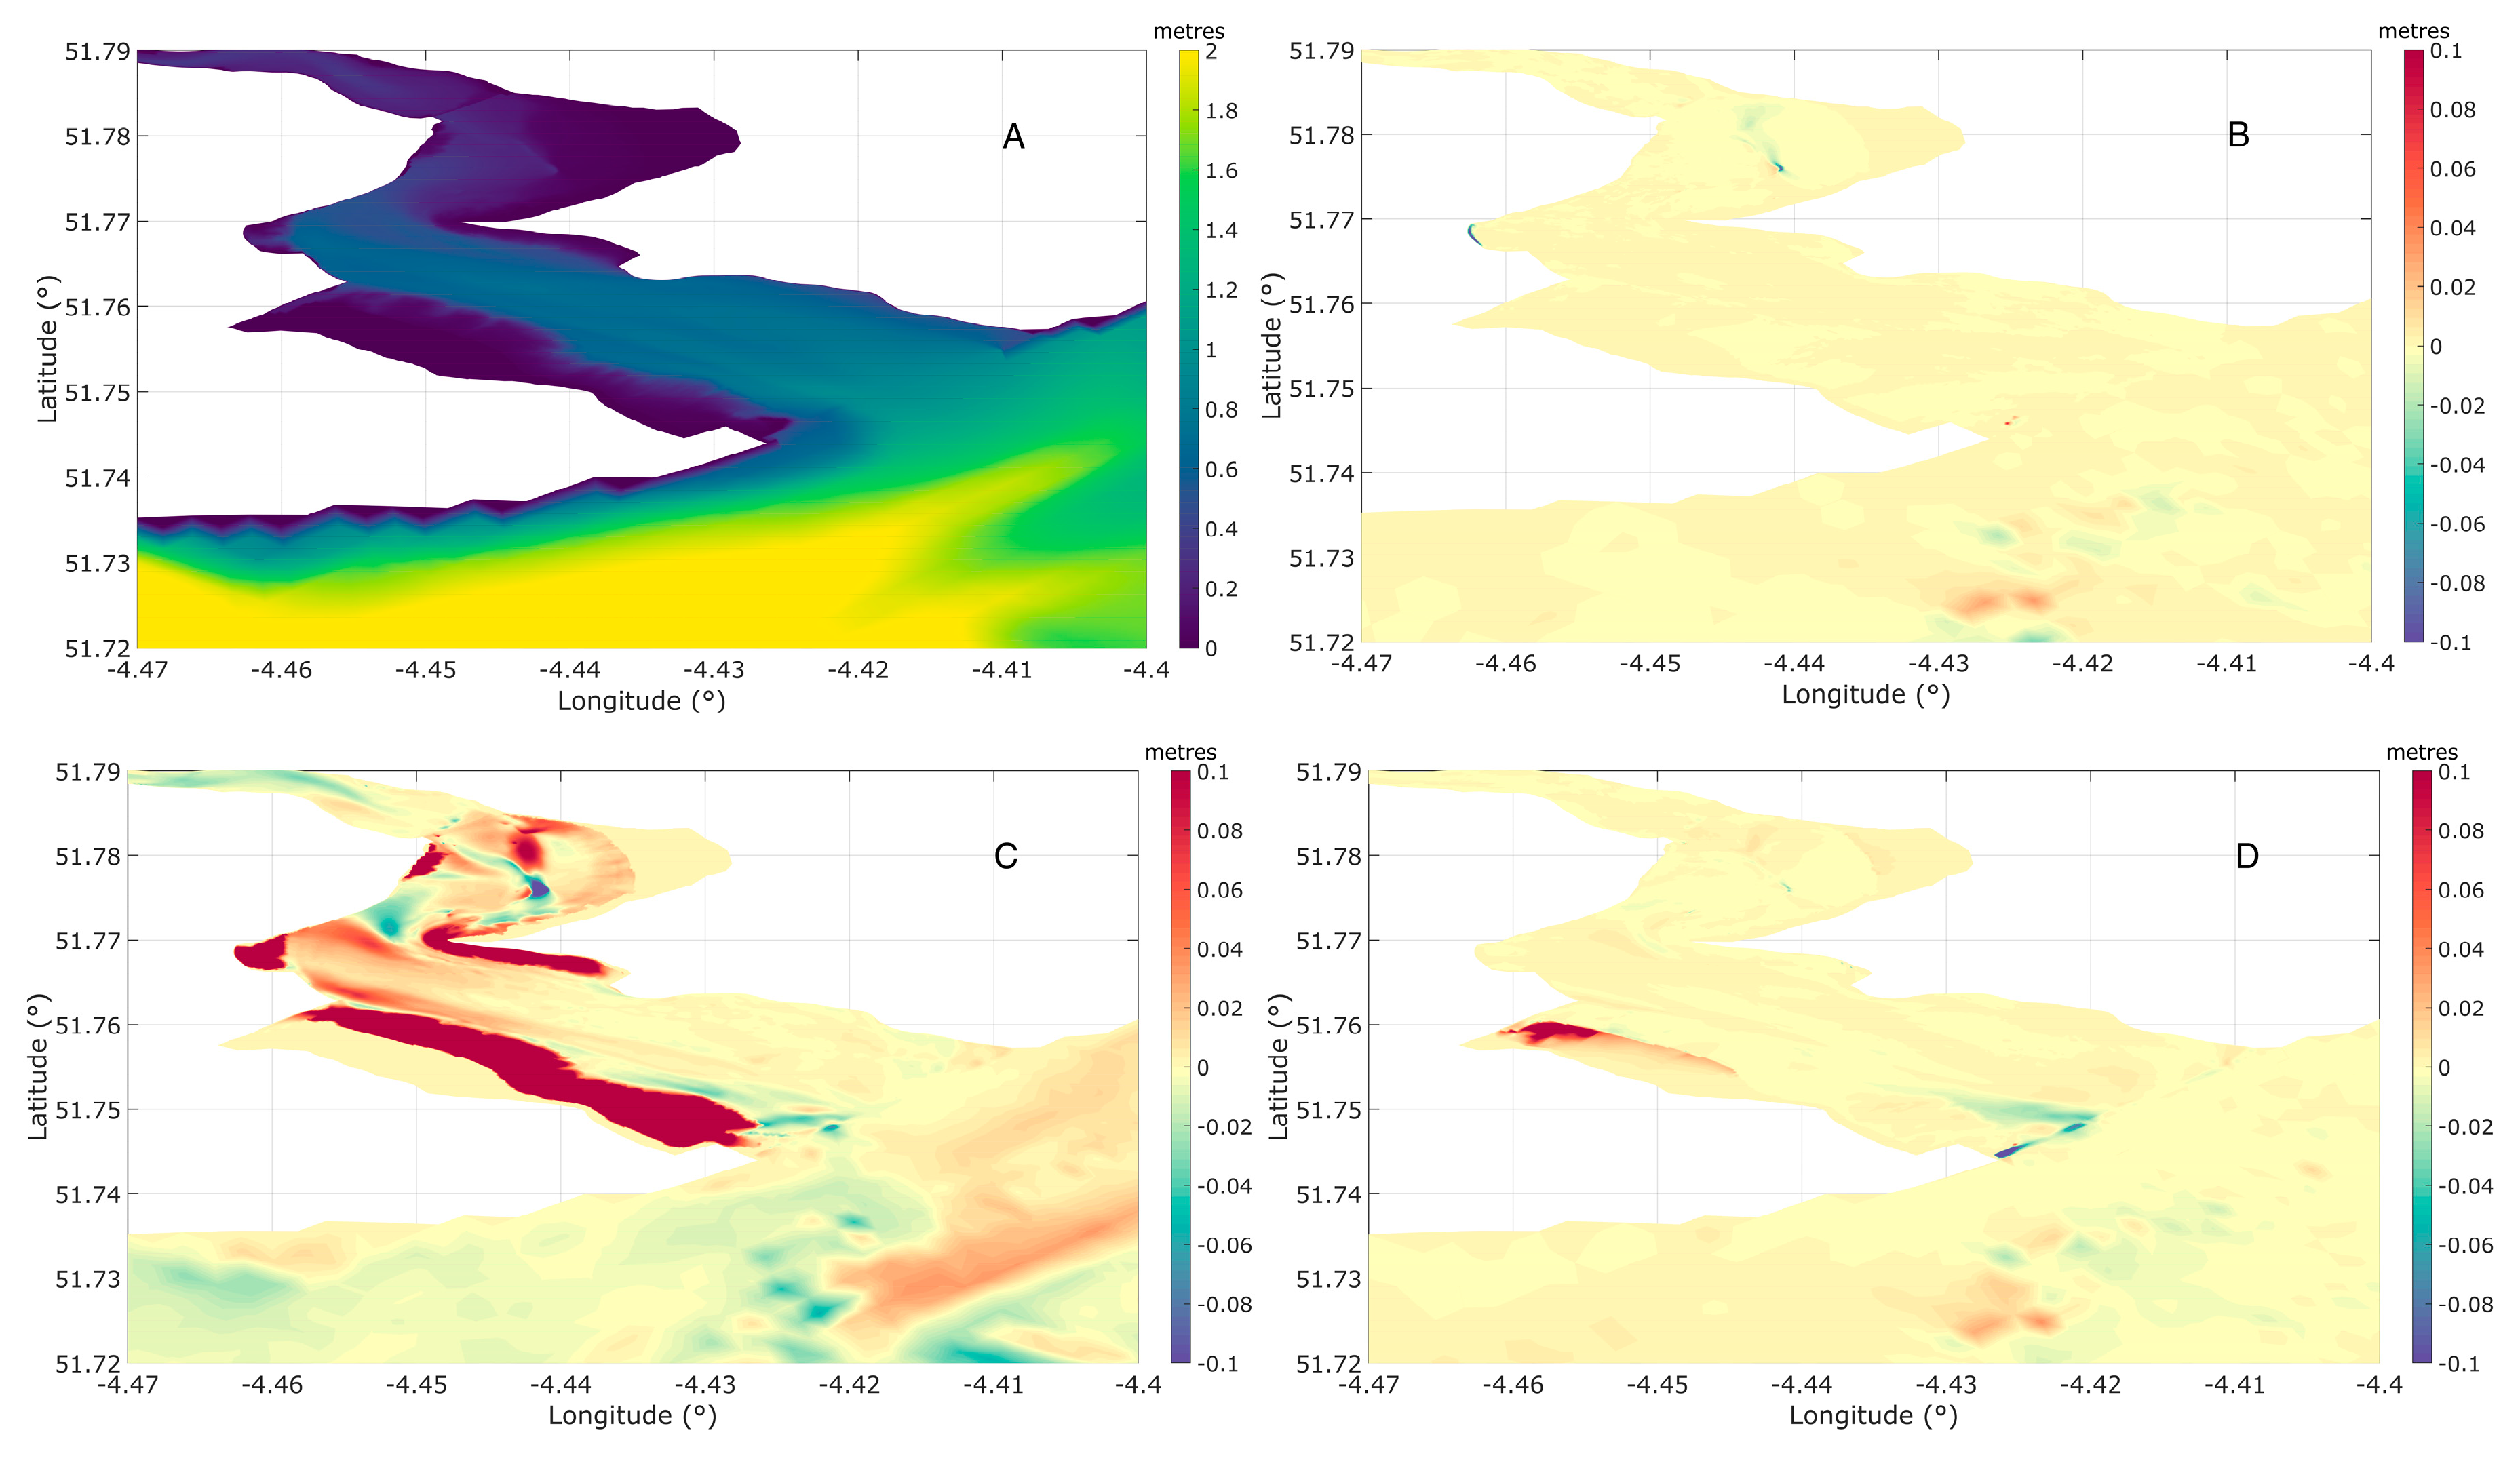
| Water Level | Reduction in water level behind defence, no widespread change | Increase in water level at both realignment sites, slight reduction in water level near breach locations | Small reduction in water level throughout the estuary |
| Wave Height | No change | Small-scale changes from waves generated in the managed realignment sites | Widespread differences with increases in wave height pronounced over marsh areas |
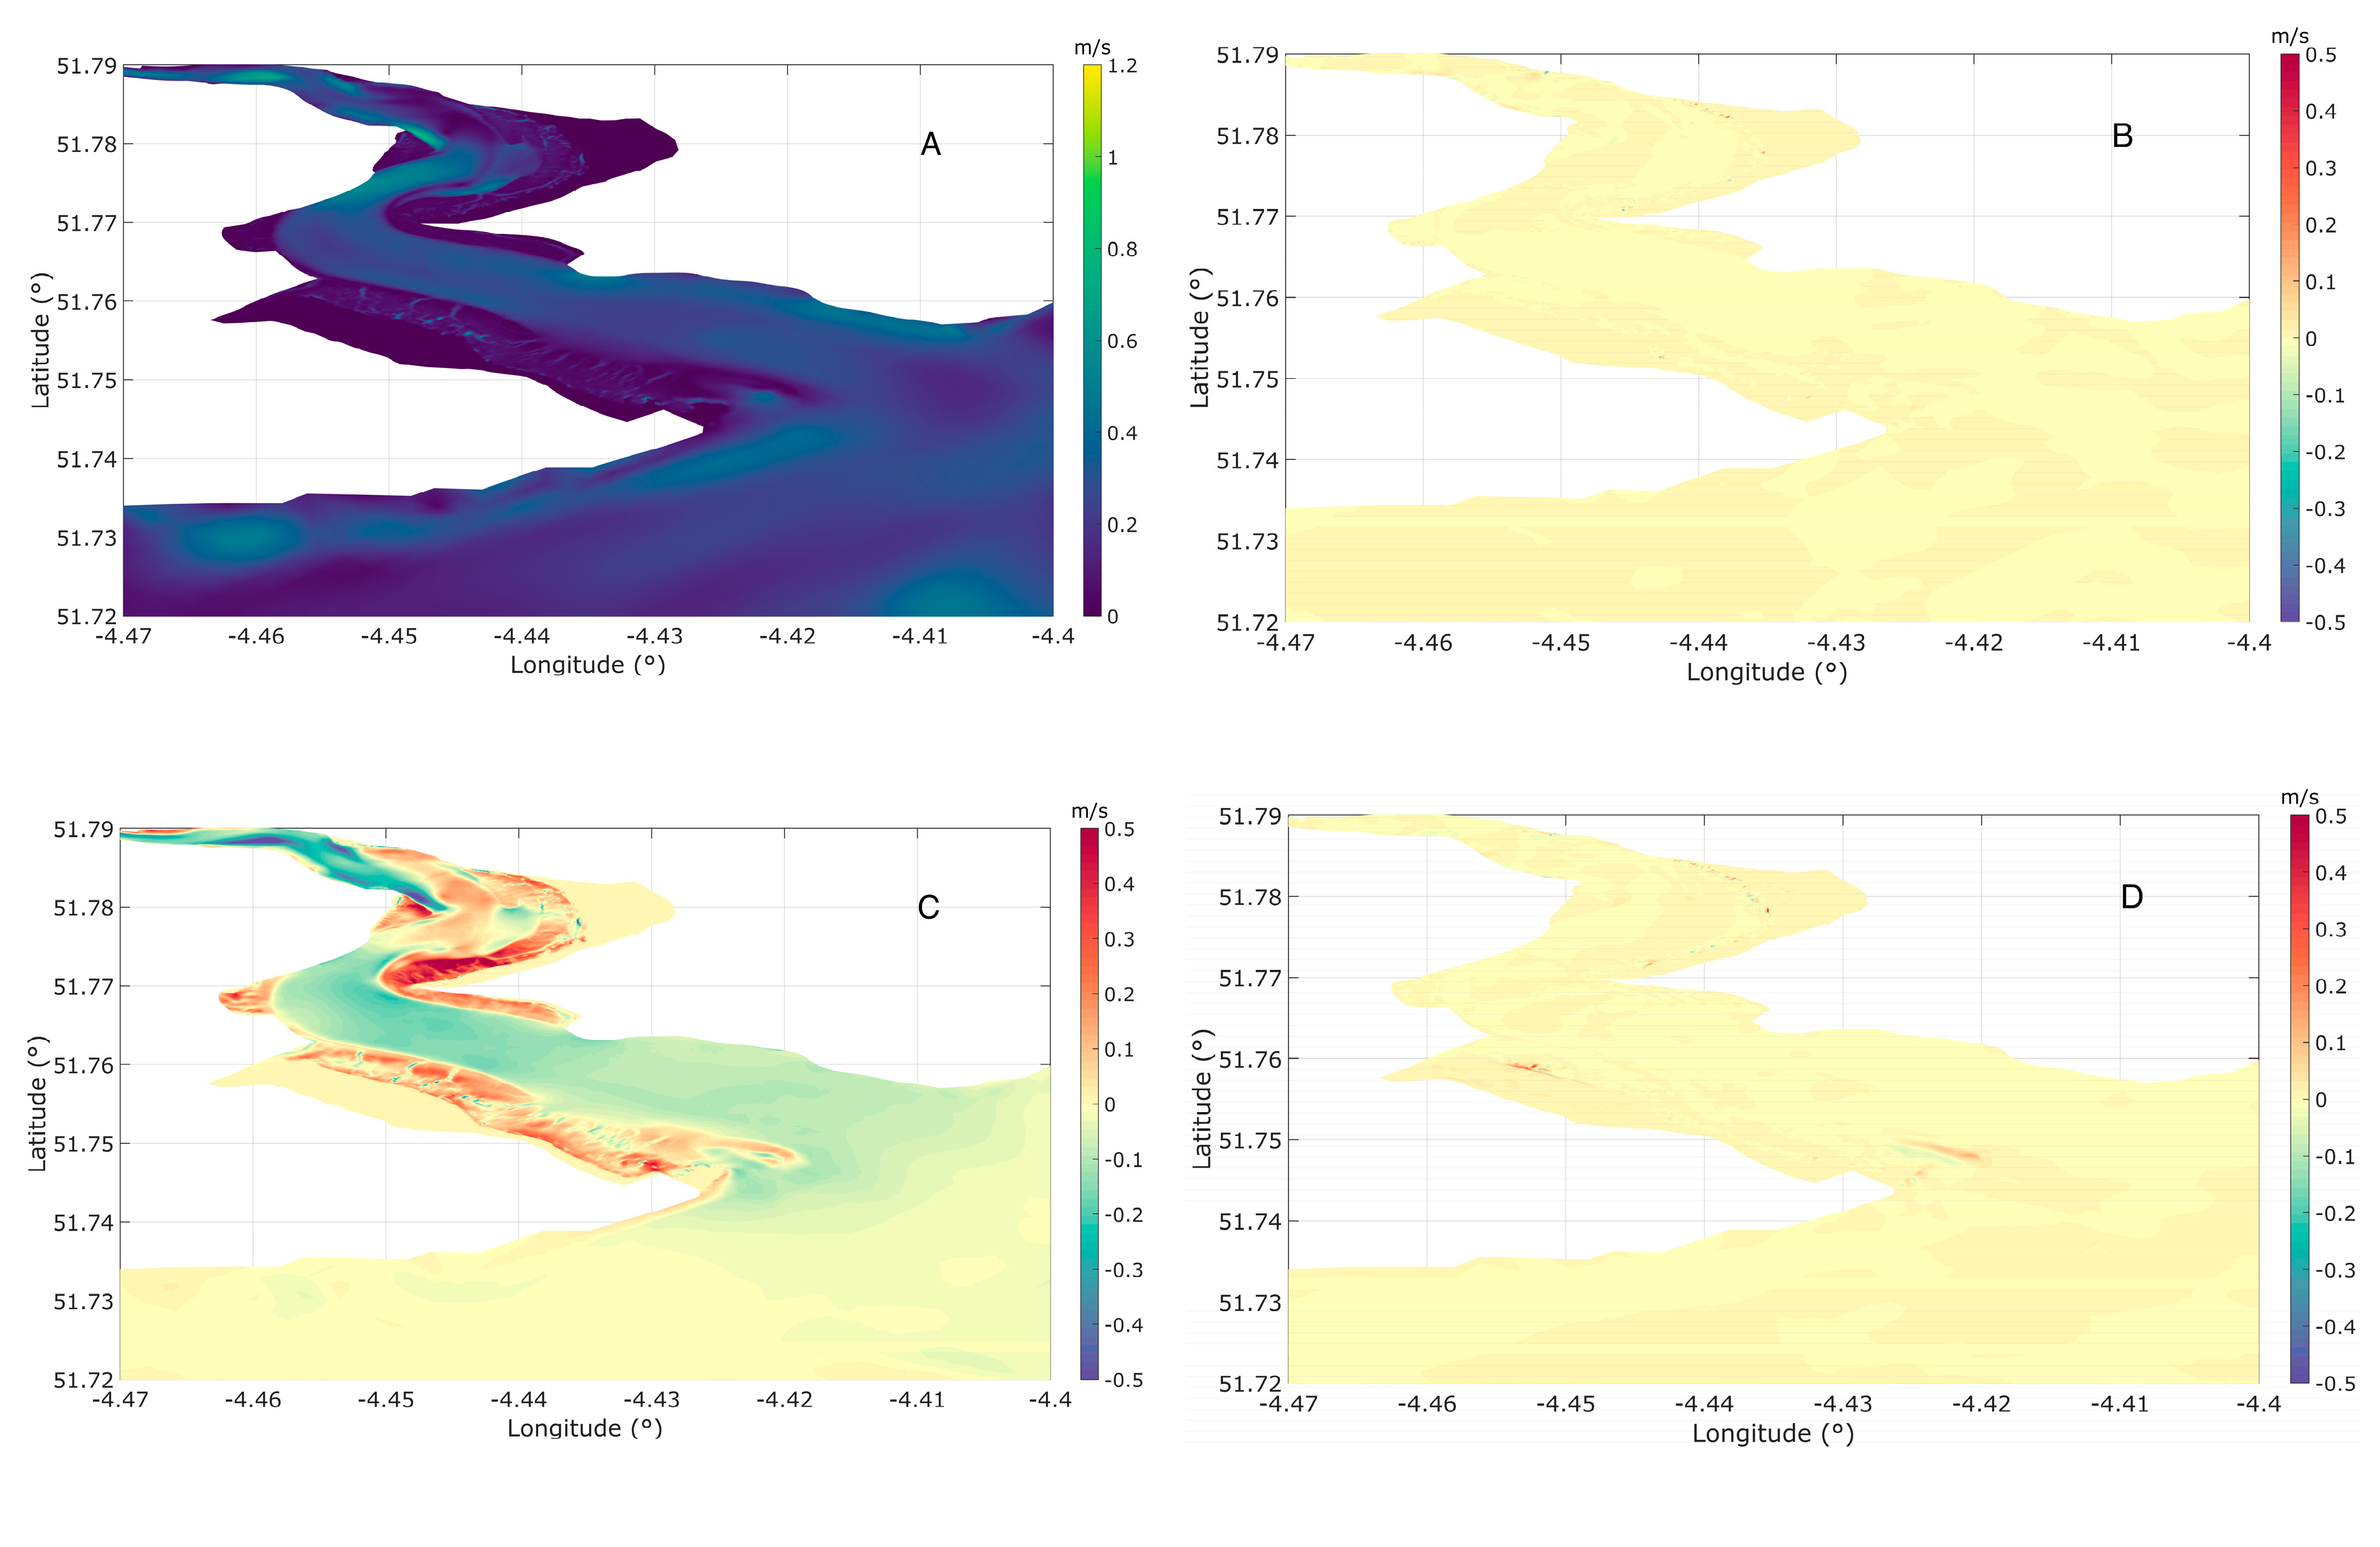
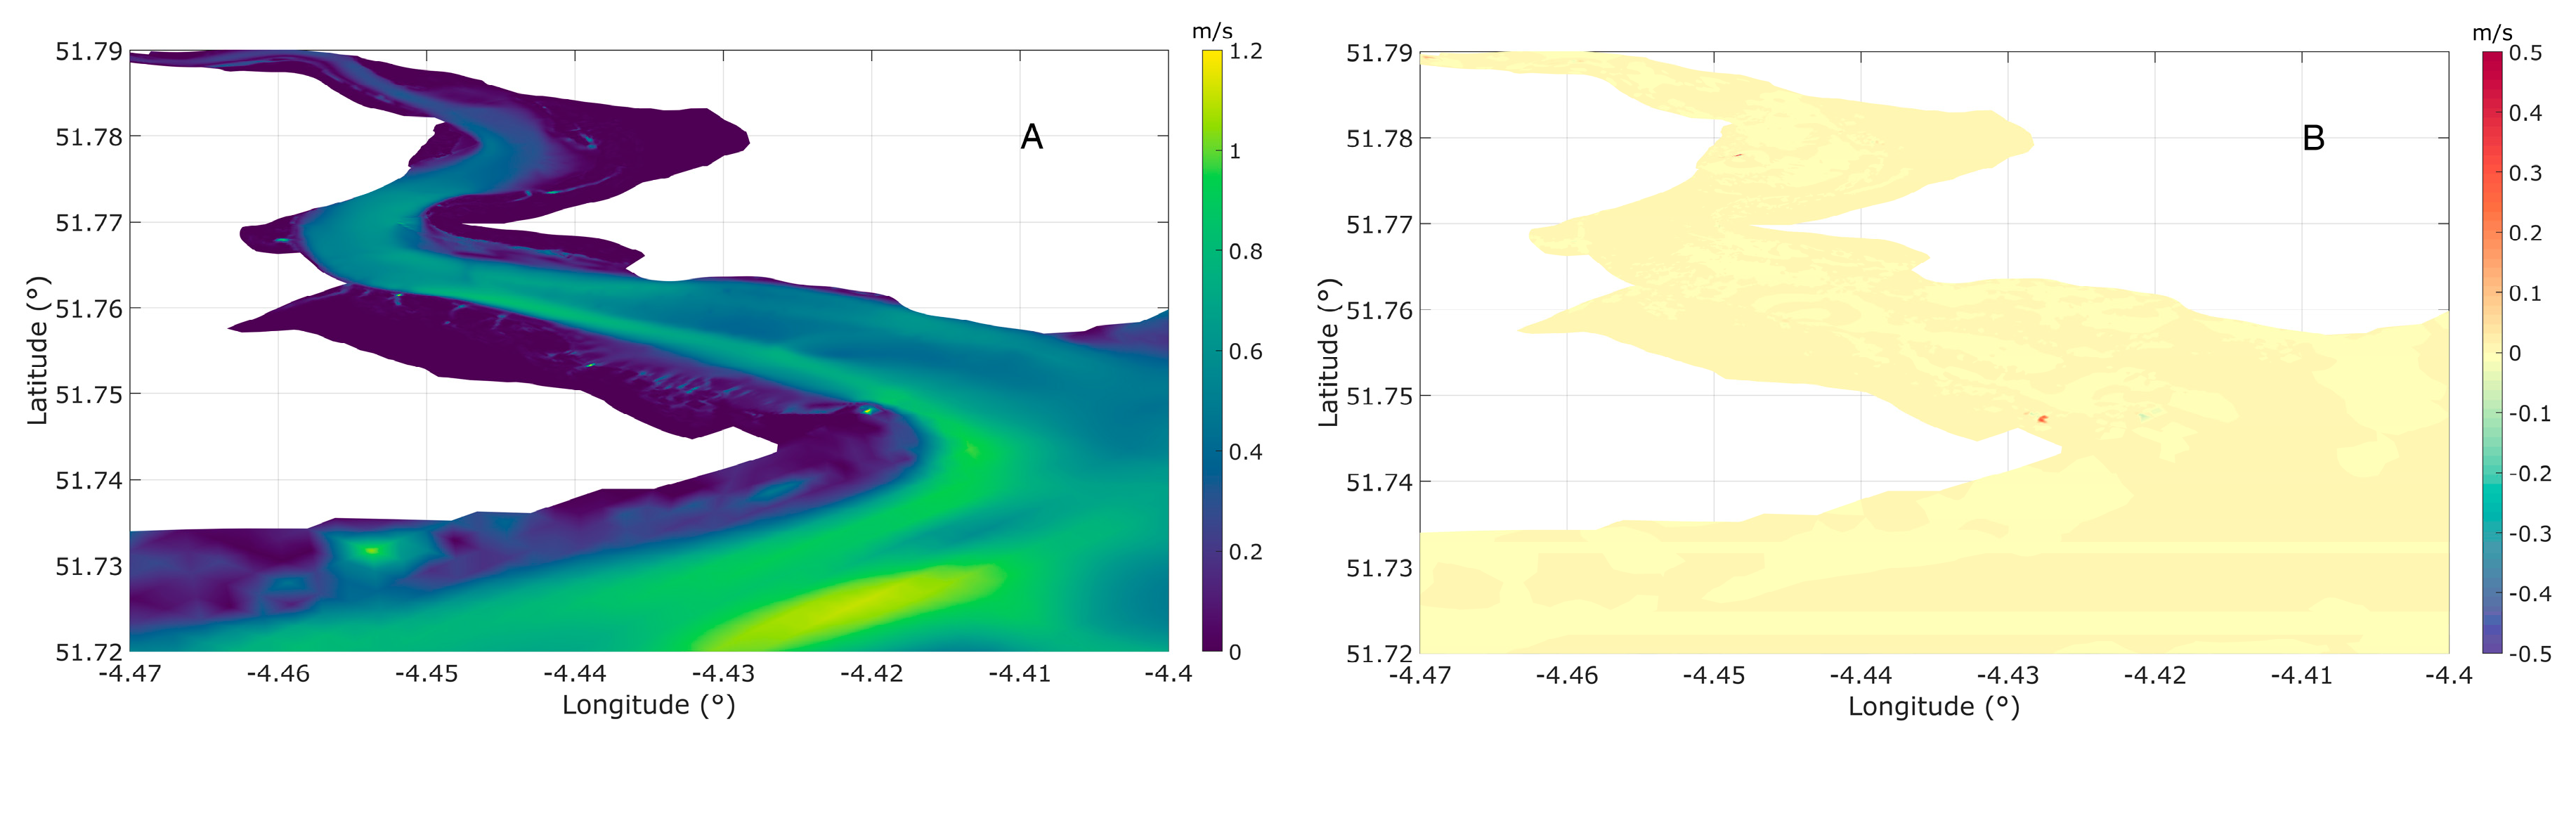
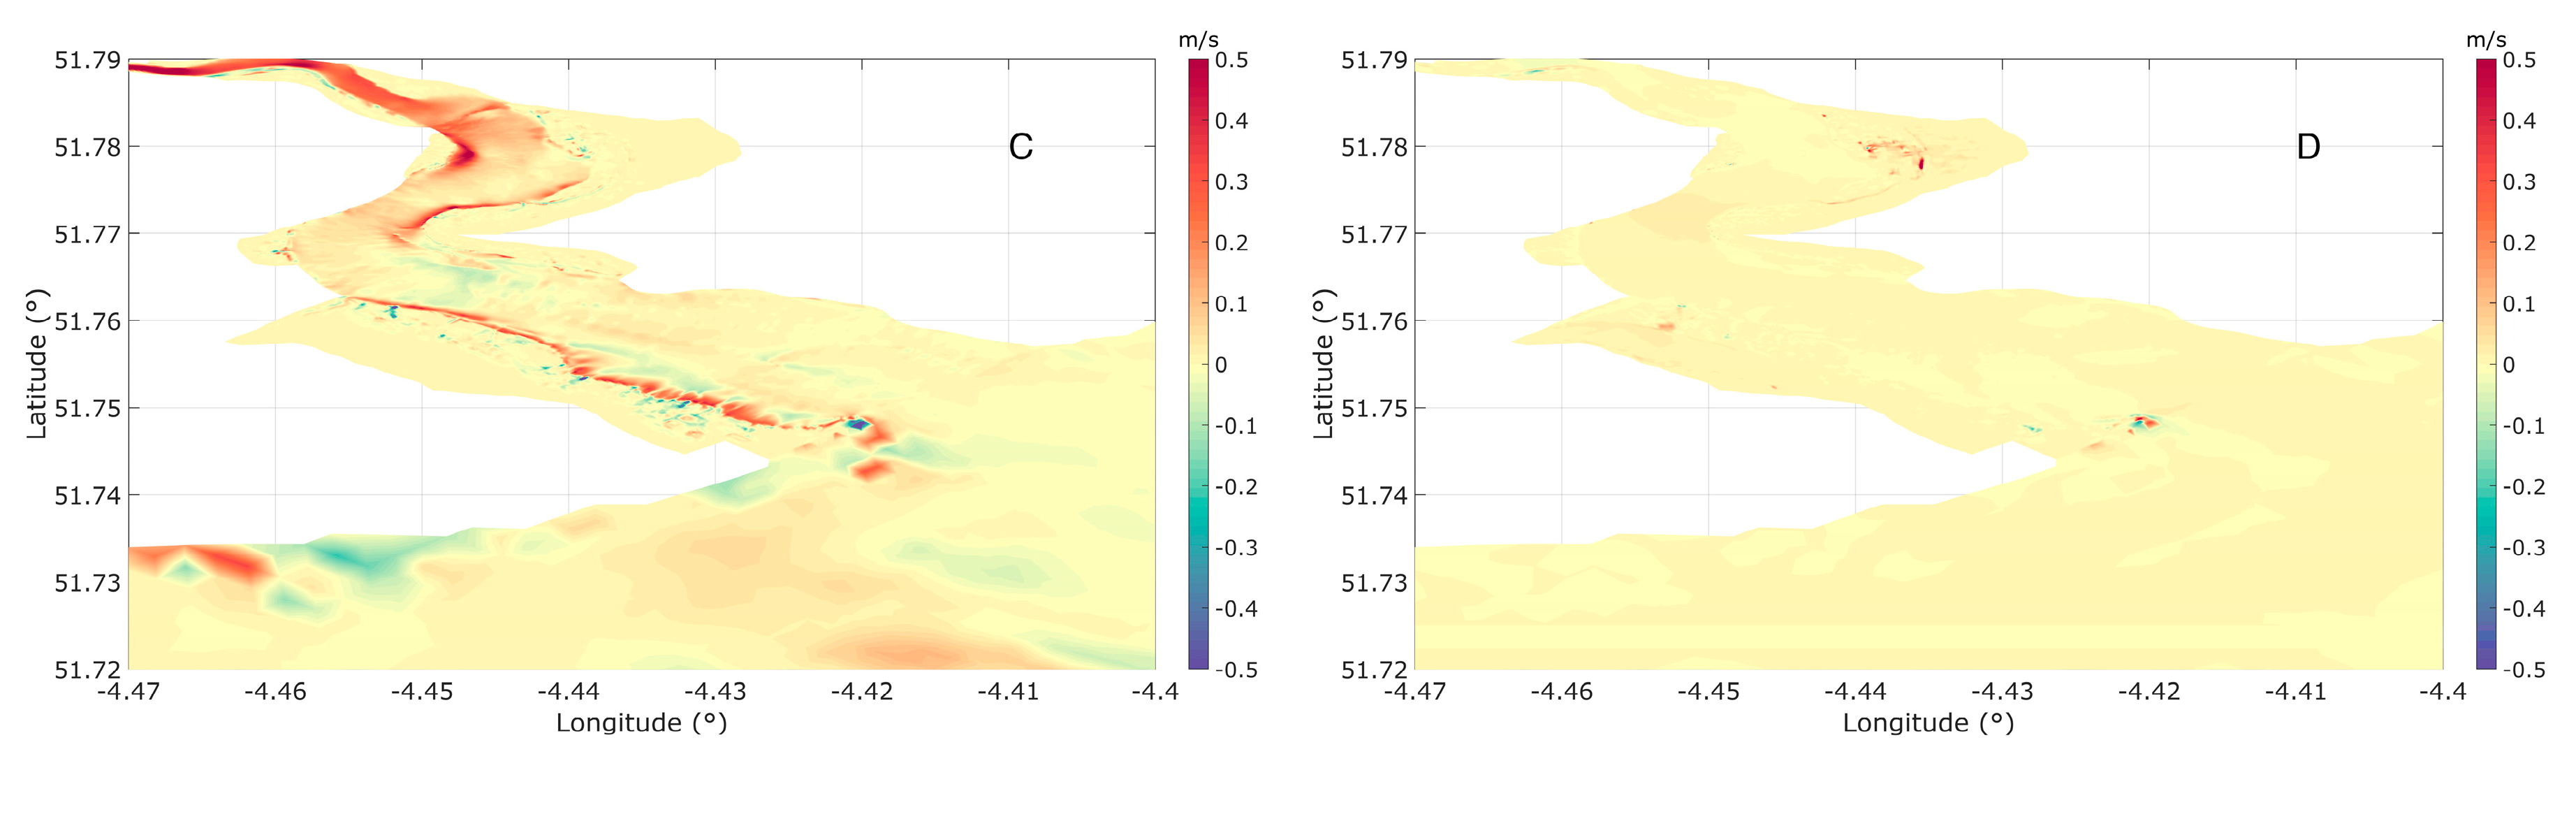
| Current | No change | Increases limited to the two breach sites and within the managed realignment sites | Currents increased over marsh areas, with a corresponding decrease in flow within the main channel |
© 2020 by the authors. Licensee MDPI, Basel, Switzerland. This article is an open access article distributed under the terms and conditions of the Creative Commons Attribution (CC BY) license (http://creativecommons.org/licenses/by/4.0/).
Share and Cite
Bennett, W.G.; van Veelen, T.J.; Fairchild, T.P.; Griffin, J.N.; Karunarathna, H. Computational Modelling of the Impacts of Saltmarsh Management Interventions on Hydrodynamics of a Small Macro-Tidal Estuary. J. Mar. Sci. Eng. 2020, 8, 373. https://doi.org/10.3390/jmse8050373
Bennett WG, van Veelen TJ, Fairchild TP, Griffin JN, Karunarathna H. Computational Modelling of the Impacts of Saltmarsh Management Interventions on Hydrodynamics of a Small Macro-Tidal Estuary. Journal of Marine Science and Engineering. 2020; 8(5):373. https://doi.org/10.3390/jmse8050373
Chicago/Turabian StyleBennett, William G., Thomas J. van Veelen, Tom P. Fairchild, John N. Griffin, and Harshinie Karunarathna. 2020. "Computational Modelling of the Impacts of Saltmarsh Management Interventions on Hydrodynamics of a Small Macro-Tidal Estuary" Journal of Marine Science and Engineering 8, no. 5: 373. https://doi.org/10.3390/jmse8050373