


1. Introduction
The biggest uncertainty in our ability to predict future sea level rise comes from the polar ice sheets. This fact is particularly important and pertinent because sea level rise from ice sheets is increasing faster than expected and because ice-sheet processes have the potential to trigger irreversible sea level rise that would continue for many centuries (Oppenheimer and others, Reference Oppenheimer and Pörtner2019). Reducing this uncertainty is currently one of the biggest challenges in glaciology. However, our ability to achieve this is limited for a number of reasons, two of which concern ice-sheet physics and ice-sheet history.
Ice sheets are drained predominantly by fast-flowing ice streams and glaciers, and these form an integral component of the whole ice-sheet system. Although ice streams are the principal ice-sheet volume regulators, their dynamics are still not fully understood. Knowledge of the ice stream basal boundary, including the nature of the bed and the processes operating there, is still incomplete. As a result, models lack a definitive, physically based basal boundary condition.
Over the past few million years, climate has been both colder and warmer than today, providing an analogue for ice-sheet response to future warming. However, knowledge of the varying extent of the Antarctic Ice Sheet during the Quaternary glacial–interglacial cycles remains incomplete. As the past history of the ice sheet is typically used to calibrate, check and test ice-sheet models, this lack of knowledge limits the degree of certainty we can place on the projections that these same models then make of ice-sheet behaviour into the future, and of the subsequent impact on sea level.
One way to improve our understanding of ice stream basal processes and former ice-sheet history is to access the ice-sheet bed. Unfortunately, for most of the Antarctic Ice Sheet this is exceptionally difficult to achieve due to remoteness, the thickness of the ice and the considerable logistics required to overcome these two factors. As a result, ice stream beds have been accessed in very few locations and observational data to support ice-sheet models remain extremely sparse.
2. The BEAMISH Project
The aim of the BEAMISH Project is to improve our knowledge of ice-sheet physics and history by accessing the bed of an Antarctic ice stream using a hot-water drill. Access to the bed allows observations of basal conditions and processes, as well as the retrieval of subglacial material from which the shallow subglacial geology, the nature of the ice–bed interface and potentially evidence for past ice configuration can be determined. The project also includes a suite of geophysical surveys, primarily in support of the borehole observations.
The chosen location was Rutford Ice Stream (Fig. 1), one of the fast-flowing ice streams that drain part of the West Antarctic Ice Sheet into the Ronne Ice Shelf and ultimately, to the ocean. In the region where the fieldwork was conducted, the ice stream is ~25 km wide, 2100–2200 m thick and is flowing at 377 m a−1 (Murray and others, Reference Murray, Smith, King and Weedon2007). This ice stream was chosen for two main reasons: first, the considerable amount of data which already exist from satellite, airborne and especially, ground-based observations, allowing optimum access locations to be decided and giving a broad regional understanding within which to interpret the bed-access results; second, this area of Antarctica has very little data on ice-sheet history, especially that associated with Quaternary glacial–interglacial cycles (Bentley and others, Reference Bentley2010; Hein and others, Reference Hein, Fogwill, Sugden and Xu2011).
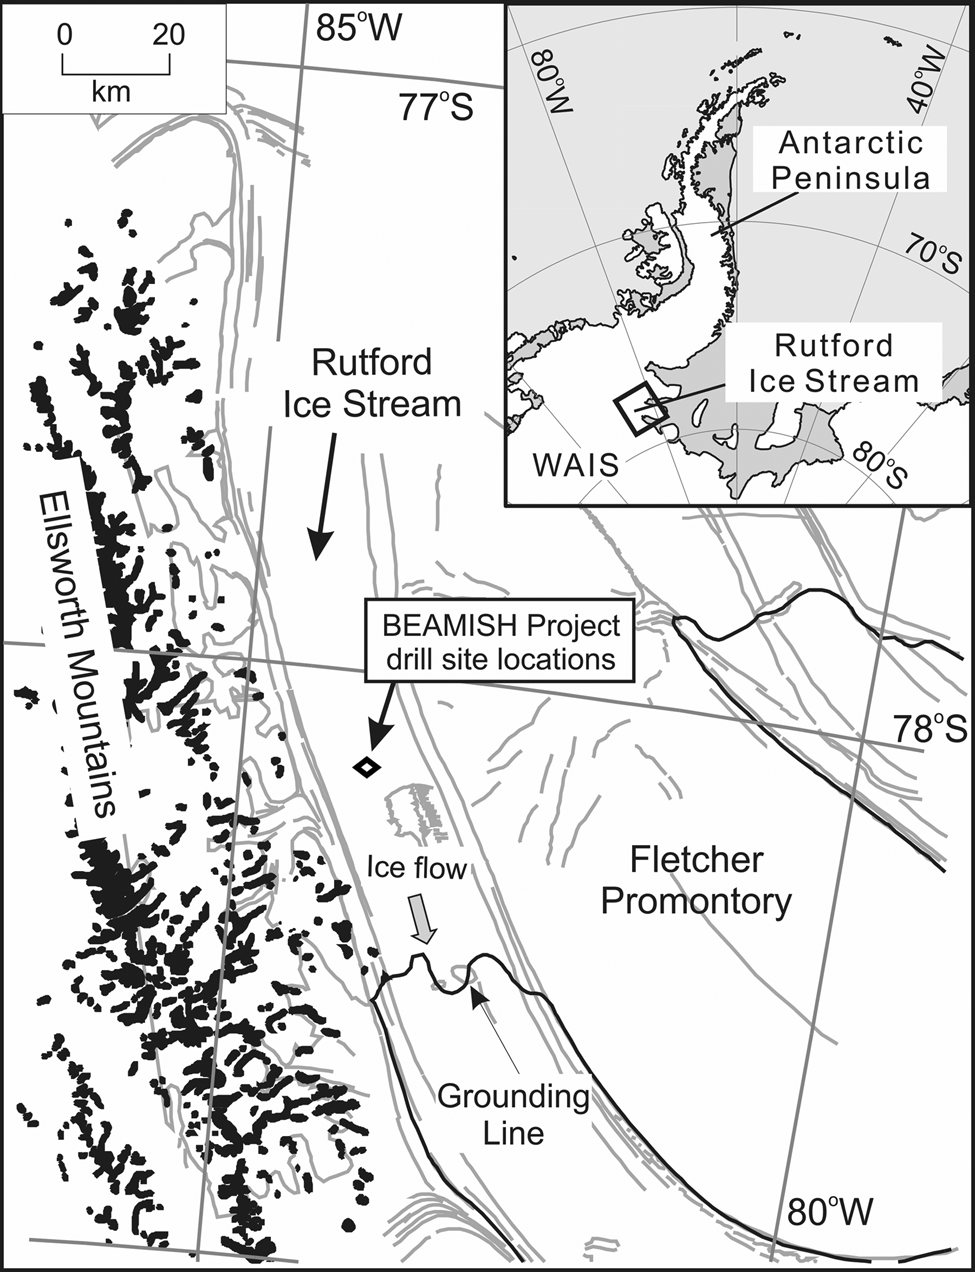
Fig. 1. Location map.
Rutford Ice Stream has been the location of on-going research for ~40 years (e.g. Doake and others, Reference Doake, Alley and Bindschadler2001). Of particular relevance are geophysical surveys carried out to study the ice stream bed. Seismic and radar surveys have shown a subglacial landscape dominated by elongated bedforms (drumlins and mega-scale subglacial lineations; King and others, Reference King, Hindmarsh and Stokes2009) composed of high-porosity, soft water-saturated sediments (Smith and Murray, Reference Smith and Murray2009). The interpreted high porosity suggests that the sediments have been deformed and dilated, and are likely to be still actively deforming at present. In the area chosen for the BEAMISH Project, a geological boundary outcrops at the bed with a transition from these very soft sediments, to more-compacted sedimentary material downstream of the boundary. This harder sediment bed exhibits a far more hummocky and much less streamlined subglacial landscape (Fig. 2; King and others, Reference King, Pritchard and Smith2016).
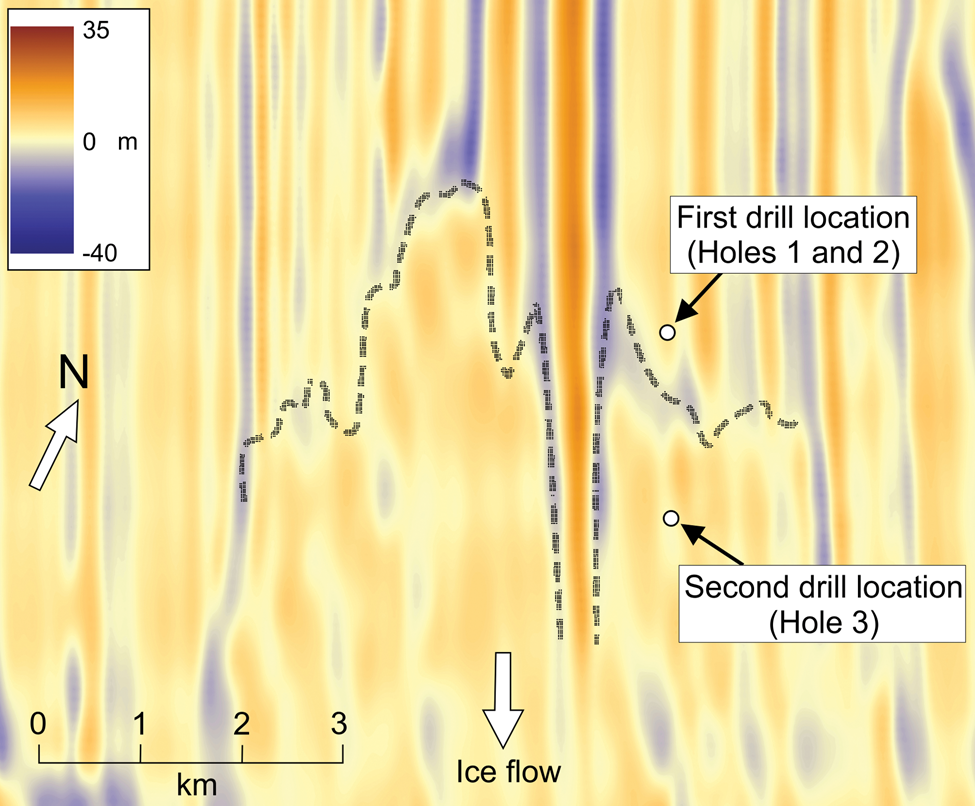
Fig. 2. Bed topography and location of drill sites. The grey-dashed line shows the boundary between different basal conditions in the central part of the area. Colours show the residual bed topography derived by removing the large-scale variations (2 km × 2 km smoothing; King and others, Reference King, Pritchard and Smith2016), to emphasise the transition in the subglacial landscape from elongated bedforms upstream to less streamlined, more hummocky terrain downstream.
An earlier attempt to access the ice stream bed at this location, also by hot-water drilling, was made in 2004/05 (Smith, Reference Smith2005). Twice, a depth of ~2000 m was successfully reached but a technical failure of the drill precluded further penetration and bed access was not achieved. Since then, no better alternative location to access an ice stream bed had been identified; hence, Rutford Ice Stream was the chosen location for the BEAMISH Project.
The remote field location, combined with the amount of equipment and fuel needed for the project, required some time to input to the chosen field site. Input began in early 2010 and over the following years, a total of ~25 tonnes of drilling equipment and ~45 000 L of fuel (avtur and petrol), as well as a considerable amount of vehicle and camp infrastructure and geophysical equipment, were delivered to the site for the project by a combination of aircraft and tractor operations. Two seasons of site-survey surface geophysics were undertaken in 2016/17 and 2017/18; initial drill testing was also done in 2017/18; bed-access drilling was finally completed in 2018/19, along with further surface geophysical surveys.
The overall fieldwork plan for the BEAMISH Project was to access the ice stream bed at two chosen locations using a hot-water drill. Instruments would be installed in the ice column and the bed, and samples of bed sediment retrieved. A team of up to 12 (but mostly 11) people took part in the main BEAMISH field campaign between November 2018 and February 2019. Between the first input flight and the final uplift flight was a period of 107 d. Bad weather halted work for a considerable proportion of December, but outside that period, the poor weather that was experienced tended only to slow, rather than halt activities. Three new seismic reflection lines (Fig. 3) were acquired to finalise the drill sites and also to confirm that no recent changes in the basal conditions (Smith and others, Reference Smith2007) could be detected since the previous surveys, on which the provisional hole locations had been based.
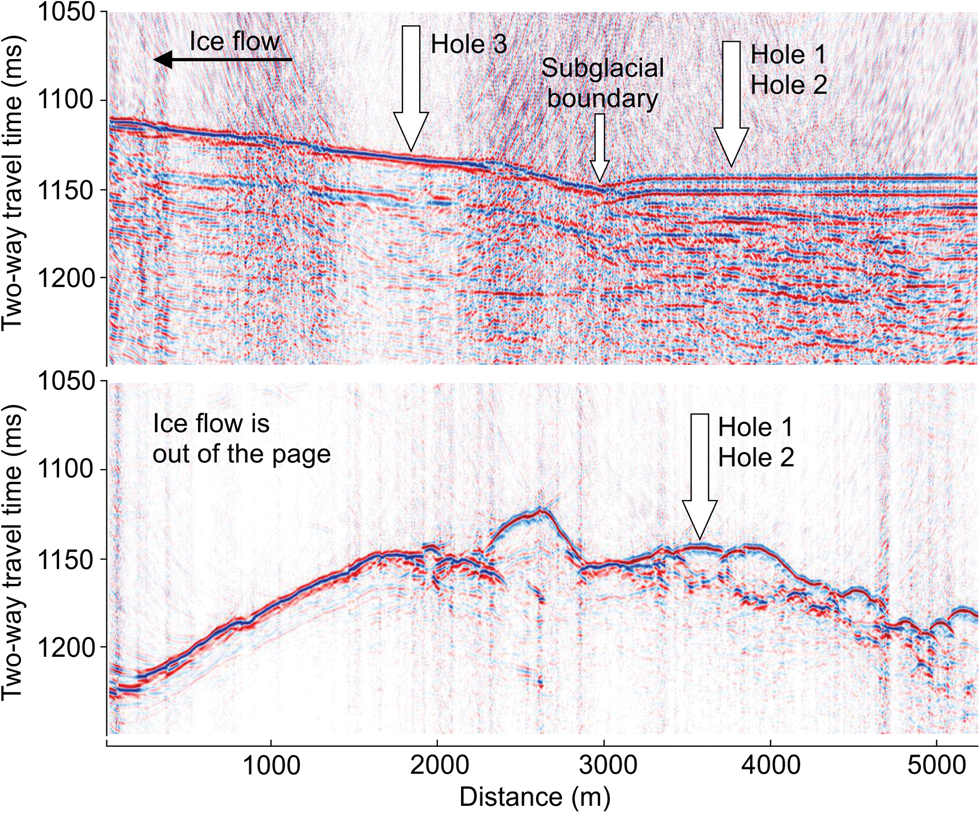
Fig. 3. Two of the seismic reflection sections showing the locations on the ice stream bed accessed by the drill holes. Vertical arrows show the hole locations and also mark the intersections of the seismic lines. The upper panel is the along-flow line and the lower panel is one of the two cross-flow lines.
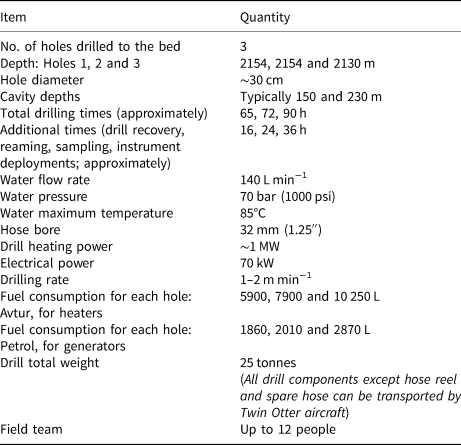
Once the first drill site was confirmed, the main camp and the hot-water drill were erected and assembled around this location. Details of the BEAMISH hot-water drill and its operation are given in Anker and others (Reference Anker, Makinson, Nicholls and Smith2021) and its main specifications are summarised in Table 1. The first access location was upstream of the subglacial boundary, in the area dominated by drumlins and mega-scale glacial lineations – elongated, flow-parallel ridges of soft, high-porosity, water-saturated sediments. The largest subglacial bedforms were avoided as perhaps not representing typical subglacial conditions and processes. The first two access holes were located on top of a wide (350 m) and low (17 m) ridge, ~0.75 km upstream of the subglacial boundary (Figs 2 and 3).
Table 1. Drill and drilling summary (for full details, see Anker and others, Reference Anker, Makinson, Nicholls and Smith2021)
Two holes and associated work were completed at the first location. The entire drill and camp were then moved and re-erected at a second site, ~2 km downstream from the first. This second site was ~1.25 km downstream of the subglacial boundary, in a shallow depression in the bed. One borehole was drilled there. The aim of moving to the second site was to investigate a region of the ice stream bed with different characteristics. A summary of the relevant measurements and samples from all the drilling and borehole work is given in Table 2. All instruments deployed permanently in the boreholes (instrument string and subglacial plough; Table 2) transmit their data to loggers at the surface. Data logging continued over the 2019 winter and beyond, although the number of active instruments decreases with time. Some data are transmitted to the UK via satellite and a site re-visit in late 2019 recovered all the logged data.
Table 2. Summary of activities in the three boreholes
3. Description of drilling and borehole activities: Hole 1
The first hole to the bed of Rutford Ice Stream was drilled at a location where the seismic surveys indicated the presence of very soft, high-porosity water-saturated sediments that might also be actively deforming with the movement of the overriding ice (Smith, Reference Smith1997). Total drilling time, from starting to create the sub-surface cavity (see Anker and others, Reference Anker, Makinson, Nicholls and Smith2021) to breakthrough at the glacier bed was 65 h. During drilling, samples of the drill water being returned from the cavity back to the surface were taken at drill depth intervals of ~250 m. Analysis of these samples will investigate how biologically clean the drilling process is and the presence of any dust and other aeolian material within the ice column (e.g. Malard and others, Reference Malard2019). Returning the drill to the surface, instrument deployments and drill decommissioning (no sediment sampling was scheduled for the first hole) took a further ~16 h, making a total of 81 h continuous operation from start to finish.
Prior to breakthrough, the level of water in the borehole was significantly above the hydrostatic level (i.e. above that required to equal the ice overburden pressure) to ensure that subglacial material was not drawn into the lower part of the hole once a connection to the subglacial hydrological system was made. As a result, breakthrough was indicated by a rapid loss of water into the bed, lowering of the water level in the borehole and cavity, and a brief period of considerably increased load on the drill tower (Anker and others, Reference Anker, Makinson, Nicholls and Smith2021). The observed immediate drop in water level once the bed was reached shows that the borehole connected to the subglacial hydrological system and that the bed is not frozen. A total of ~8 m3 of water was flushed from the borehole into the ice stream bed in ~1 min.
Seismic reflection data had indicated the ice thickness at this location to be 2154 m; the depth indicator on the drill at breakthrough was 2152 m. This difference of only 2 m is much less than the likely errors of the two depth measurements (±15 m for the seismics, and probably similar for the drill depth indicator in Hole 1), so such a close match is probably partly fortuitous. However, it does confirm the value of the high-resolution geophysical data as a reliable indicator of when breakthrough can be expected to happen during the drilling.
During hot-water drilling, small-scale variability is sometimes seen in the load on the drill tower. This is usually the effect of either englacial sediment or a relatively narrow hole (relative to the diameter of the drill stem), both of which can impede the drilling, slowing the penetration rate and reducing the load on the tower. This effect was seen during the drilling of Hole 1 although, as it was a relatively narrow hole, it was not possible to distinguish between these two possible causes. No sediment was seen on the drill stem when it was returned to the surface. This could indicate either that there was actually little or no englacial sediment, or that the rapid down-flow of water past the drill stem on breakthrough had washed away any sediment that might have been on it.
An instrument string comprising 12 identical instrument packages spaced at various depths through the ice column was deployed in Hole 1. The lowest instrument package on this string was emplaced 118 m above the bed. Each instrument package contains a number of identical sensors: a temperature sensor to give the ice column temperature profile, a water pressure sensor, and tilt sensors (magnitude and orientation) to indicate deformation within the ice. Once the borehole freezes, the pressure sensor data will no longer indicate water pressure. Conversely, the tilt measurements will probably only become meaningful once freezing has happened. For the temperature sensors, both borehole freezing and a sufficient time for the excess heat remaining in the ice from drilling to dissipate will be required before the true ice column temperature profile is indicated.
4. Description of drilling and borehole activities: Hole 2
Hole 2 was located a short distance downstream of Hole 1. Equipment at the surface was moved ~10 m and the ice stream's motion will have added a similar distance, so the point of access to the bed will have been ~20 m downstream of that for Hole 1. This location was a compromise between three factors: being far enough away that the activities at Hole 1 (especially the flushing of borehole water into the bed on breakthrough) will hopefully not have significantly affected the bed at Hole 2; being close enough to Hole 1 that the basal conditions, in particular the effective pressure (the difference between the ice overburden and the basal water pressure) will be the same, enabling us to control what would happen hydrologically on breakthrough in Hole 2; and the practicalities of moving the drill (only the hose reel and drill tower equipment had to be moved). From seismic surveys, the ice thickness at Hole 2 was 2154 m.
Total drilling time, from start to breakthrough was 72 h. As with Hole 1, samples of the drill water recovered from the cavity were taken for later analysis at regular (~250 m) drill depth intervals. Raising the drill and all the subsequent instrument and sampling activities took a further 24 h making a total of 96 h continuous operation for Hole 2.
Prior to breakthrough on Hole 2, the water level in the borehole had been adjusted to roughly equal the basal water pressure, assuming it was the same as in Hole 1, nearby. This was done to minimise disturbance to the basal hydrological system on breakthrough, presumably minimising the effect of this on the ice stream bed. This approach appeared to be effective; breakthrough was indicated by a small (~0.8 m) rise in the water level over a period of ~2 min, followed soon after by a period of gentle oscillations in the water level in the borehole (Anker and others, Reference Anker, Makinson, Nicholls and Smith2021). The rise in water level on breakthrough, although small, is an important observation. It suggests that, prior to any modification by the drilling, a basal hydrological system exists at the ice stream bed capable of delivering a significant quantity of water into (or receiving it from, as seen in Hole 1) the borehole. Similar observations were seen on Bindschadler Ice Stream (Kamb, Reference Kamb, Alley and Bindschadler2001). This observation from Rutford Ice Stream supports the suggestion (Kamb, Reference Kamb, Alley and Bindschadler2001) that the existence of such a basal water system is typical of ice streams in general.
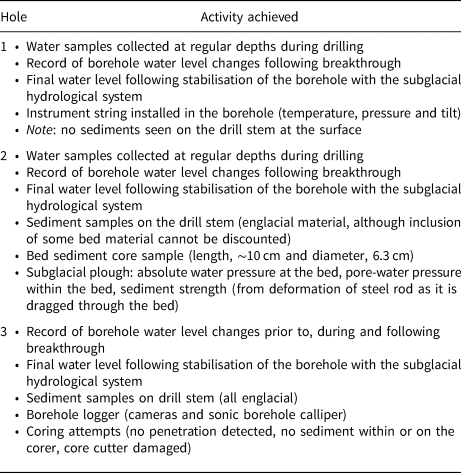
As with Hole 1, fluctuations occurred in the load on the drill tower as the drilling passed through the lower parts of the ice column. However, unlike Hole 1, Hole 2 was relatively wide (so any borehole variations should not have impeded the drilling) and there was also a considerable amount of sediment on the drill stem once it was returned to the surface (Fig. 4). This is strong evidence for the presence of significant quantities of englacial sediment within the lower part of the ice column.
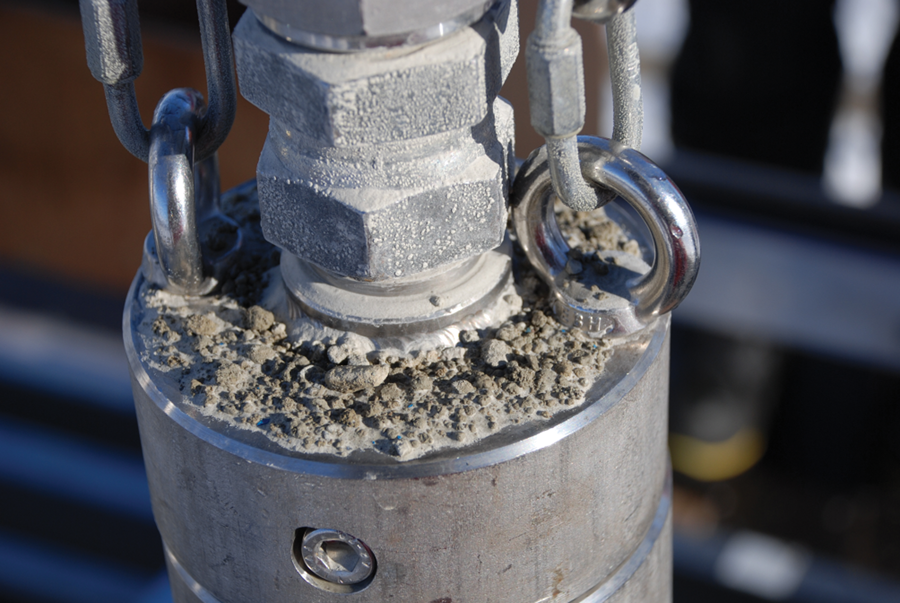
Fig. 4. Sediments on the drill stem after removing the drill from the hole (example from Hole 3).
These sediments were collected for later analysis, although we cannot be certain these samples are entirely of englacial origin, as some mixing with bed material cannot be completely discounted.
The first task in Hole 2 was the recovery of sediment samples from the bed using a percussion corer operated by a manually controlled hammer (Hodgson and others, Reference Hodgson2015), which can also be used in conjunction with an automatic hammer-release mechanism (Makinson and others, Reference Makinsonin press). Problems with the winch, as well as deteriorating weather, meant that the automatic hammer-release was not used in this hole. Instead, percussion hammering was done manually. The total mass of the percussion hammer was 22 kg. A short section of bed sediment core, ~10 cm long was eventually recovered. This sample, as well as all sediment samples collected during the project was immediately covered (to keep out light), frozen and stored for transport. The successful recovery of this core from the ice stream bed confirms the geophysical interpretations of a soft, water-saturated bed at this location on Rutford Ice Stream.
The second task in Hole 2 was the deployment of a subglacial plough instrument (Fig. 5). This comprised a 4 m long steel rod (45 mm diameter) instrumented with strain gauges and pressure sensors. The lower part of the rod was inserted into the bed sediment, while the upper part, and the monitoring unit and weight stack above it, remained in the lower part of the ice column. The goal of the subglacial plough deployment is to give an indication of the bed sediment's physical properties. As the ice slides over the bed (assuming the bed material is not all being transported with the ice motion) the lower part of the plough rod will be dragged through the sediment. This should cause slight bending of the rod which is detected by the strain gauges. Interpretation of this should give some indication of the sediment's strength.
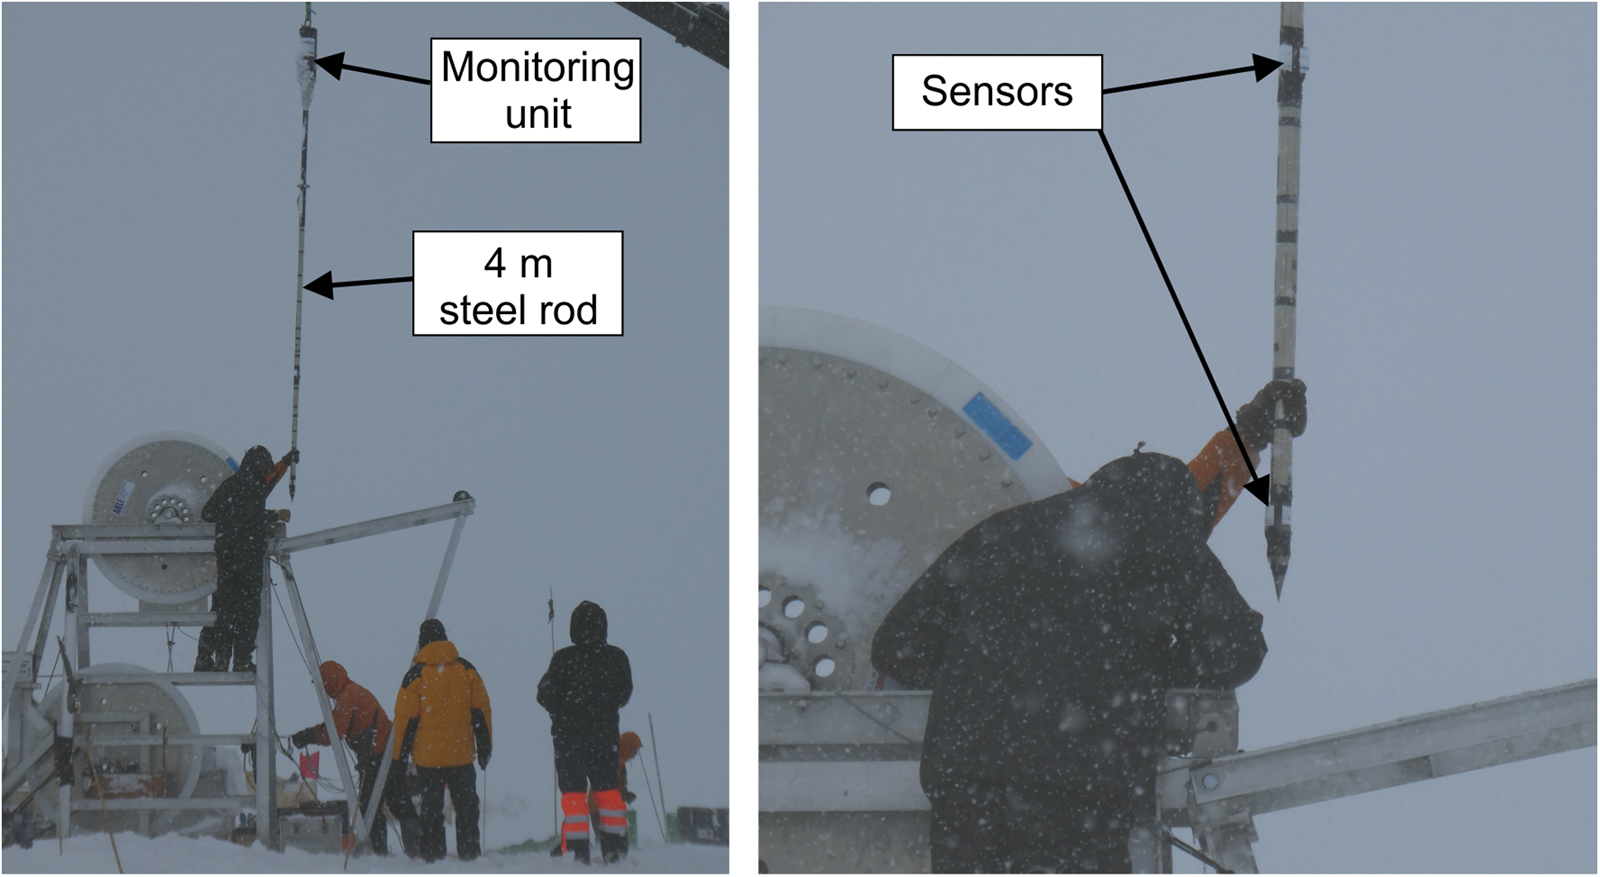
Fig. 5. Installation of the subglacial plough.
The plough contains one absolute pressure sensor at the top of the rod, which gives the basal water pressure. It also has a pressure sensor part-way down the rod which gives the pressure difference between that location and the pressure sensor at the top of the rod. This will give an indication of the pressure gradient in the upper part of the ice stream bed.
5. Description of drilling and borehole activities: Hole 3
Seismic surveys show an increase in bed material hardness (indicated by its acoustic impedance) between the first and second sites (Smith and Murray, Reference Smith and Murray2009). This is interpreted as a transition from high-porosity, soft, possibly deforming, saturated sediment to sediment which, while still saturated, is lower porosity and more compacted. A simplified, broad interpretation of the two bed types includes an actively deforming sediment at the upstream site, transitioning to a lodged sediment at the downstream site. The transition is a well-defined boundary on seismic lines (Fig. 3). On radar-derived maps of the subglacial topography in this region, it is also a clear transition from a landscape dominated by elongated bedforms (drumlins and mega-scale glacial lineations) upstream, to one of much more subdued, hummocky terrain (Fig. 2; King and others, Reference King, Pritchard and Smith2016). Seismic surveys at the site of Hole 3 show a shallow depression in the ice stream bed and indicate an ice thickness of 2130 m.
Establishing a hydrological connection with the ice stream bed at Hole 3, as well as all sampling and instrument deployments, was very different compared to those at the first two holes. When the drill reached the expected depth for breakthrough, no hydrological connection to the bed could be made and, despite a considerable period of attempting it (45 min), no further downward progress could be made with the drill. As with the previous holes, fluctuations in the load on the tower occurred as the drill stem passed through the lower part of the ice column. However, these fluctuations were much greater than seen in either of the other holes and caused a far more noticeable reduction in the rate of penetration. As Hole 3 was a relatively wide hole, this was interpreted as indicating the presence of englacial material in much greater quantities than at the first site. Considerable quantities of sediment were recovered from the drill stem when it returned to the surface and sediment traps (which form part of the drill stem) were found to be overflowing, whereas at Hole 2, they were only ~90% full (Fig. 6). Hence, it is possible that further drill progress in Hole 3 was halted by an accumulation of too much sediment in the drill hole.
Fig. 6. Sediment traps from the drill stem containing englacial material melted out by the drilling. Compare the one from Hole 2, which is ~90% full with that from Hole 3 which is overflowing.
After being returned to the surface, the drill stem was reconfigured and a further attempt (~1 h) to penetrate to the bed was made. This was also unsuccessful, with similar indications of load on the drill tower, sediment returned to the surface on the drill stem and no detectably (within the uncertainties of hose stretch) greater depth reached.
Despite these attempts, no apparent connection with the subglacial hydrological system was made during the entire drilling process in Hole 3. As with Hole 2, the water level in the borehole had been adjusted to equal the basal water pressure, knowing the ice thickness and assuming zero effective pressure at the bed. Hence, it was possible that the breakthrough could have happened but not been indicated by a change in borehole water level. However, this possibility can be discounted because, as the drilling attempts progressed over a number of hours, excess water was pumped into the cavity from the surface. During this process, the water level in the borehole rose steadily, which would not have occurred if a full hydrological connection with the bed had been established. Attempts to achieve it were finally halted and the drill returned to the surface, where more samples of sediment were recovered from the drill stem. The duration of the whole drilling process up to this point was 90 h.
Over the subsequent 10 h a borehole measurement system (McAfee and others, Reference McAfeein press), comprising downward- and sideways-looking cameras and sonic borehole diameter measurements was twice deployed to the bottom of the borehole. Between these two, the sediment corer was deployed, using both manual hammering and the automatic hammer-release mechanism (Makinson and others, Reference Makinsonin press). The hammer mass was increased to a total of 44 kg. The corer was deployed over the drill tower so that the operation of the percussion hammer and the depth and penetration of the corer could be monitored precisely. This indicated successful operation of the hammer (Makinson and others, Reference Makinsonin press); however, the depth indicator showed that despite a prolonged attempt, no penetration beyond the original hole depth could be achieved. On return to the surface, the sediment corer contained no sediment sample, nor was there any indication of sedimentary material (e.g. melted-out englacial sediment from within the borehole) on the drill stem or hammer. However, the cutter at the very bottom of the corer had been damaged; one side was bent inwards slightly (1.8 mm) and showed some pitting (Fig. 7). This damage is consistent with repeated hammering against a hard basal or englacial boulder, or bedrock.
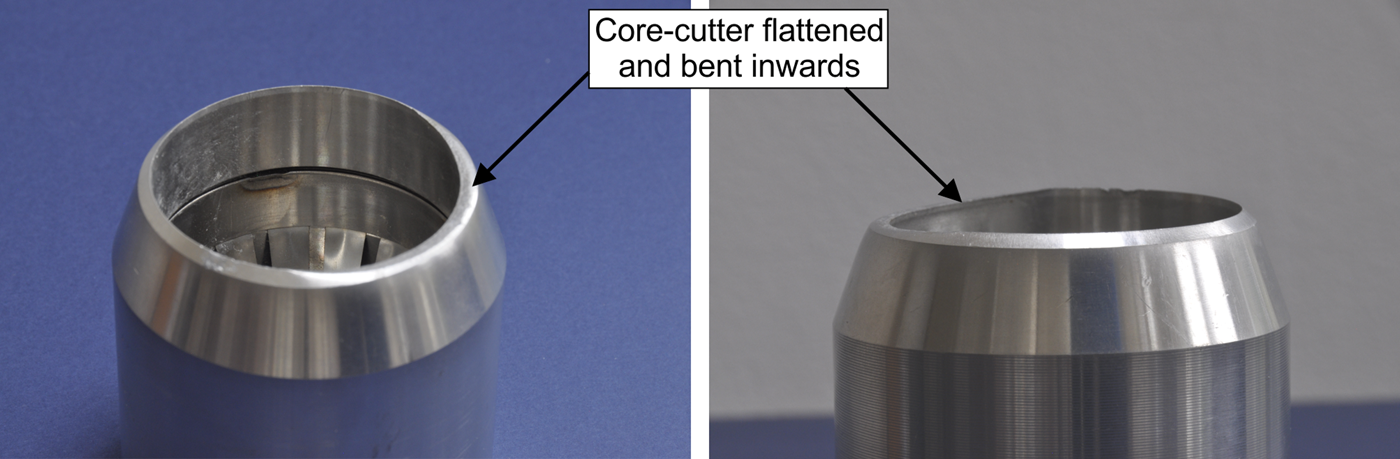
Fig. 7. Damaged core cutter after deployment in Hole 3.
Finally, attempts were made to deploy both an instrument string (identical to that installed in Hole 1) and a fibre-optic cable (for distributed temperature-strain measurements), but these were unsuccessful. However, as the instrument string deployment was progressing, a direct connection with the subglacial hydrological system was finally established. This occurred spontaneously, >23 h after all drilling attempts had been completed. Following the drilling attempts, the water level in the borehole had been steadily raised to be significantly greater than that required to equal the expected basal water pressure. Connection with the basal water system was indicated by a slow, steady lowering of the borehole water level, eventually matching that expected in the basal hydrology. This connection was first noticed in the pressure sensors on the instrument string as it was being deployed, and was later confirmed by the record of water level in the borehole. The borehole sampling and instrumentation activities took 36 h, making a total time period for Hole 3 (drilling and borehole work) of 126 h.
6. Geophysics summary
A suite of geophysical surveys was carried out during the fieldwork, primarily to complement and support the drilling and borehole work. As well as adding to our understanding of ice stream dynamics and basal conditions, these also support the extrapolation of results from the boreholes to a wider area of the ice stream bed. Although the geophysics results are presented elsewhere, a brief summary of the deployments is given here, as a complete record of the BEAMISH Project activities.
Seismic reflection and Amplitude vs Offset (AVO) surveys were conducted to confirm drill locations and to investigate basal conditions over a wider area; shallow refraction surveys were used to determine the properties of the upper ~100 m of the ice stream, including the firn and the upper part of the ice column. A substantial network of passive seismic stations was deployed during the fieldwork. The majority of stations (78) were deployed in an ~8 × 8 km area around the drill sites. The passive seismic stations give information on basal processes, particularly the mechanisms of ice movement over the bed, as well as physical properties of the ice column itself (e.g. anisotropy). Dual-frequency GPS receivers were operated within the drill site region to record ice motion. Phase-sensitive radars (ApRES) were operated for various periods at a number of sites to indicate the vertical strain within the ice column and any melting at the bed. These in-season geophysical data are complemented by previous seismic and radar surveys, and by long-term (including overwinter) deployments of ApRES, GPS and passive seismic instruments.
7. Initial results
7.1 Subglacial water pressure
The first results from the boreholes derive from the measured water depths below the ice stream surface on the completion of drilling, sampling and instrument work, but prior to freezing, so the boreholes were still connected to the subglacial hydrological system. In each hole, the depth from the ice stream surface to the top of the water in the borehole was measured. Knowing the ice thickness from the seismic reflection surveys allowed the height of the water column in the borehole to be calculated. Assuming densities for ice and water of 915 and 1000 kg m−3, respectively, corrections were made for the density in the upper part of the ice column (a mean value for the upper 100 m of 743 kg m−3 was determined from seismic refraction surveys) and the compressibility of water and ice (5.1 × 10⁻¹⁰ and 1.3 × 10⁻¹⁰ Pa−1, respectively). These allowed the ice overburden, the basal water pressure and hence the effective pressure to be calculated. Effective pressure is an important factor in fast ice flow (Paterson, Reference Paterson1994); along with basal shear stress and bed roughness, it is a significant parameter in basal sliding relationships. Low effective pressure indicates basal conditions that can favour both enhanced basal sliding and the deformation of soft subglacial sediments, two mechanisms that can lubricate the bed and enable fast ice flow.
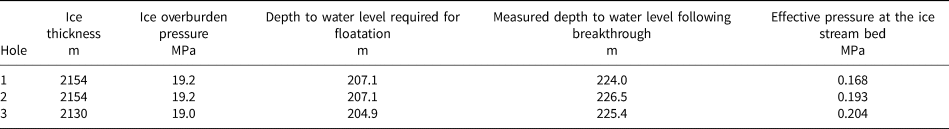
The effective pressure results are summarised in Table 3. The results from all three holes are very similar. Basal water pressure is close to (within ~1%) but slightly less than the ice overburden. Effective pressures are between 0.168 MPa (Hole 1) and 0.204 MPa (Hole 3). Likely errors in the ice thickness (±15 m), ice column density (±3 kg m−3) and depth to the water (±0.2 m) combine to give an estimate of the uncertainty in the effective pressure of ~0.15 MPa. Hence, within the uncertainties, effective pressure in all three holes is the same, and is very close to, although slightly greater than zero; the ice is close to, but not quite at floatation.
Table 3. Effective pressure results
7.2 Englacial sediment
The load fluctuations on the drill tower observed while drilling the lower parts of all three holes, combined with the sedimentary material recovered from the drill stem in Holes 2 and 3, confirm the presence of significant amounts of englacial sediment in the basal ice in this region, consistent with geophysical interpretations (Smith, Reference Smith1996). Englacial sediment has also been interpreted and observed in basal ice on the Siple Coast ice streams (e.g. Carsey and others, Reference Carsey, Behar, Lane, Realmuto and Engelhardt2002). For the samples from Hole 2 we cannot unequivocally rule out mixing with some bed material; however, the Hole 3 samples were collected before any connection with the bed was established, so they will represent only englacial material. Geochemical and microstructure analysis of the sediment samples from the drill stem, and any significant differences between them and the bed sediment, will be used to investigate their provenance, history and transport processes.
The differences in the evidence for englacial sediment between the two sites are worth noting. The evidence from Hole 1 is inconclusive: the load variations could have been caused by either englacial sediment or borehole characteristics, and we cannot distinguish between the two; the lack of sediment on the drill stem could indicate an absence of englacial material, or that it had been washed off by the considerable water flow into the bed on breakthrough. The evidence from Holes 2 and 3, however, is more definitive. Although load fluctuations were observed during the drilling of Hole 2, those during Hole 3 were far greater and had a much more significant effect on drill penetration. The quantities of sediment recovered from the drill stem in Hole 3, particularly in the sediment traps, were noticeably greater than those in Hole 2 (Fig. 6). Although we cannot completely discount the possible effect on recovered sediment quantity of the time spent by the drill stem in the lowest parts of the hole (and hence proximity to the melted-out englacial material in the water column), which was much greater in Hole 3 due to the repeated efforts to achieve the breakthrough, it is most likely that the evidence indicates greater quantities of englacial sediment in Hole 3.
Taken together the evidence suggests significant variations in englacial sediment in the region of the drill sites. There are much greater quantities of englacial sediment in the basal ice at the second location (Hole 3) than at the first (Holes 1 and 2). There might also be differences in englacial sediment quantity between Hole 1 (little, or none) and Hole 2 (a significant quantity), although the evidence for this is not conclusive.
7.3 The basal interface in Hole 3
For Holes 1 and 2, at the upstream site, a direct connection with the subglacial hydrological system was established as soon as the drill nozzle reached the bed. Even in Hole 2, where the pressure in the borehole had been adjusted to closely match the basal water pressure, the small change in water level was immediately evident. This contrasts markedly with the drilling and sampling activities, and the delayed, spontaneous breakthrough, experienced in Hole 3, >23 h after drilling attempts had stopped.
Although delayed breakthrough (or even complete failure to connect) with the basal hydrological system can be common in temperate and mountain glaciers (e.g. Hodge, Reference Hodge1979; Kamb and Engelhardt, Reference Kamb and Engelhardt1987), so far it is rare on ice streams. The failure of the drilling to connect with the basal hydrology in Hole 3 could have been due to a number of factors. These include a frozen interface, blockage of the drill hole by melted-out englacial sediment, or blockage of the hole by something embedded into the base of the ice, which was large enough, and sufficiently solid to temporarily prevent a hydraulic connection with the bed. We next consider each of these three options.
7.3.1 Hole blocked by a frozen interface
The possibility of locally frozen bed has been interpreted from a small number (3 out of 44) of boreholes drilled on the Siple Coast ice streams, including at one location within a few metres of other boreholes where the bed was thawed (Engelhardt and Kamb, Reference Engelhardt and Kamb1997; Kamb, Reference Kamb, Alley and Bindschadler2001). One hole drilled to the bed of Whillans Ice Stream showed no breakthrough until 9 h after drilling had ceased. Although there were a number of possible explanations for this, the one considered most likely (and also that preferred for the two other holes where little or no connection was established) was the presence of frozen till between the ice and the melting-point isotherm located at some depth into the bed. Indications of having penetrated frozen sediment were seen on the drill nozzle (scratches, for example), and one suitable sediment core was retrieved, which was consistent with the drill having penetrated a layer of frozen sediment beneath the ice.
Unlike the example from Whillans Ice Stream, in Hole 3 there were no indications of the drill nozzle having penetrated frozen sediments, nor was it possible to recover any sediment sample. The ice flow speed, the ice thickness and the geophysical interpretation at this location on Rutford Ice Stream also indicate a thawed bed. Hence, a frozen bed is not considered the likely explanation for the failure to connect with the basal hydrological system in Hole 3.
7.3.2 Hole blocked by melted-out englacial sediment
Complete blockage of the hole by melted-out englacial sediment is possible and there is evidence for large quantities of englacial sediment in the lower part of the ice column at Hole 3. For any hot-water drilling system, increasing quantities of sediment in the hole could eventually become sufficient to preclude further penetration, irrespective of drill nozzle pressure and flow rate, especially if the sediment is particularly coarse.
The sediment recovered from the drill stem, the load fluctuations on the tower when drilling through the bottom part of the ice column and the reduced penetration rate near the bottom are strong evidence that melted-out englacial material was influencing the drilling near the bed to some degree. However, for this alone to cause the complete cessation of penetration observed in Hole 3 is unlikely; up to this depth, the drill had been making reduced, but still-downward progress, whereas no further penetration at all beyond this depth could be achieved. Both the drill and the corer reached this maximum depth and despite prolonged efforts, never penetrated any detectable distance beyond that, behaviour which is not consistent with a steadily increasing amount of sediment in the hole.
In a comparable situation on Whillans Ice Stream (Kamb, Reference Kamb, Alley and Bindschadler2001), a good core sample was recovered and showed both stratification and a lack of clay-sized particles, consistent with accumulation and settling of melted-out englacial and frozen bed sediment, once the drilling was stopped. In contrast, no sediments were recovered from Hole 3 by the percussion corer, which might be expected if the bottom of the hole had been filled with a significant quantity of sediment.
7.3.3 Hole blocked by something solid
The drill and the corer both reached the maximum depth and penetrated no detectable distance beyond that, consistent with the presence of an obstruction. The damage to the sediment core cutter (Fig. 7) must have been caused by repeated hammering against something resistant and solid. If this was a large piece of solid rock (a large boulder, for example) embedded in the base of the ice, it would be consistent with not only the cutter damage but also with the observed maximum penetration depth.
The breakthrough observed in Hole 3 happened >23 h after drilling attempts ceased. There will have been little residual heat left in the water at the bottom of the hole, and the amount of ice it could have continued to melt will have been small. Hence, even though a small amount of ice melting might have occurred, the main reason for breakthrough is more likely to have been mechanical, rather than thermal. Mechanical reasons include fracturing due to hydrostatic overpressure, and movement of whatever was blocking the hole.
Over a period of 9 h prior to breakthrough, the water level in the Hole 3 was steadily increased. By the time of breakthrough, this had reached a level of ~70 m above that required to equal the basal water pressure (generating a pressure difference of ~0.7 MPa between the borehole and the bed). If the borehole was blocked at the bottom by a large boulder being dragged over or through the bed, its position within the ice could change slightly with time, either opening a connection with the basal hydrology or weakening whatever form of seal was preventing that, making it more vulnerable to pressure. In a similar situation, the delayed breakthrough at one hole on Whillans Ice Stream (Engelhardt and Kamb, Reference Engelhardt and Kamb1997; Kamb, Reference Kamb, Alley and Bindschadler2001) was also attributed to fracture (of frozen bed sediment, in that instance) caused by overpressure in the borehole (~80 m above the level required to equalise the basal water pressure).
Considering the amount of sediment recovered from the drill nozzle in Hole 3, there will almost certainly have been some quantity of thawed-out englacial sediment in the bottom of the hole by the time the sediment coring attempts began. It is not known why this material was not recovered by the corer. One possible reason could be the prolonged efforts to achieve the breakthrough with the drill, which increased the size of the borehole at the bed. Over the lowest 5 m, the hole diameter increased from ~40 cm to ~1 m (McAfee and others, Reference McAfeein press). For a given quantity of sediment in the borehole, if it settles into a layer of constant thickness once the drill is removed, such a layer at the bottom of a 1 m diameter hole will be much thinner (less than a quarter) than that in a 40 cm diameter hole. A sediment layer thus reduced in thickness to only a few centimetres might be too thin to be successfully captured by the corer. An additional or alternative factor could be the reduction in the sediment's finer grains, which will stay in suspension much longer than the coarser ones; a sand-rich sediment sample is more likely to get washed from the corer during its return to the surface than one which retains a high proportion of clay-sized particles.
Based on the observations from Hole 3 and with the limited comparable evidence from the Siple Coast ice streams, the presence of a large solid boulder embedded in the base of the ice seems the most likely explanation for the conditions encountered at the bottom of this hole. Disturbance of the boulder's position within the ice due to its interactions with the bed as the ice stream moved, in conjunction with the borehole overpressure and perhaps a small amount of melting from residual heat, is considered the most likely explanation for the subsequent, delayed breakthrough.
8. Conclusions
Three holes were successfully drilled to the bed of Rutford Ice Stream during the BEAMISH Project, through ice up to 2154 m thick. These are the deepest subglacial access holes ever achieved by hot-water drilling. In at least two of the holes, the immediate connection made with the subglacial hydrological system confirms that the bed is not frozen. The core recovered from the bed of one hole confirms the presence of soft, water-saturated sediments at the ice stream bed. Englacial sediment exists in the deeper parts of the ice column at both sites, in far greater quantities at site 2 than at site 1. There are also indications of variability in englacial sediment between the holes at site 1, although the evidence for this is not conclusive.
Within likely errors, the effective pressure at the bed is the same in all three holes (0.168–0.204 MPa) and also indicates that the pressure in the subglacial hydrological system is very close to but slightly less than the ice overburden. This is the case even though some characteristics (in particular, the nature of the bed material) of the basal conditions at one hole (Hole 3) have been interpreted from geophysical surveys as being significantly different to those at the other holes.
Apart from the effective pressure, the observations at the bottom of Hole 3 were very different to those in the other holes: it proved impossible to drill beyond a particular depth; attempts to recover sediment samples were unsuccessful but did result in damage to the core cutter; and while no connection could be made with the subglacial hydrological system during drilling, it did occur spontaneously >23 h later. These differences are currently believed to indicate the presence of a large (>1 m), solid clast embedded in the base of the ice, large enough to preclude breakthrough and sufficiently solid to damage the core cutter. The breakthrough was probably eventually achieved by disturbance of the clast by basal motion and increasing hydrostatic pressure in the borehole.
Notwithstanding the nature of breakthrough in Hole 3, the observations of both the fall and rise of borehole water levels on breakthrough (depending on their pre-conditioned level beforehand) suggest the presence of a well-developed basal hydrological system beneath the ice stream, i.e. one that was not formed by the drilling activity. This conclusion supports the earlier suggestion that such a basal water system exists for ice streams in general (Kamb, Reference Kamb, Alley and Bindschadler2001).
Acknowledgements
This study was funded by the NERC AFI award Nos. NE/G014159/1 and NE/G013187/1. The authors thank the US National Science Foundation for support for SA through their award NSF 1643961. Geophysical equipment was provided by NERC's Geophysical Equipment Facility, loan number 1017. Seismic instruments were also provided by the Incorporated Research Institutions for Seismology (IRIS) through the PASSCAL Polar Support Services. Seismic data collected will be available through the IRIS Data Management Center. The facilities of the IRIS Consortium are supported by the National Science Foundation's Seismological Facilities for the Advancement of Geoscience (SAGE) Award under the Cooperative Support Agreement OPP-1851037. British Antarctic Survey Operations provided the logistics for the project. The authors are grateful to Catrin Thomas, Stuart Ellis, Sam Bowerman and Ian Hey for their considerable help in the field, and also to two reviewers.


 Open access