

Abstract
We present a statistical method to quantify the contribution of urbanization to precipitation changes during 1958–2017 across the greater Beijing–Tianjin–Hebei metropolitan region in northern China. We find distinct trends in precipitation in the past six decades: decreasing in annual and summer while increasing in other seasons. The spatial patterns of precipitation show discernible terrain-induced characteristics with high values in the buffer zones of plain and mountain areas and low values in the northwestern mountainous regions. Our results indicate that although urbanization has limited impacts on the trends and spatial patterns of precipitation, it has a positive contribution to the changes in precipitation for about 80% of the comparisons conducted, especially in autumn (100%), with the negative contribution being dominant in summer (66.67%). In addition, these results are sensitive to the classifications of urban and rural stations, suggesting that how to classify urban/rural areas is a crucial step to estimate the potential contribution of urbanization to precipitation changes. These findings also support that urbanization can diversify and enhance the variations in precipitation, with urban areas becoming a secondary center along with more increasing or less decreasing trends in precipitation.
Export citation and abstract BibTeX RIS

Original content from this work may be used under the terms of the Creative Commons Attribution 4.0 license. Any further distribution of this work must maintain attribution to the author(s) and the title of the work, journal citation and DOI.
1. Introduction
Urbanization is one of the essential human-induced changes in land use (Kalnay and Cai 2003, Zhou et al 2004, Li et al 2019), having profoundly influenced the local environment and climate conditions. A well-known consequence of urbanization is the changes in precipitation patterns over urban areas due to the dynamical environmental factors related to aerosol emissions (Jin et al 2005), surface and boundary layer feedbacks, and thermodynamic conditions (Shepherd et al 2002). Generally, the causative factors linked to the urbanization-induced precipitation include the urban heat island phenomenon, large surface roughness and higher aerosol concentration (Lowry 1998, Shepherd 2005, Han et al 2014, Song et al 2014, Freitag et al 2018, Lu et al 2019). Any changes in these factors could inhibit or enhance the formation, intensity, and duration of precipitation or alter its trajectory (Han and Baik 2008, Shem and Shepherd 2009, Yang et al 2016, Zhang et al 2018, Manola et al 2020). However, the mechanism of urbanization-induced precipitation is not well understood because of the difficulty in investigating the compound influences of causative factors coming from climate conditions, geographical settings of cities, and size of cities (Fu et al 2019). As a result, contradicting conclusions have been drawn in previous studies using different data sets, spatial scales, analysis methods. For example, Wang et al (2012) found that urbanization in the Beijing–Tianjin–Hebei (BTH) region had caused an increase in precipitation amount based on model simulations. In contrast, in an alternative study by Jiang and Li (2014), the authors concluded that no significant change in precipitation was found in observed records in the same region. Therefore, there is an urgent need to understand better the changes in precipitation patterns and how they are related to urbanization.
Empirical and analytical approaches have been used to investigate how different the characteristics of precipitation are from neighboring regions with various levels of urbanization (Shepherd 2005, Kaufmann et al 2007, Mishra et al 2012, Pathirana et al 2014, Song et al 2019b). A significant advantage of these analytical approaches is that they are handy to apply at a coarser temporal scale (e.g. annual or decadal), which is often enough for assessing the long-term urbanization impact on precipitation changes. Generally, for these analytical approaches, the possible effects of urbanization on precipitation are estimated by comparing observed records in urban stations with those in their surrounding rural stations. However, such results largely depend on how rural versus urban stations are classified; that is, an existential challenge is that these approaches may be sensitive to urban-rural classification. For that matter, several previous studies used the area-specific information of population, satellite-observed nighttime light intensity, and land cover to identify the urban areas (Lin et al 2018, Gu et al 2019a) and to estimate the impacts of urbanization on precipitation (Fu et al 2019, Zhao et al 2019). Generally, the selection of the urban and rural stations may bring biases into such studies (Zhao et al 2006, Wang and Shu 2019). Furthermore, previous studies have paid little attention to the uncertainties from the urban-rural classifications due to different datasets used, especially for those urban clusters or metropolitan areas experiencing rapid urbanization.
China has experienced rapid urbanization since its reform process started in 1978. Recently, urban clustering has become a notable feature of urbanization in China, e.g. the BTH, the Yangtze River Delta, and the Pearl River Delta (Fang and Yu 2017). The impacts from the development of urban clusters on precipitation can be very different from those coming from a single city (Li et al 2009, Sang et al 2013, Chen et al 2015, Zhao et al 2019, Song et al 2019a). Several studies have analyzed the effects of urban clusters on the regional climate under different climatic conditions (Wang et al 2012, Jiang and Li 2014, Fu et al 2019, Gao et al 2019). Specifically, some of these studies investigated the possible relationships between urban development and precipitation changes for the BTH region. For example, Zhang et al (2015) have investigated the impact of urbanization on summer rainfall in the BTH region using the Weather Research and Forecasting (WRF) model coupled with urban canopy model. It was found that the precipitation in the Beijing–Tianjin–Tangshan metropolitan area decreased while increasing in the downwind area. Wang et al (2015) investigated how different degrees of urbanization affect local and regional precipitation using the WRF model. Precipitation increased significantly over the downwind Beijing metropolis because of the effects of early urbanization, but current high urban development conditions caused no significant increase in rainfall. However, questions remain to be addressed regarding the contribution of urbanization to precipitation changes.
Using the BTH metropolitan in northern China as a case study, this paper attempts to answer the following questions: (a) what is the magnitude of the impact of urbanization on annual and seasonal precipitation at a regional scale; (b) what is the relative contribution of urbanization to the changes in precipitation patterns; (c) what is the impact of urban and rural classification on the estimated contribution of urbanization to precipitation changes?
2. Data and methods
2.1. Data
We collected daily precipitation records from 174 gauges across BTH from China Meteorological Administration (CMA) (www.data.cma.cn). Overall, the data quality is validated by the CMA according to the Guidelines on the Quality Control of Surface Climatological Data (Ren et al 2012, Cao et al 2016). However, larger uncertainty may still arise in regions with relatively sparse gauges in the early 1950s (figure S1, which is available online at stacks.iop.org/ERL/16/014042/mmedia). We analyzed urbanization's effect on precipitation using the daily records from 1958 to 2017, divided into two 30 year periods: the pre-1987 period (1958–1987) and the post-1987 period (1988–2017). The pre-1987 period is recognized as the time with low-level urbanization expansion compared with the post-1987 period when rapid urbanization expansion came into force (i.e. high-level) (figure S2).
In this work, we used land use, population and nighttime light data to identify the urban and rural areas in BTH. We obtained both population and land use data (spatial resolution: ∼1 km) in 1990 and 2015 from the Data Center for Resources and Environmental Sciences, Chinese Academy of Sciences (www.resdc.cn). We also obtained the nighttime light data in 1992 and 2013 from the Defense Meteorological Satellite Program's Operational Linescan System (National Centers for Environmental Information (NCEI) 2019).
2.2. Methods
2.2.1. Classification of urban and rural stations
The land use, population and nighttime light data are used to classify the urban or rural stations. Two criteria are used to identify an urban station in this process: if the proportion of built-up area (calculated based on land use data) is greater than 33% within the 2 km buffer zone surrounding the station under investigation (Liao et al 2018); or the station is located in the area which is already classified as urban using population density and/or the nighttime light data. For the latter criterion, an area with a population density larger than 1000 persons km−2 or the value of nighttime light higher than 50 is defined as an urban area (Fu et al 2019, Wu et al 2019). Overall, a station is deemed to be an urban station if one or more of the above criteria are met.
This classification procedure is applied to all the stations over the two periods, i.e. the pre- and post-1987 periods, to represent urbanization's dynamic process. Limited by data availability, however, the pre-1987 urban areas are identified using only the data at the end of the 1980s/the beginning of 1990s; and the post-1987 urban areas are identified using only the data of 2013 (nighttime light) or 2015 (land use or population). We further classify the stations into three sub-categories: (a) urbanized stations with their locations in the urban areas for both pre-1987 and post-1987, (b) urbanizing stations with their locations in the urban areas in the second period only, and (c) rural stations with their locations in the rural areas in both periods, as shown in figure 1.

Figure 1. Classification of urbanized (red star), urbanizing (cyan triangle) and rural (open circle) meteorological stations in BTH: (a) the terrain elevation and classification results of meteorological stations used in this study; (b)–(d) the classification resulting from the land use data (1990 and 2015), nighttime light data (1992 and 2013) and population data (1990 and 2015), respectively. The pie chart shows the ratio of urbanized, urbanizing and rural stations in all the stations.
Download figure:
Standard image High-resolution image2.2.2. Estimating the contribution of urbanization to precipitation changes
It is essential to recognize that control experiments are needed to quantify urbanization impacts on precipitation changes in both observational and modeling studies (Liu and Niyogi 2019). Typically, to analyze the possible effects of urbanization on precipitation, a control group would need to be set up for the area without urban landscape in the same location. However, for observational studies, it is impossible to set twin experiments with identical settings. Usually, a neighboring non-urban area is considered as the control group (Changnon et al 1971, Huff and Changnon 1973, Kaufmann et al 2007); that is, a comparison between the precipitation in urban and surrounding rural areas is undertaken. With this method, an assumption is made that the change of precipitation in rural areas is mainly caused by natural variability or climate changes, whereas the change in urban areas is likely affected by the compound effects involving the role of urbanization. Thus, we propose that the urban-rural differences in the precipitation changes are only caused by the urbanization effects, which can be defined as an indicator to assess the long-term urbanization contribution to precipitation changes. Here, we use two indices (CRmean and CRslope) to quantify the contribution of urbanization to precipitation changes from the three events (i.e. Scenario I: Urbanized vs. Rural; Scenario II: Urbanizing vs. Rural; and Scenario III: Urbanized vs. Urbanizing) according to the classification of stations.
The first index CRmean, is defined as the contribution ratio of urbanization from the mean values, indicating the difference between the mean precipitation from the urban and rural areas. The CRmean can be estimated by equations (1) and (2):
where  is the mean value of annual precipitation for different areas and periods, with the subscripts pre and post meaning the corresponding values in the pre- and post-urbanization periods, and urbanized, urbanizing and rural for station types, respectively. The rCP is a standardized index to represent the rate of change in precipitation between the pre- and post-urbanization periods, which is used to remove the impact of the absolute precipitation amount. Here, CRmean < 0 (CRmean > 0) means the negative (positive) contribution of urbanization to precipitation changes.
The second index CRslope, is defined as the ratio of the slope from the trends in the urban-rural precipitation difference (PD) series to those of urban precipitation series, which can be seen as a measure in the urbanization contribution to precipitation changes and be estimated by equation (3):

where burban and bPD are the slopes of urban precipitation and PD time series. In this study, burban is the slope of precipitation trends in urbanized (Scenario I and Scenario III) and urbanizing (Scenario II) areas, respectively. Both trends of urban series and PD series during the study periods are estimated using linear regression. The index bPD can be used to represent the urbanization effect (Zhao et al 2019), with bPD > 0 indicating a positive effect, and conversely bPD < 0 a negative effect. Evidently, |CRslope| = 100% denotes that the urban-rural differences in precipitation are entirely caused by urbanization. |CRslope| > 100% means that an extra trend from other factors may not be considered and detected in this study.
3. Results and discussion
3.1. Impact of urbanization on spatial patterns of precipitation
Figure 2 shows the spatial distribution of annual and seasonal mean precipitation over 1958–2017. The precipitation shows several remarkable NE-SW bands, with high values located in southeastern BTH and low in the northwest, which is consistent with previous work by Song et al (2019a) and Zhao et al (2018). Overall, the spatial distribution of the mean precipitation is strongly correlated with the ground elevation (table S1 and figure S3) and influenced by the topographical features of BTH, with the highest values located in the buffer zones between the plain and the mountain areas in the northeastern BTH. However, urbanization also influences precipitation changes along with the terrain changes (figure S4), with urbanized regions having the least decreasing magnitude or higher increase in precipitation following the increase in terrain elevation compared with those in urbanizing and rural areas.
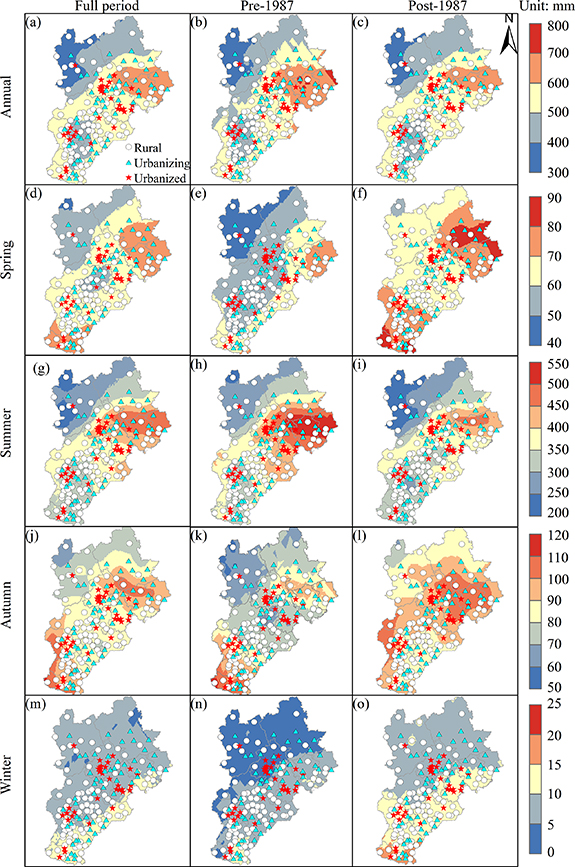
Figure 2. Spatial distribution of annual and seasonal mean precipitation over BTH during the periods of 1958–2017 (full period), 1958–1987 (pre-1987) and 1988–2017 (post-1987). The ordinary Kriging method is used to perform the spatial interpolation of precipitation based on ArcGIS®10.2 software.
Download figure:
Standard image High-resolution imageFigure 2 also shows that the precipitation patterns of both pre- and post-1987 are very similar, with increase of precipitation from northwest to southeast. Figure 3 summarizes the annual/seasonal precipitation characteristics for the urbanized, urbanizing and rural stations over BTH during the study period. Overall, except for winter, the mean and the median of precipitation at urban stations are higher than those at rural stations, with the highest values being in urbanized stations for annual and summer, and urbanizing stations for spring and autumn. These results suggest that urbanization may have a limited effect on the regional distribution of precipitation, but it may diversify the local precipitation pattern accompanied by other factors (e.g. terrain).
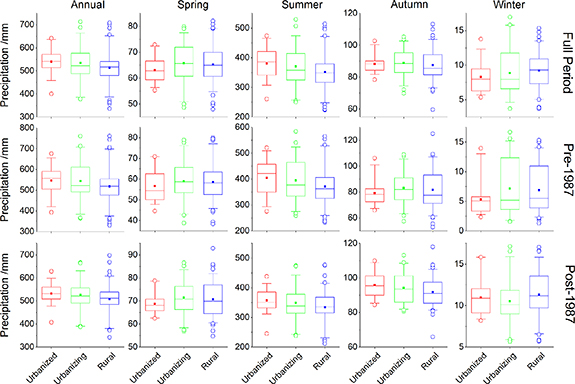
Figure 3. Statistical results of annual and seasonal precipitation for urbanized, urbanizing and rural stations over BTH during the study period. In each boxplot, top whisker, top box, median line, bottom box, and bottom whisker are for 95th, 75th, 50th, 25th, and 5th percentiles. The solid squares are the mean values for each group, and the open circles are the outliers for each group.
Download figure:
Standard image High-resolution image3.2. Impact of urbanization on temporal changes of regional mean precipitation
3.2.1. Changes in annual and seasonal precipitation
This section introduces the temporal changes in annual and seasonal precipitation over the period of 1958–2017. Figure 4 shows the temporal trends of annual/seasonal precipitation anomalies from 1958 to 2017 in urbanized, urbanizing and rural areas. All regions are found to have decreasing trends in both annual and summer precipitation for the entire period while increasing trends are observed in other seasons. Among these changes, summer comes with significant decreasing trends (figures 4(g)–(i)), and winter experiences a significant increasing trend (figures 4(m)–(o)). These results indicate that the significantly decreasing trends in summer may dominate the decrease in annual precipitation, which are mainly caused by the weakening east Asian summer monsoon since the 1970s (Ding and Chan 2005, Song et al 2019a). When both pre- and post-1987 periods are considered, similar changes are found in annual and seasonal precipitation, except for spring and autumn. Both spring (figures 4(d)–(f)) and autumn (figures 4(j)–(l)) demonstrate a reversed trend in the post-1987 period, but in different directions. Overall, all three areas show the same trends for both annual and seasonal scales, implying that urbanization may have a limited effect on the long-term precipitation trends. However, our results also show that urbanization may have contributed oppositely by mitigating the reduction or enhancing the ascension in precipitation with a steeper slope, especially for the urbanized areas. Similar results can be concluded from the annual and seasonal precipitation changes per decade for each station, as shown in figures 5 and S5.

Figure 4. Trends of spatially averaged annual and seasonal precipitation anomalies for urbanized (left column), urbanizing (middle column), and rural (right column) areas during the periods of 1958–2017 (red dashed lines), pre-1987 (green solid lines) and post-1987 (blue solid lines). The red, green and blue values are the slopes ± standard errors of linear trends for the three periods, respectively. The sign '*' means the statistically significant trend at a level of α = 0.05. The precipitation anomaly series are estimated from the precipitation series subtracting the mean value of precipitation series from 1958 to 2017.
Download figure:
Standard image High-resolution image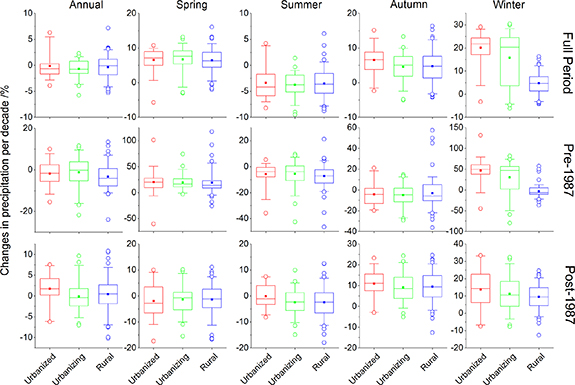
Figure 5. Statistical results of changes in annual/seasonal precipitation per decade (%) for urbanized, urbanizing and rural stations over BTH during the study period. In each boxplot, top whisker and box, median line, bottom box and whisker are for 95th, 75th, 50th, 25th, and 5th percentiles. The solid squares are the mean values for each group, and the open circles are the outliers for each group.
Download figure:
Standard image High-resolution image3.2.2. Changes of PD between urban and rural areas
Here, the urban-rural PD time series are used to investigate the possible impacts of urbanization on precipitation changes. Figure 6 shows the trends of the annual/seasonal PD series from the three types of areas. Overall, most of the cases show an increasing trend during the study period. As expected, the rising trends of PD indicate that urbanization may bring in more precipitation and enhance the urban-rural differences in precipitation. Certainly, the distinct trends also suggest that the response of precipitation changes to urbanization is complex; thus, it is still hard to conclude whether the enhanced effect is evident as only a few cases are of statistical significance in trends.
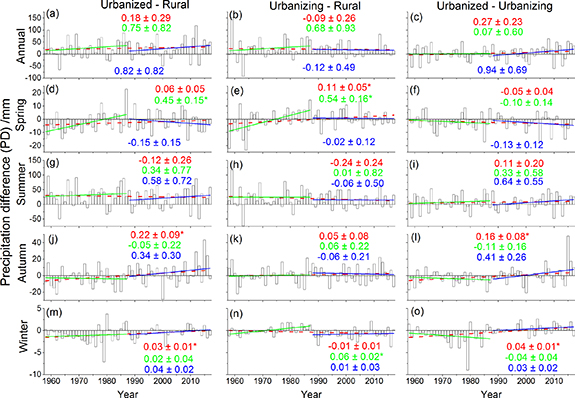
Figure 6. Trends of annual and seasonal PD series among urbanized, urbanizing and rural areas during the periods of 1958–2017 (red dashed lines), pre-1987 (green solid lines) and post-1987 (blue solid lines). The red, green and blue numbers mean the slopes ± standard errors of trends for PD series in the three periods, respectively. The sign '*' means the statistically significant trend at a level of α = 0.05.
Download figure:
Standard image High-resolution imageTo eliminate the influences of the absolute magnitude of precipitation variations, the standardized PD series is introduced here to represent the ratio of the PD series against the precipitation series in the paired 'rural' areas. Figure 7 shows the standardized PD series for each type of stations during the study period. The mean and median values of standardized PD series for annual and summer are higher than zero, but they are usually lower than zero for other seasons, which implies that urbanization may have diverse effects on precipitation changes, with positive effects on annual and summer precipitation, and negative ones in other seasons. Besides, the decreasing trends of the PD series in summer (figure 6) demonstrate that the magnitude of urbanization's positive effects on precipitation weakens. In contrast, the increasing trends of PD series for other seasons indicate that the adverse effects are weakened and even reversed to a positive effect (e.g. the PD series between urbanized and rural in autumn, see figures 6 and 7). In conclusion, the urbanization effects are indeed non-uniform for different seasons and periods.
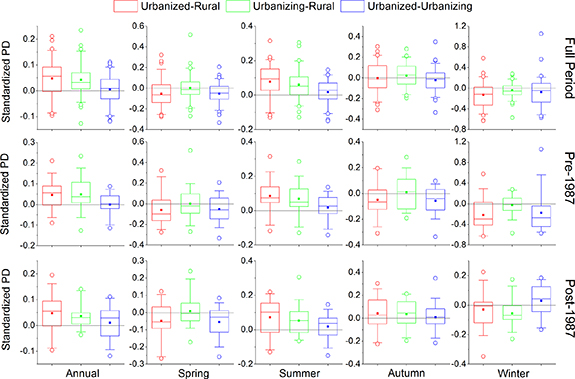
Figure 7. Boxplot of the standardized PD series among the urbanized, urbanizing and rural areas during the study period. In each boxplot, top whisker and box, median line, bottom box and whisker are for 95th, 75th, 50th, 25th, and 5th percentiles. The solid square is the mean value, while the open circle represents the outlier.
Download figure:
Standard image High-resolution image3.2.3. Contribution of urbanization to precipitation changes
Table 1 summarizes the urbanization's contribution to precipitation changes in BTH as measured by the CRmean and CRslope. Overall, both indices show that urbanization at a higher level has a positive contribution to precipitation for about 80% of the cases (Scenario I and Scenario III), while lower-level urbanization has a negative contribution for about 60% of the cases (Scenario II). Similar results are found regarding the index CRslope from further analyses concerning the two periods, on the basic hypothesis that rapid urbanization happens in post-1987 and low-level urbanization in pre-1987. In comparison to the CRslope value in pre-1987, we find significant increases in CRslope in the second period for Scenario I and Scenario III. These results imply that the contribution of urbanization may be related to the urbanization levels. Indeed, the tremendous values (e.g. 513% and 588%) of CRslope indicate that the precipitation changes are also affected by other local factors (e.g. terrain) that are not yet identified in this work. Besides, we find that there are distinct results from the seasons and different periods. These results also suggest that the urbanization effects on precipitation may be related to many factors, such as climate conditions, urbanization levels. However, their physical relationship is not clear due to the lack of enough evidence, which should be paid more attention to in the future.
Table 1. Contribution of urbanization to changes in annual and seasonal precipitation over BTH.
| CRslope (%) | |||||
|---|---|---|---|---|---|
| Contribution rate | CRmean (%) | Full period | Pre-1987 | Post-1987 | |
| Scenario I | Annual | 1.23 | 26.47 | 40.54 | 513 |
| Spring | 11.76 | 16.67 | 58.44* | −31.91 | |
| Summer | −10.89 | −6.98 | 14.98 | 71.60 | |
| Autumn | 48.99 | 45.83* | −7.81 | 24.29* | |
| Winter | 28.50 | 15.00* | 7.14 | 80.00* | |
| Scenario II | Annual | −22.24 | −9.57 | — | −15.38 |
| Spring | 14.60 | 26.83* | — | −5.88 | |
| Summer | −12.08 | −13.11 | — | −4.14 | |
| Autumn | 20.42 | 15.63 | — | −6.06 | |
| Winter | −21.61 | −6.25 | — | 50.00 | |
| Scenario III | Annual | 30.18 | 39.71 | 3.78 | 588 |
| Spring | −3.32 | −13.89 | −12.99 | −27.66 | |
| Summer | 1.35 | 6.40 | 14.54 | 79.01 | |
| Autumn | 35.90 | 33.33 | −17.19 | 29.29 | |
| Winter | 41.21 | 20.00 | −14.29 | 60.00 | |
Note: The contribution of urbanization is not estimated for Scenario II in pre-1987 because the urbanizing stations are also identified as rural stations in this period. The asterisk symbol means that the slope of the PD series is significant at a level of 0.05.
3.3. Uncertainty in assessing impact of urbanization on precipitation changes
As mentioned above, the classification of urban/rural stations can be made using various criteria, which may bring uncertainties in the process of assessing the contribution of urbanization. Thus, we analyze the possible differences in urbanization contributions to precipitation changes using different classifications (figure 1). Following the different criteria used, figure 8 shows contradicting results, accounting for about 63.33% of all the cases. It is worth noting that the results inferred from using CRmean are not entirely consistent with that from CRslope based on a single factor (e.g. land use, population, nighttime light). However, similar results can be obtained from CRmean and CRslope when using combined classification factors in this study, suggesting that the results obtained in this way are more reliable for identifying the contribution of urbanization. Our analysis also shows the stupendous discrepancies for the urbanization contribution when choosing different criteria. For example, the contribution in autumn ranges from −71.81% (using nighttime light) to 70.36% (using land use) for Scenario II (figure 8(g)). These results confirm that the way of classifying urban and rural stations may directly influence the process of assessing the urbanization effects on precipitation changes. Thus, a reliable approach to identify urban and rural areas is of crucial importance to determine the contribution of urbanization to precipitation changes.

Figure 8. Uncertainty of urbanization contribution to precipitation changes for different selection criteria of urbanized, urbanizing and rural stations.
Download figure:
Standard image High-resolution image
3.4. Discussion
Despite the growing knowledge about the effects of urbanization on precipitation, there has been a lack of quantitative assessment and analysis because the same urban area can yield different outcomes (Liu and Niyogi 2019). The present study indicates that the precipitation can be either enhanced or reduced by urbanization over the BTH region. However, urbanization has limited effects on precipitation changes, with most of the contribution rates being less than 50% (table 1), consistent with other previous studies in different regions (Fu et al 2019, Gu et al 2019b). The possible mechanisms and underlying reasons are discussed below.
As previous mentioned, the effects of urbanization on precipitation is complex, and they can be associated with many factors, such as the geographical and climatic contexts, spatial and temporal scales, precipitation types. In this work, we solely investigated the possible linkage of annual and seasonal precipitation to the urbanization over the BTH region. The weighted-average process may weaken the contributions from different urbanization levels over the BTH region, as compared with a single city (e.g. greater Beijing metropolitan area). Furthermore, the precipitation types (e.g. convective or frontal precipitation) and different areas of coverage (e.g. upwind or downwind areas), were not distinguished in this work due to the coarse temporal resolution, which may influence the contribution of urbanization to precipitation changes. Although this quantitative assessment helps us to understand the urbanization signature to precipitation changes, it should be noted that the statistical analyses are unable to clarify the physical processes of urban-induced precipitation changes. Meanwhile, we assume that the urban-rural contrasts in precipitation are caused by urbanization only, which may exaggerate or underestimate the contribution of urbanization.
Terrain effects are also crucial to the local circulations (Li et al 2017) and play an important role in spatial distribution of precipitation (Fu et al 2019). Our results indicate that the spatial pattern of annual/seasonal precipitation is mainly influenced by the terrain features. Although urbanization has no significant influence on the spatial patterns of precipitation, it may reinforce the terrain effects, for example, as demonstrated by the secondary centers of precipitation appearing in or near the urban areas (figure 2). Meanwhile, it should be noted that some more complex spatial patterns of precipitation are found when comparing the results in post-1987 versus that in pre-1987, especially for seasonal precipitation, suggesting that urbanization may principally influence the local pattern of precipitation.
Besides, we find notable differences in the contribution estimated based on the different classification of urban and rural areas (figures 8 and S6), indicating the classification has a significant influence on the overall analytical results when assessing the urbanization contribution to precipitation changes. Although prior work has highlighted that the impacts of urbanization on temperature significantly differ depending on the classification of urban and rural areas (Hansen et al 2001), very few studies have paid attention to this matter regarding precipitation changes (Jiang and Li 2014). These studies found that the difference in precipitation between urban and rural stations is sensitive to the urban-rural classification in the early urbanization (1960–1979), but is not liable in the rapid urbanization (1980–2009). For the first time, we provide evidence-based information regarding the uncertainty in the contribution of urbanization to precipitation changes associated with various criteria used for urban-rural classification. Indeed, the difficulty in determining the justifiable threshold for identifying urban areas from the different data (Zhao et al 2019), such as nighttime light, population, may cause even larger uncertainty, which needs further study in this direction.
Indeed, the statistical analyses may be affected by sampling, and as such a bootstrapping approach is applied to estimate the differences (figure S7). The results of CRmean do not significantly change after applying the bootstrapping samples, but those of CRslope do. That is, the CRmean is more sensitive to the selected samples than CRslope. Nevertheless, similar results of CRmean and CRslope (table 1) also indicate the conclusions from the two indices are still credible. As previous studies have revealed, it is still a huge challenge to estimate the effects of urbanization on precipitation because of the dynamic and complex processes influenced by various factors and their interactions (Freitag et al 2018, Liu and Niyogi 2019, Gu et al 2019b). The proposed method needs to be elaborated in future work with the help of physical-based numerical experiments and/or high-resolution observation records.
4. Conclusions
Investigating the urbanization effects on regional climate change is vital for acquiring a better understanding of the impact of landscape changes on local and regional climate. In this study, we investigate the influence of urbanization on precipitation patterns using the daily precipitation observation records across the BTH region in northern China from 1958 to 2017. Firstly, we integrate the classification of urban and rural stations based on the various criteria and data (e.g. land use, population and nighttime light). Then, we derive two indices to assess the contribution of urbanization via quantifying the urban-rural differences in precipitation changes for different types of stations and periods. Results show that urbanization can alter the local variations in precipitation but have a limited effect on the spatial patterns of annual/seasonal precipitation. The urbanized, urbanizing and rural areas experience similar trends of precipitation during 1958–2017, with an increase in spring, autumn and winter, and a decrease in summer, which leads to the reduction of annual precipitation in the same period. The distinct trends in annual and seasonal precipitation in both pre- and post-1987 periods indicate that the urban signature in precipitation may not alter the trends that are mainly induced by climate change or variability. Both negative and positive contributions of urbanization to precipitation changes are found to exist, suggesting that the contribution may be related to seasons. The contribution of urbanization to annual and seasonal precipitation is not consistent with the level of urbanization. Yet, most cases show positive contributions or higher impacts for high-level urbanization compared with low-level urbanization, indicating that the results may also be correlated with the levels of urbanization. Certainly, the effect of urbanization feedback on precipitation is evolving because the precipitation changes are dynamic and complex, associated with several other factors. Therefore, our results should be interpreted as illustrative rather than definitive. This article is a first step in the development of quantitative analysis for assessing the contribution of urbanization to precipitation changes, which draws attention to an important issue that requires further investigation in the future with the help of high-resolution observations and physical-based dynamic modeling.
Acknowledgments
This work was supported by the National Key Research & Development Program of China (2017YFC1502701), the National Natural Science Foundation of China (51979271, 51609242), the Fundamental Research Funds for the Central Universities (2015XKMS034), the China Postdoctoral Science Foundation (2018M632333). This project was also funded by the Priority Academic Program Development (PAPD) of Jiangsu Higher Education Institutions. The first author is also grateful for support from China Scholarship Council. YX's contribution is supported by the Royal Academy of Engineering Newton Fund (Grant Ref: UUFIP\10021). We are grateful to Dr. Feng Kong (School of Public Policy and Management, Tsinghua University) for his support for the rainfall data collection.
Data availability statement
The data that support the findings of this study are available upon reasonable request from the authors.
Conflict of interest
The authors declare that they have no conflict of interest.