


Remote Sens. 2024, 16(9), 1642; https://doi.org/10.3390/rs16091642 (registering DOI) - 04 May 2024
Abstract
Hyperspectral LiDAR (HSL) has been utilized as an efficacious technique in object classification and recognition based on its unique capability to obtain ranges and spectra synchronously. Different kinds of HSL prototypes with varied structures have been promoted and measured its performance. However, almost
[...] Read more.
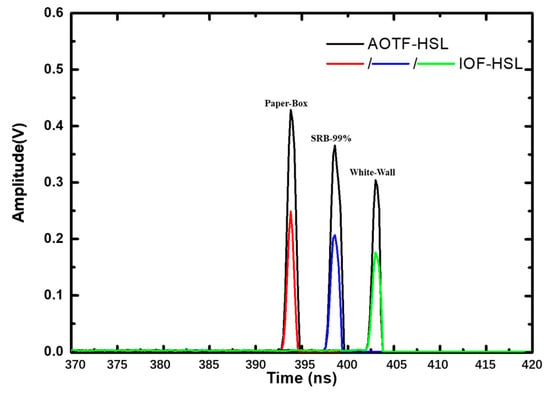
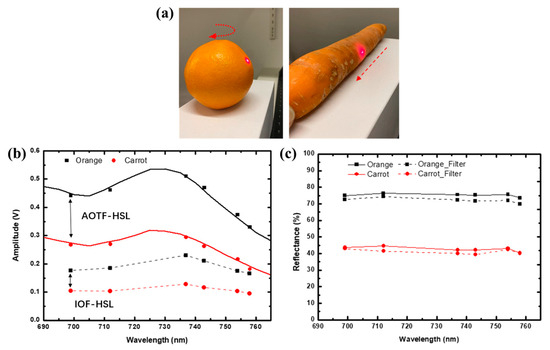
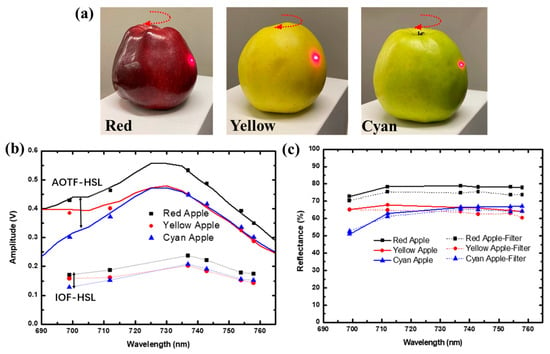
Hyperspectral LiDAR (HSL) has been utilized as an efficacious technique in object classification and recognition based on its unique capability to obtain ranges and spectra synchronously. Different kinds of HSL prototypes with varied structures have been promoted and measured its performance. However, almost all of these HSL prototypes employ complex and large spectroscopic devices, such as an Acousto-Optic Tunable Filter and Liquid-Crystal Tunable Filter, which makes this HSL system bulky and expensive, and then hinders its extensive application in many fields. In this paper, a smart and smaller spectroscopic component, an intergraded optical filter (IOF), is promoted to miniaturize these HSL systems. The system calibration, range precision, and spectral profile experiments were carried out to test the HSL prototype. Although the IOF employed here only covered a wavelength range of 699–758 nm with a six-channel passband and showed a transmittance of less than 50%, the HSL prototype showed excellent performance in ranging and spectral profile collecting. The spectral profiles collected are well in accordance with those acquired based on the AOTF. The spectral profiles of the fruits, vegetables, plants, and ore samples collected by the HSL based on an IOF can effectively reveal the status of the plants, the component materials, and ore species. Finally, we also showed the integrated design of the HSL based on a three-dimensional IOF and combined with a detector. The performance and designs of this HSL system based on an IOF show great potential for miniaturizing in some specific applications.
Full article
(This article belongs to the Special Issue Remote Sensing and Lidar Data for Forest Monitoring)
►
Show Figures

Figure 1


