
Symmetry Detection and Analysis of Chinese Paifang Using 3D Point Clouds


1
School of Geography and Planning, Sun Yat-sen University, Guangzhou 510275, China
2
Guangdong Provincial Key Laboratory of Urbanization and Geo-Simulation, Sun Yat-sen University, Guangzhou 510275, China
3
Department of Geography, College of Science, Swansea University, Swansea SA2 8PP, UK
4
School of Civil Engineering, Anhui Jianzhu University, Hefei 230601, China
*
Author to whom correspondence should be addressed.
Symmetry 2021, 13(11), 2011; https://doi.org/10.3390/sym13112011
Submission received: 25 September 2021
/
Revised: 17 October 2021
/
Accepted: 20 October 2021
/
Published: 23 October 2021
(This article belongs to the Special Issue Symmetry in Building Model)
Abstract
:The Chinese paifang is an essential constituent element for Chinese or many other oriental architectures. In this paper, a new method for detection and analysis of the reflection symmetry of the paifang based on 3D point clouds is proposed. The method invokes a new model to simultaneously fit two vertical planes of symmetry to the 3D point cloud of a paifang to support further symmetry analysis. Several simulated datasets were used to verify the proposed method. The results indicated that the proposed method was able to quantity the symmetry of a paifang in terms of the RMSE obtained from the ICP algorithm, with resistance to the presence of some random noise added to the simulated measurements. For real datasets, three old Chinese paifangs (with ages from 90 to 500 years) were scanned as point clouds to input into the proposed method. The method quantified the degree of symmetry for the three Chinese paifangs in terms of the RMSE, which ranged from 20 to 61 mm. One of the paifangs with apparent asymmetry had the highest RMSE (61 mm). Other than the quantification of the symmetry of the paifangs, the proposed method could also locate which portion of the paifang was relatively more symmetric. The proposed method can potentially be used for structural health inspection and cultural studies of the Chinese paifangs and some other similar architecture.
1. Introduction
The Chinese paifang is one of the most important components of ancient Chinese architecture. It is an archway structure first appeared at the Spring and Autumn period (BC 771–476) in China. It can be found in a wide range of places and communities, e.g., giant palaces or towns. After many years of evolution, the paifangs not only act as gateways to divide different regions, but also serve as monuments to recognize celebrities or important events. The paifangs are mainly composed of pillars and eaves, usually built with a highly symmetrical style [1]. Their symmetry is one of the common characteristics found in Chinese architecture due to the cultural background [2]. Even though almost all Chinese paifangs were built with symmetry, their symmetries have rarely been investigated quantitatively in the literature. This is likely due to the fact that the degree of symmetry of the paifangs can hardly be quantified (and then analyzed) without an appropriate geometric model to estimate their symmetry. The symmetry analysis of the paifangs can help us gain more insight into the construction skills and techniques of ancient Chinese architecture, and more importantly, to examine the structural stability for civil engineers.
With the recent advances in three-dimensional (3D) laser scanning and photogrammetric reconstruction techniques [3,4], surfaces of an object can be readily measured and recorded as a vast number of points represented by their 3D coordinates (known as point clouds). Detecting symmetry from the 3D point cloud of an object has been an important task in the field of computer vision, photogrammetry and architectural design [5,6,7]. For example, Ecins et al. estimated the positions of the plane of symmetry from the point clouds [8]. They first used an initial plane of symmetry to divide groups of points and then pair up the points which were considered as symmetrical. Then, they used the Levenberg–Marquardt estimator to compute the planar parameters. Xue et al. [9] developed a derivative-free optimization method to detect the symmetry from point clouds of buildings. They first divided the point clouds into different slices and then estimated the central axis of each slice to speed up the computation. These methods are mainly based on the least-squares optimization techniques that estimated sets of parameters to compose the symmetry.
For computation of the symmetry using machine learning approaches, Gao et al. developed a convolutional neural network (CNN) to estimate the plane of symmetry of a set of objects including tables, cabinets and boats [10]. The CNN required training data to input into the model. Ji and Liu presented a framework using a deep learning and point-based classification technique to estimate the plane of symmetry from point clouds [11]. In their work, the random sample consensus (RANSAC) algorithm was employed to classify the points into different groups for the deep learning. Furthermore, Wu et al. proposed a symmetry detection method for occluded 3D point clouds based on deep learning [12]. Their method invoked a CNN for segmentation of the normal vectors to find out the plane of the symmetry. These methods are accurate, but applying them for the paifangs would be a problem as the paifang is always covered by different or unique statuary. As a result, accurate sets of training data for the paifangs would be difficult to obtain.
The aforementioned methods mostly focused on the detection of a single plane of symmetry for the reflection symmetry. Reflection symmetry refers to a type of symmetry for which a plane of symmetry divides an object into two halves and any one half is the reflection of the other. A cuboid has three planes of symmetry that are mutually perpendicular, forming reflection symmetry [13]. A Chinese paifang and many other Chinese architecture components such as the bell and drum towers [14], possess two (vertical) planes of symmetry in general. Therefore, we need a method which can accurately and simultaneously estimate two vertical planes of symmetry for such types of architecture to quantify the degree of symmetry and support related studies. Some of the paifangs are covered with complicated statues, and they are supposed to be symmetric regardless of the complexity. Estimating two perpendicular planes of symmetry can facilitate a thorough analysis of the degree of symmetry of the paifangs. Moreover, the positions (e.g., the center of the planes) and orientations of these planes of symmetry should also be estimated for the paifang to support further applications.
In this paper, a new method for the computation of parameters of the two vertical planes of symmetry is proposed to detect and analyze the reflection symmetry of a Chinese paifang. The proposed method consists of a new approach for the parametrization of the two vertical planes of symmetry. Rather than fitting conventional planar parameters [15,16], the proposed method breaks down the plane-fitting problem into a line-fitting problem which is more straightforward and tractable [17]. One of the advantages of the proposed method is that there is no need for the users to estimate the point-to-point correspondence using an initial plane of symmetry or any training datasets prior to the actual planar parameter estimation. The paper is organized as follows: Section 2 describes the workflow of the proposed method and the geometric models; Section 3 focuses on the collection of the simulated and real datasets; Section 4 and Section 5 present the results of the analysis and conclude the work, respectively.
2. Method
2.1. Overall Workflow
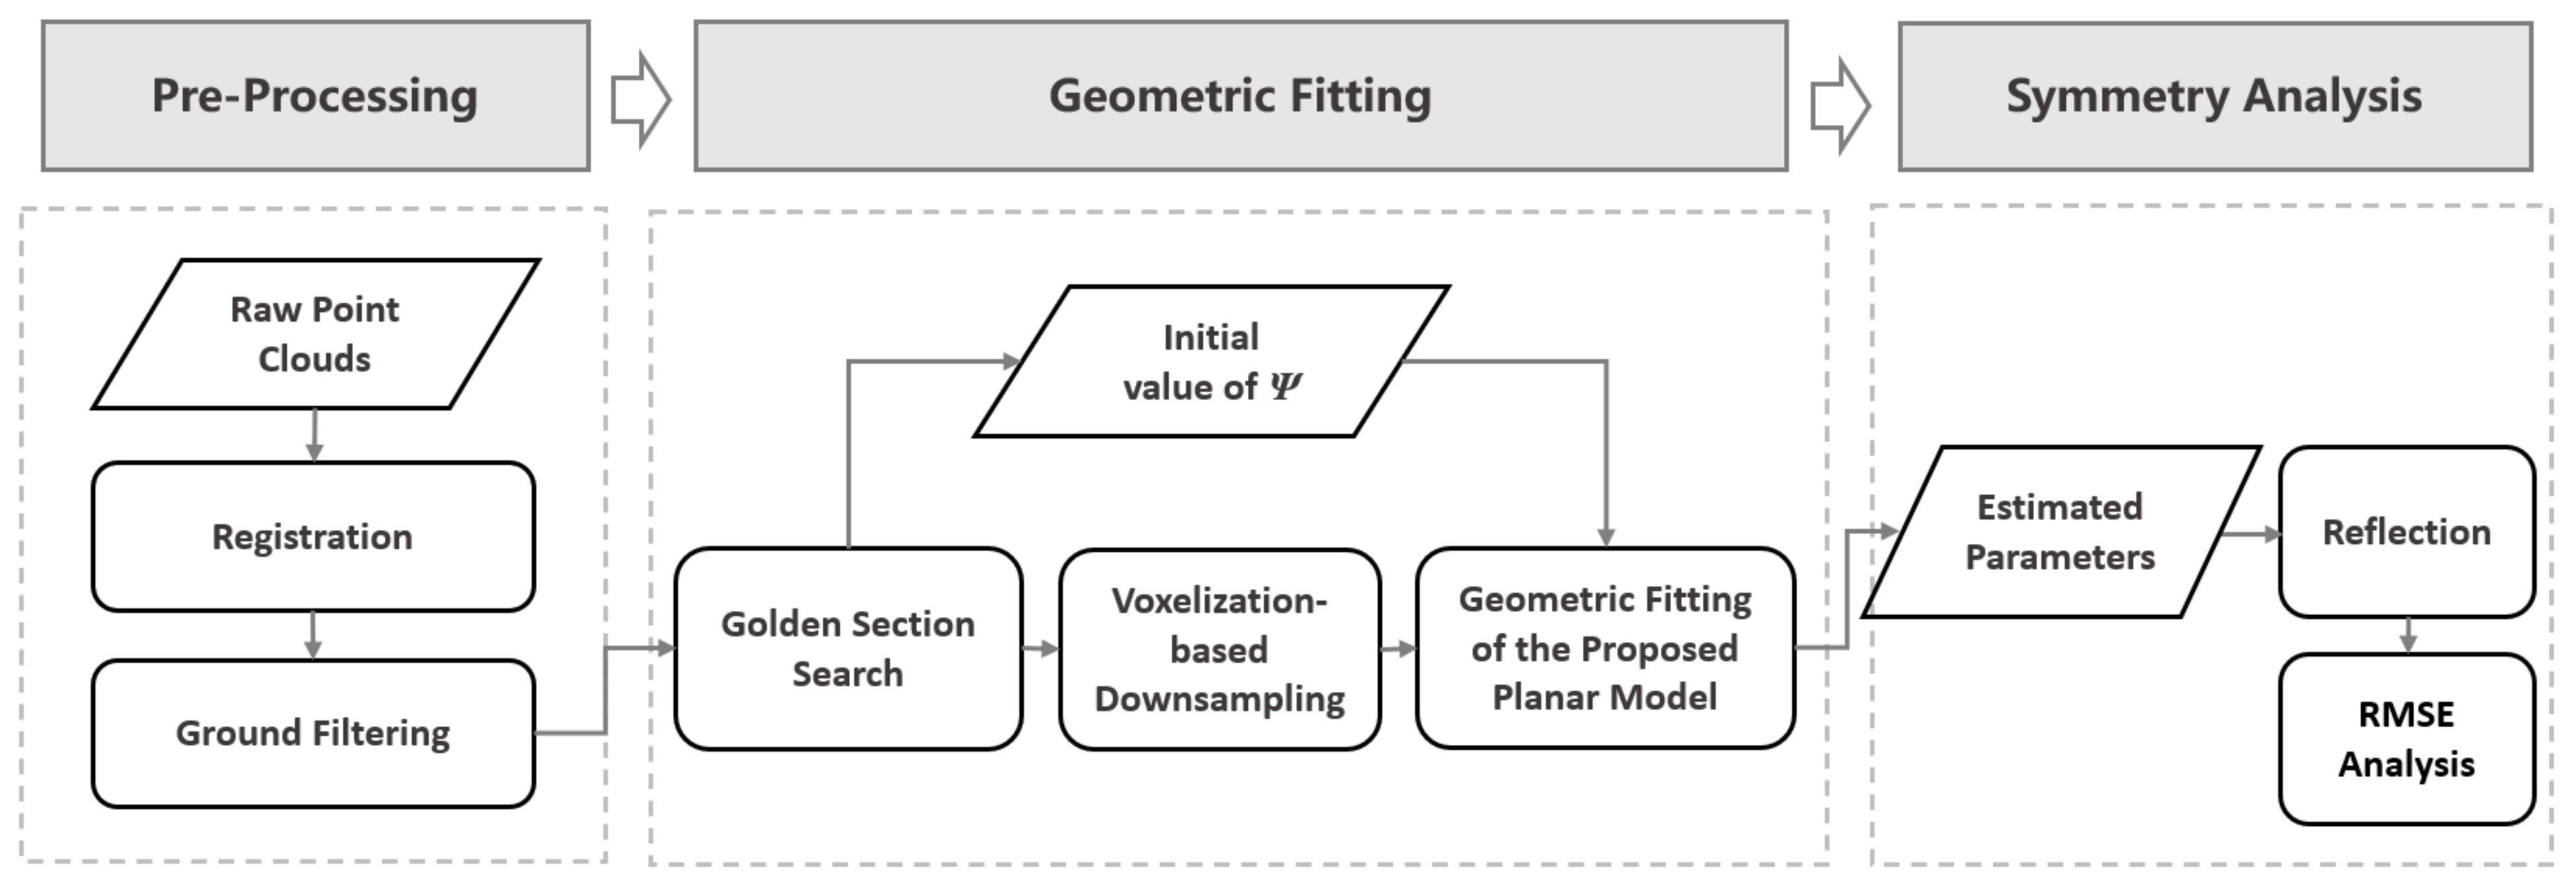
Before the fitting is performed, raw point clouds should be processed with multiple steps (e.g., registration and ground filtering). The workflow of the proposed method is shown in Figure 1.
The paifang should be scanned in a way that the scanner positions are evenly distributed to keep the point density as unified as possible. This will result in a more accurate geometric fitting of the paifangs. The scanned point clouds should be accurately registered (e.g., [18]) before further processing is performed. Then, a ground filtering (e.g., with the cloth simulation filter [19]) and some manual editing should be applied to extract the entire point clouds of the paifangs. After the registration and ground filtering, the initial values of the rotation angle about the Z-axis (Ψ) of the paifang should be computed so the least-squares solution can converge within several iterations. This can be achieved by minimizing the difference (ξ) between the absolute values of the range of the X and Y coordinates of the paifang using the golden section search method [20], as the model fits the data at a slope of 45° in the X–Y plane (this will be explained in the next subsection). ξ can be expressed as follows:
where:
After the initial value of Ψ is estimated, it can be used to rotate the paifang’s point cloud for voxelization [21]. The voxelization is needed for a downsampling process that reduces the point density differences found in the point cloud. When the paifang is scanned with terrestrial scanners mounted on tripods, the points at lower positions usually have higher point densities. The average point number after the voxelization can be used as a threshold to reduce the point density for those voxels with higher point density, so that the accuracy of the subsequent fitting can be improved. After all the aforementioned steps are performed, the fitting can be executed. The parameters obtained from the fitting are then used to transform the point cloud into a nominal position and then into an initial position, so that points separated by the planes of symmetry can be readily reflected and grouped for the symmetry analysis, based on the computation of the RMSE after the symmetric parts of the paifang undergo the reflection.
2.2. Geometric Fitting
2.2.1. Proposed Planar Model for the Reflection Symmetry
Instead of fitting the 3D point cloud of a Chinese paifang to the conventional geometric model (also known as the general equation of a plane which consists of four parameters [22,23]) in the Cartesian space, the proposed method is based on fitting the point cloud to a set of new geometric models for two mutually perpendicular vertical planes as the planes of symmetry.
Rearranging the geometric models, the functional models for the subsequent least-squares fitting are expressed as follows:
where:
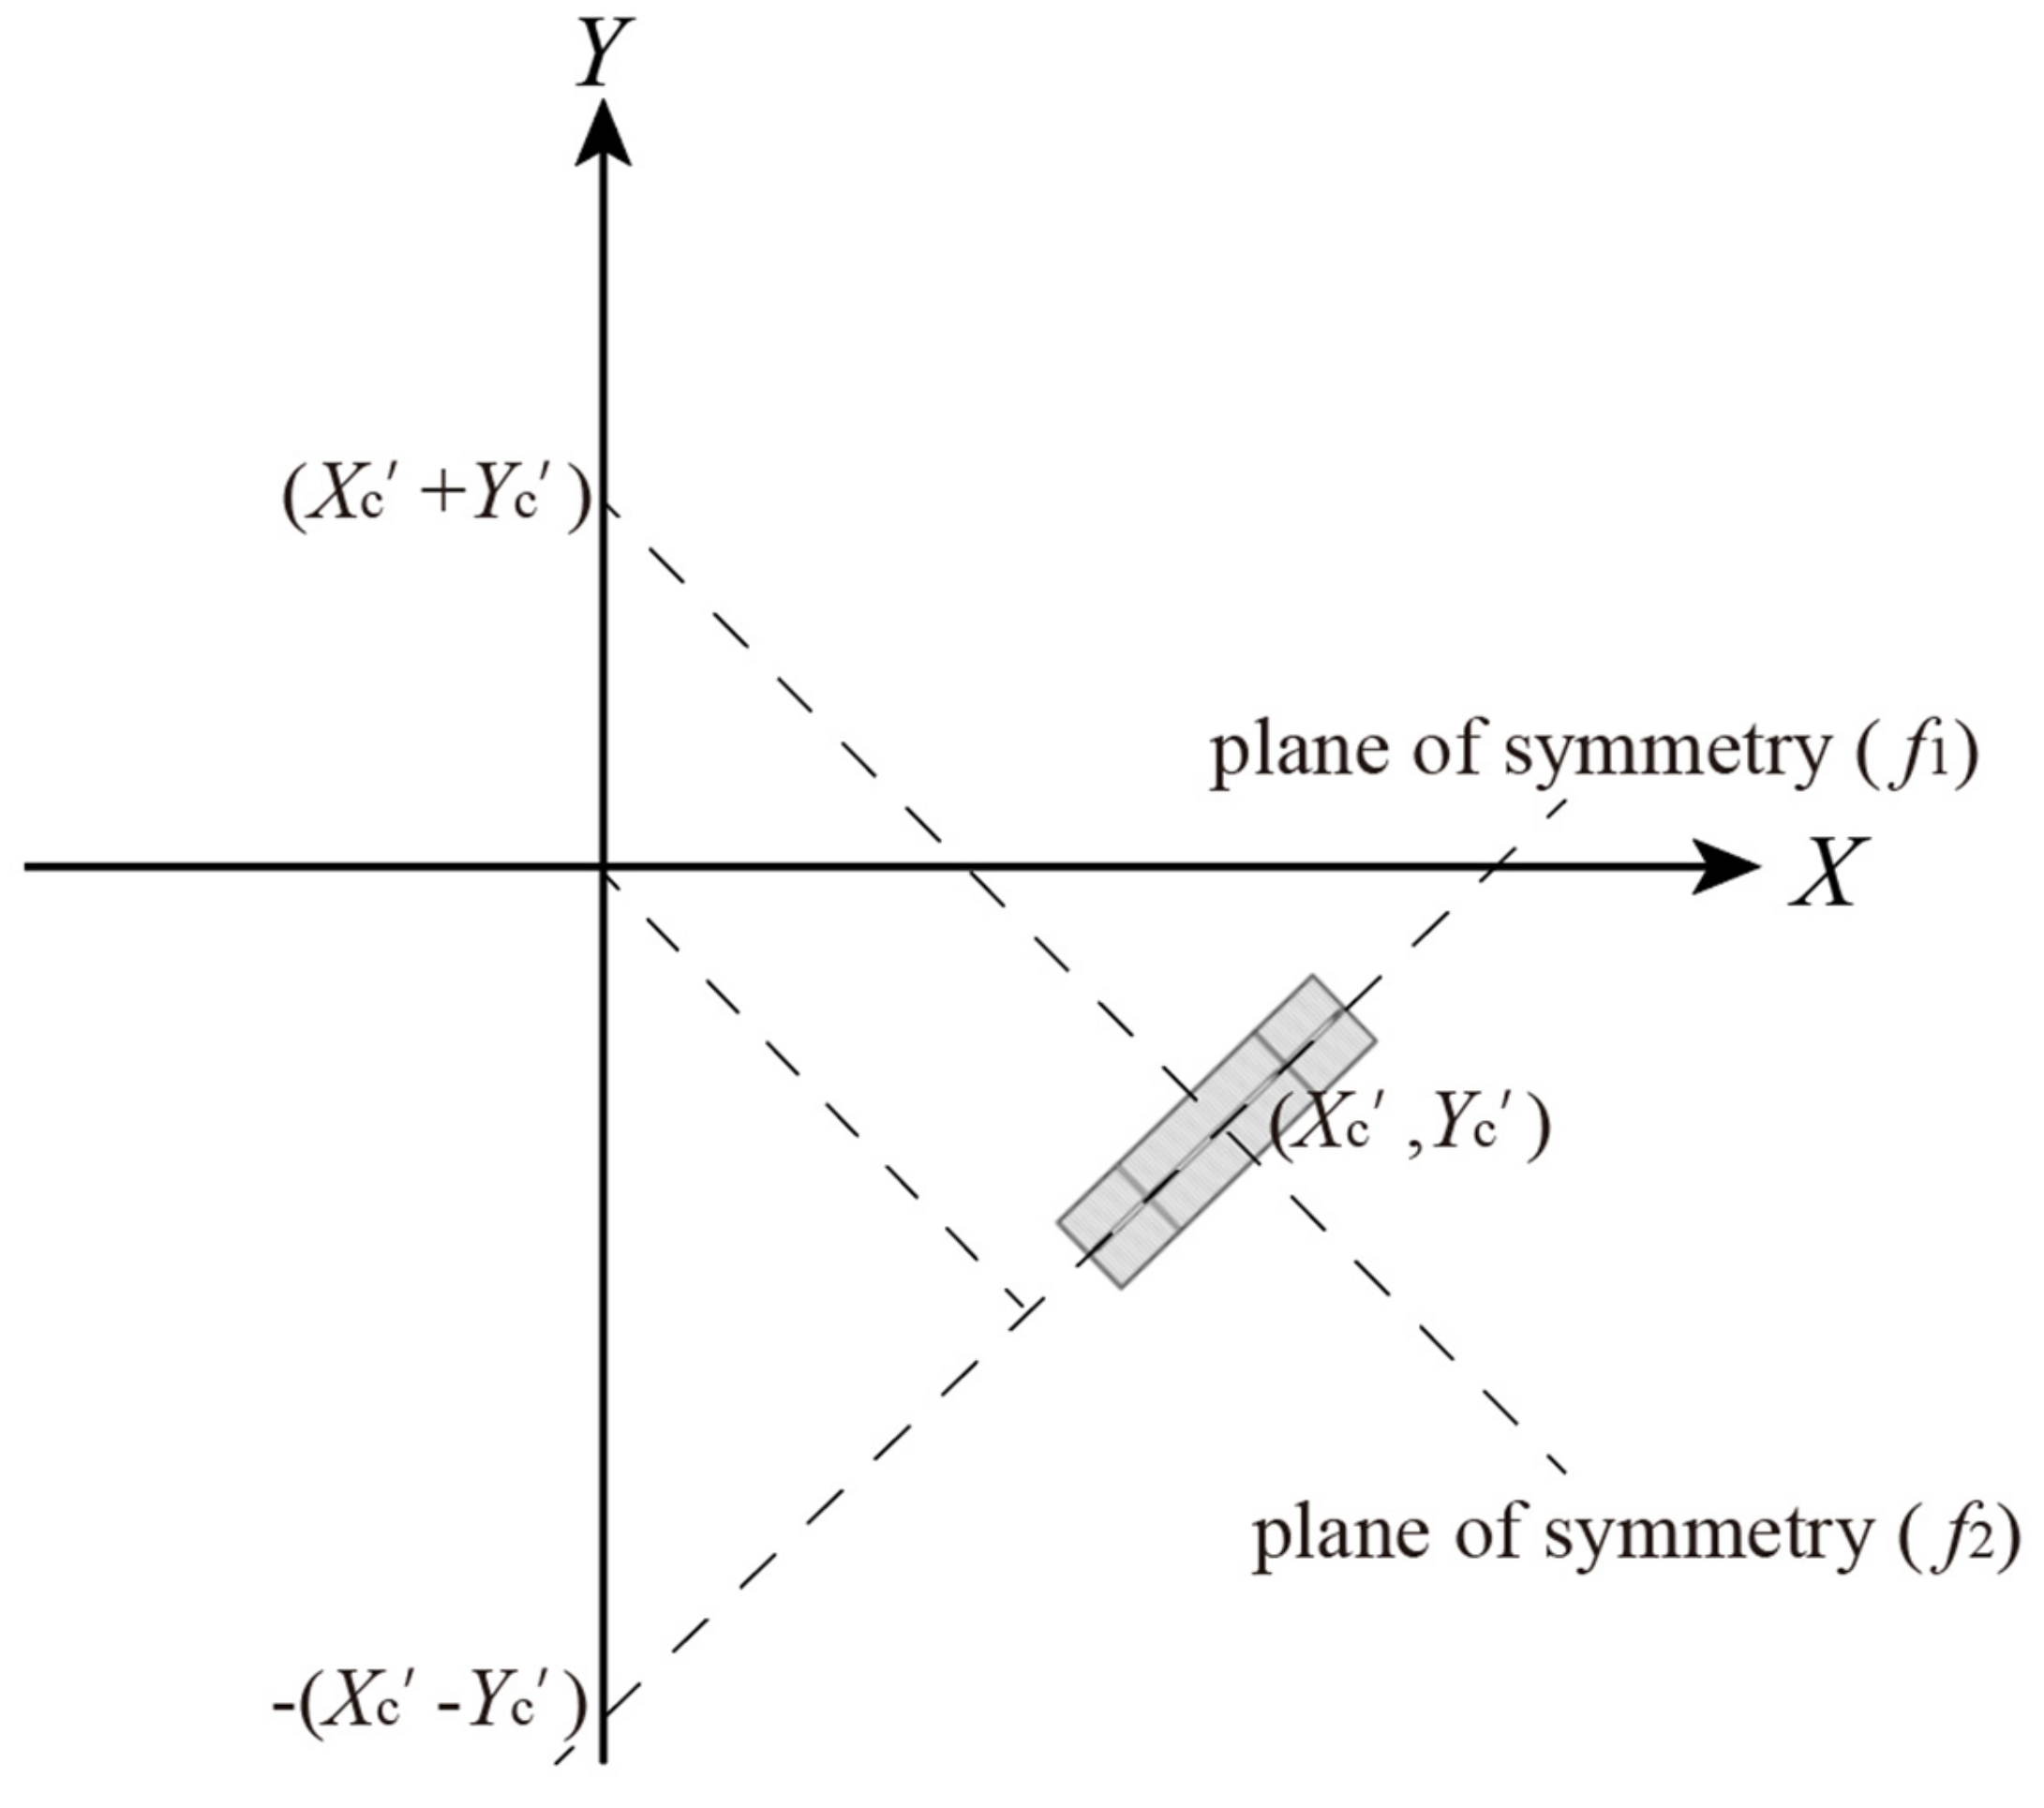
and are the vector storing the parameters and the observations (the coordinates of the 3D point cloud), respectively; (Xc′, Yc′) and (Xc, Yc) are the center of the two perpendicular planes of symmetry on the X–Y plane at the nominal and original positions, respectively; Ω, Φ and Ψ are the Euler angles about the X, Y and Z-axes, respectively; R1, R2 and R3 are the rotation matrices about the X, Y and Z-axes, respectively. Figure 2 and Figure 3 show the model parameters in a 3D and bird-eye view, respectively.
Observations of the paifang with arbitrary positions and orientations are first rotated into a nominal position (Figure 2 and Figure 3) so that the two purely vertical and perpendicular planes of symmetry (Equations (3) and (4)) are fitted simultaneously to them based on the least-squares criteria (i.e., sum of the squares of the planar residuals are minimized). It is worth noting that the X-Y center of the paifang (Xc, Yc) is not first translated to the origin, which is different from the other 3D models [7,24,25], because Xc and Yc are absolutely correlated if they are translated in that way. The geometric models of the purely vertical planes are the same as that of the 2D straight lines (the direction cosines for the Z direction are zero), only one coordinate (Xc/Yc) can serve as the X/Y-intercept. Therefore, Xc and Yc cannot be simultaneously translated to the origin. Instead, Xc′ and Yc’ are estimated in the model. After the parameters are estimated, the center of the planes of symmetry that divided the original point cloud (at the original positions) can be readily calculated using the following equation (backward rotation sequence):
2.2.2. Least-Squares Estimation
For simplicity, the observations are replicated so that two identical sets of observations are input into the Gauss–Helmert least-squares model [26] for the fitting as the observations are constrained to satisfy the two planar models simultaneously. The linearized adjustment model is:
where is the correction vector for the model parameters; A is the design matrix of partial derivatives of the linear/planar models with respect to the parameters; B is the design matrix of partial derivatives of the linear/planar models with respect to the observations; and w are the residual and the misclosure vectors for the models, respectively.
As two planes of symmetry are estimated, the observations are duplicated to fit to the models to solve the same set of parameters. A is broken down into A1 and A2 for f1 and f2, respectively. The normal equation for the least-squares fitting is:
where P is the weight matrix for the observations. In practice, the terrestrial scanner is usually precisely levelled for scanning, and there is an assumption that the paifang is almost purely vertical. Therefore, estimation of the vertical angles (Ω, Φ) can be skipped to increase the degree of freedom. In addition, this waives the process of estimating an accurate set of initial values of the vertical angles for the fitting.
2.3. Symmetry Analysis
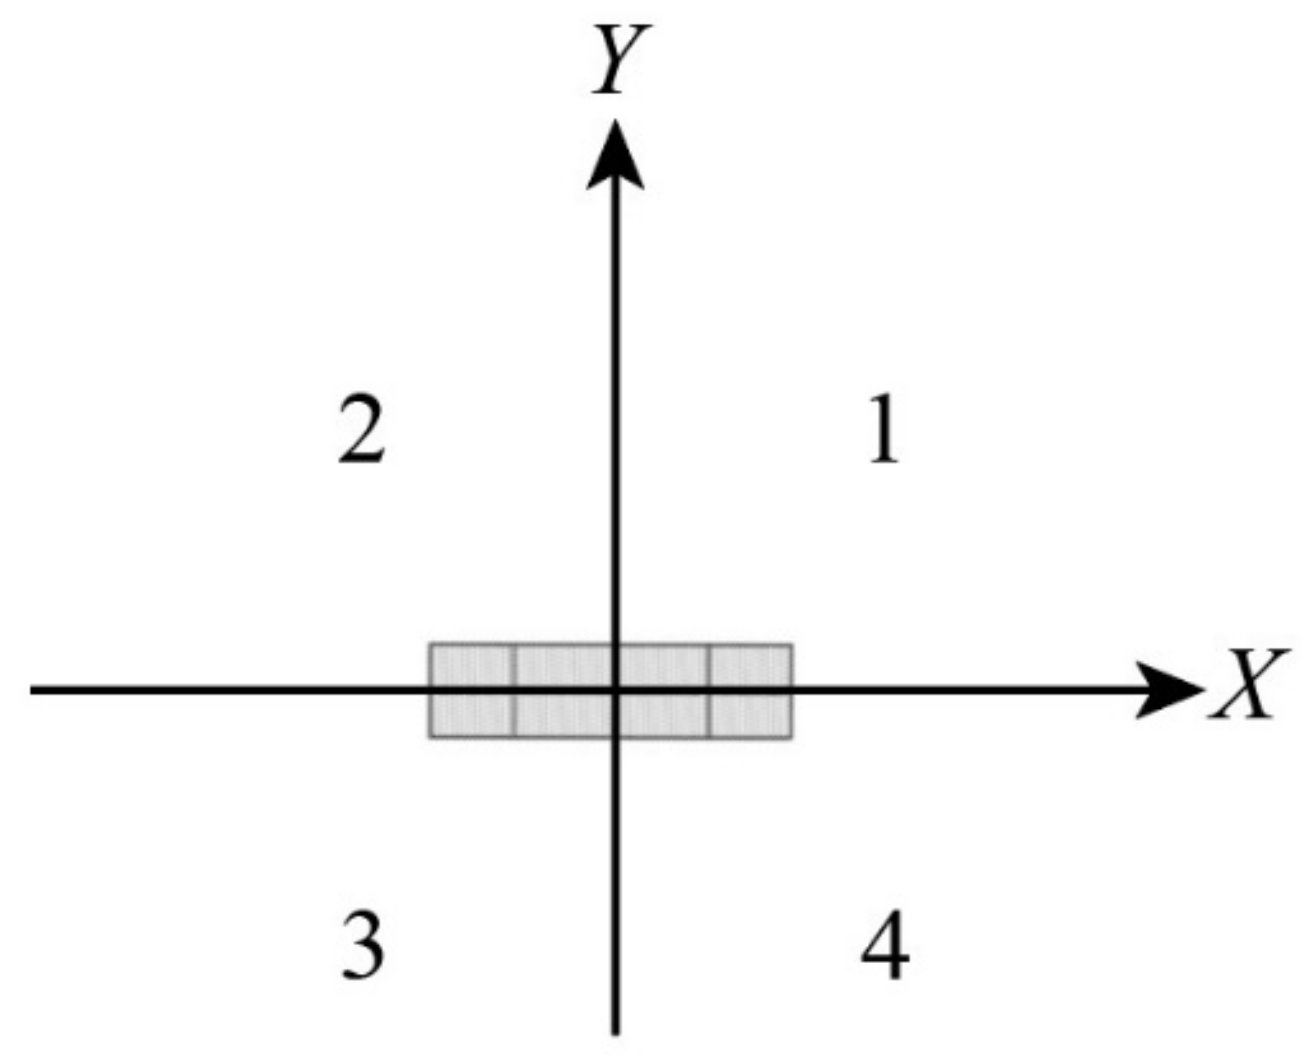
After the model parameters are estimated, the original point cloud of the paifang can be translated to an initial position centered at the origin, as illustrated in Figure 4, by using the following equation:
The paifang can now be divided into four quadrants based on the models and the estimated parameters. The points in quadrants 1 and 2 can be translated using Equation (9) (reflection about the X-axis) to quadrants 3 and 4. After the translation, the translated points are matched to the original points at quadrants 3 and 4 using the iterative closest point (ICP) method [27]. The root-mean-square error (RMSE) obtained from the ICP is then used for the quantification of the degree of symmetry (f1). For this case, the RMSE can be rewritten with subscripts so that it becomes RMSEx. Similarly, the points in quadrants 2 and 3 can be translated using Equation (10) (reflection about the Y-axis) to quadrants 1 and 4 to perform the ICP and obtain RMSEy for the quantification of the degree of symmetry (f2).
3. Experiments
3.1. Simulated Datasets
Two paifangs were simulated as point clouds using MATLAB for the method verification and analysis. The simulated point clouds of the paifangs are shown in Figure 5. Both paifangs consist of two pillars, bases and eaves They are identical except the one shown in Figure 5b is not perfectly symmetric as an additional part (blue) is added to the top of the eave above one of the pillars. The point clouds of the paifangs were then processed under different conditions (e.g., with different random noise added) for further analysis. The details of the simulated paifangs are shown in Table 1.
3.2. Real Datasets
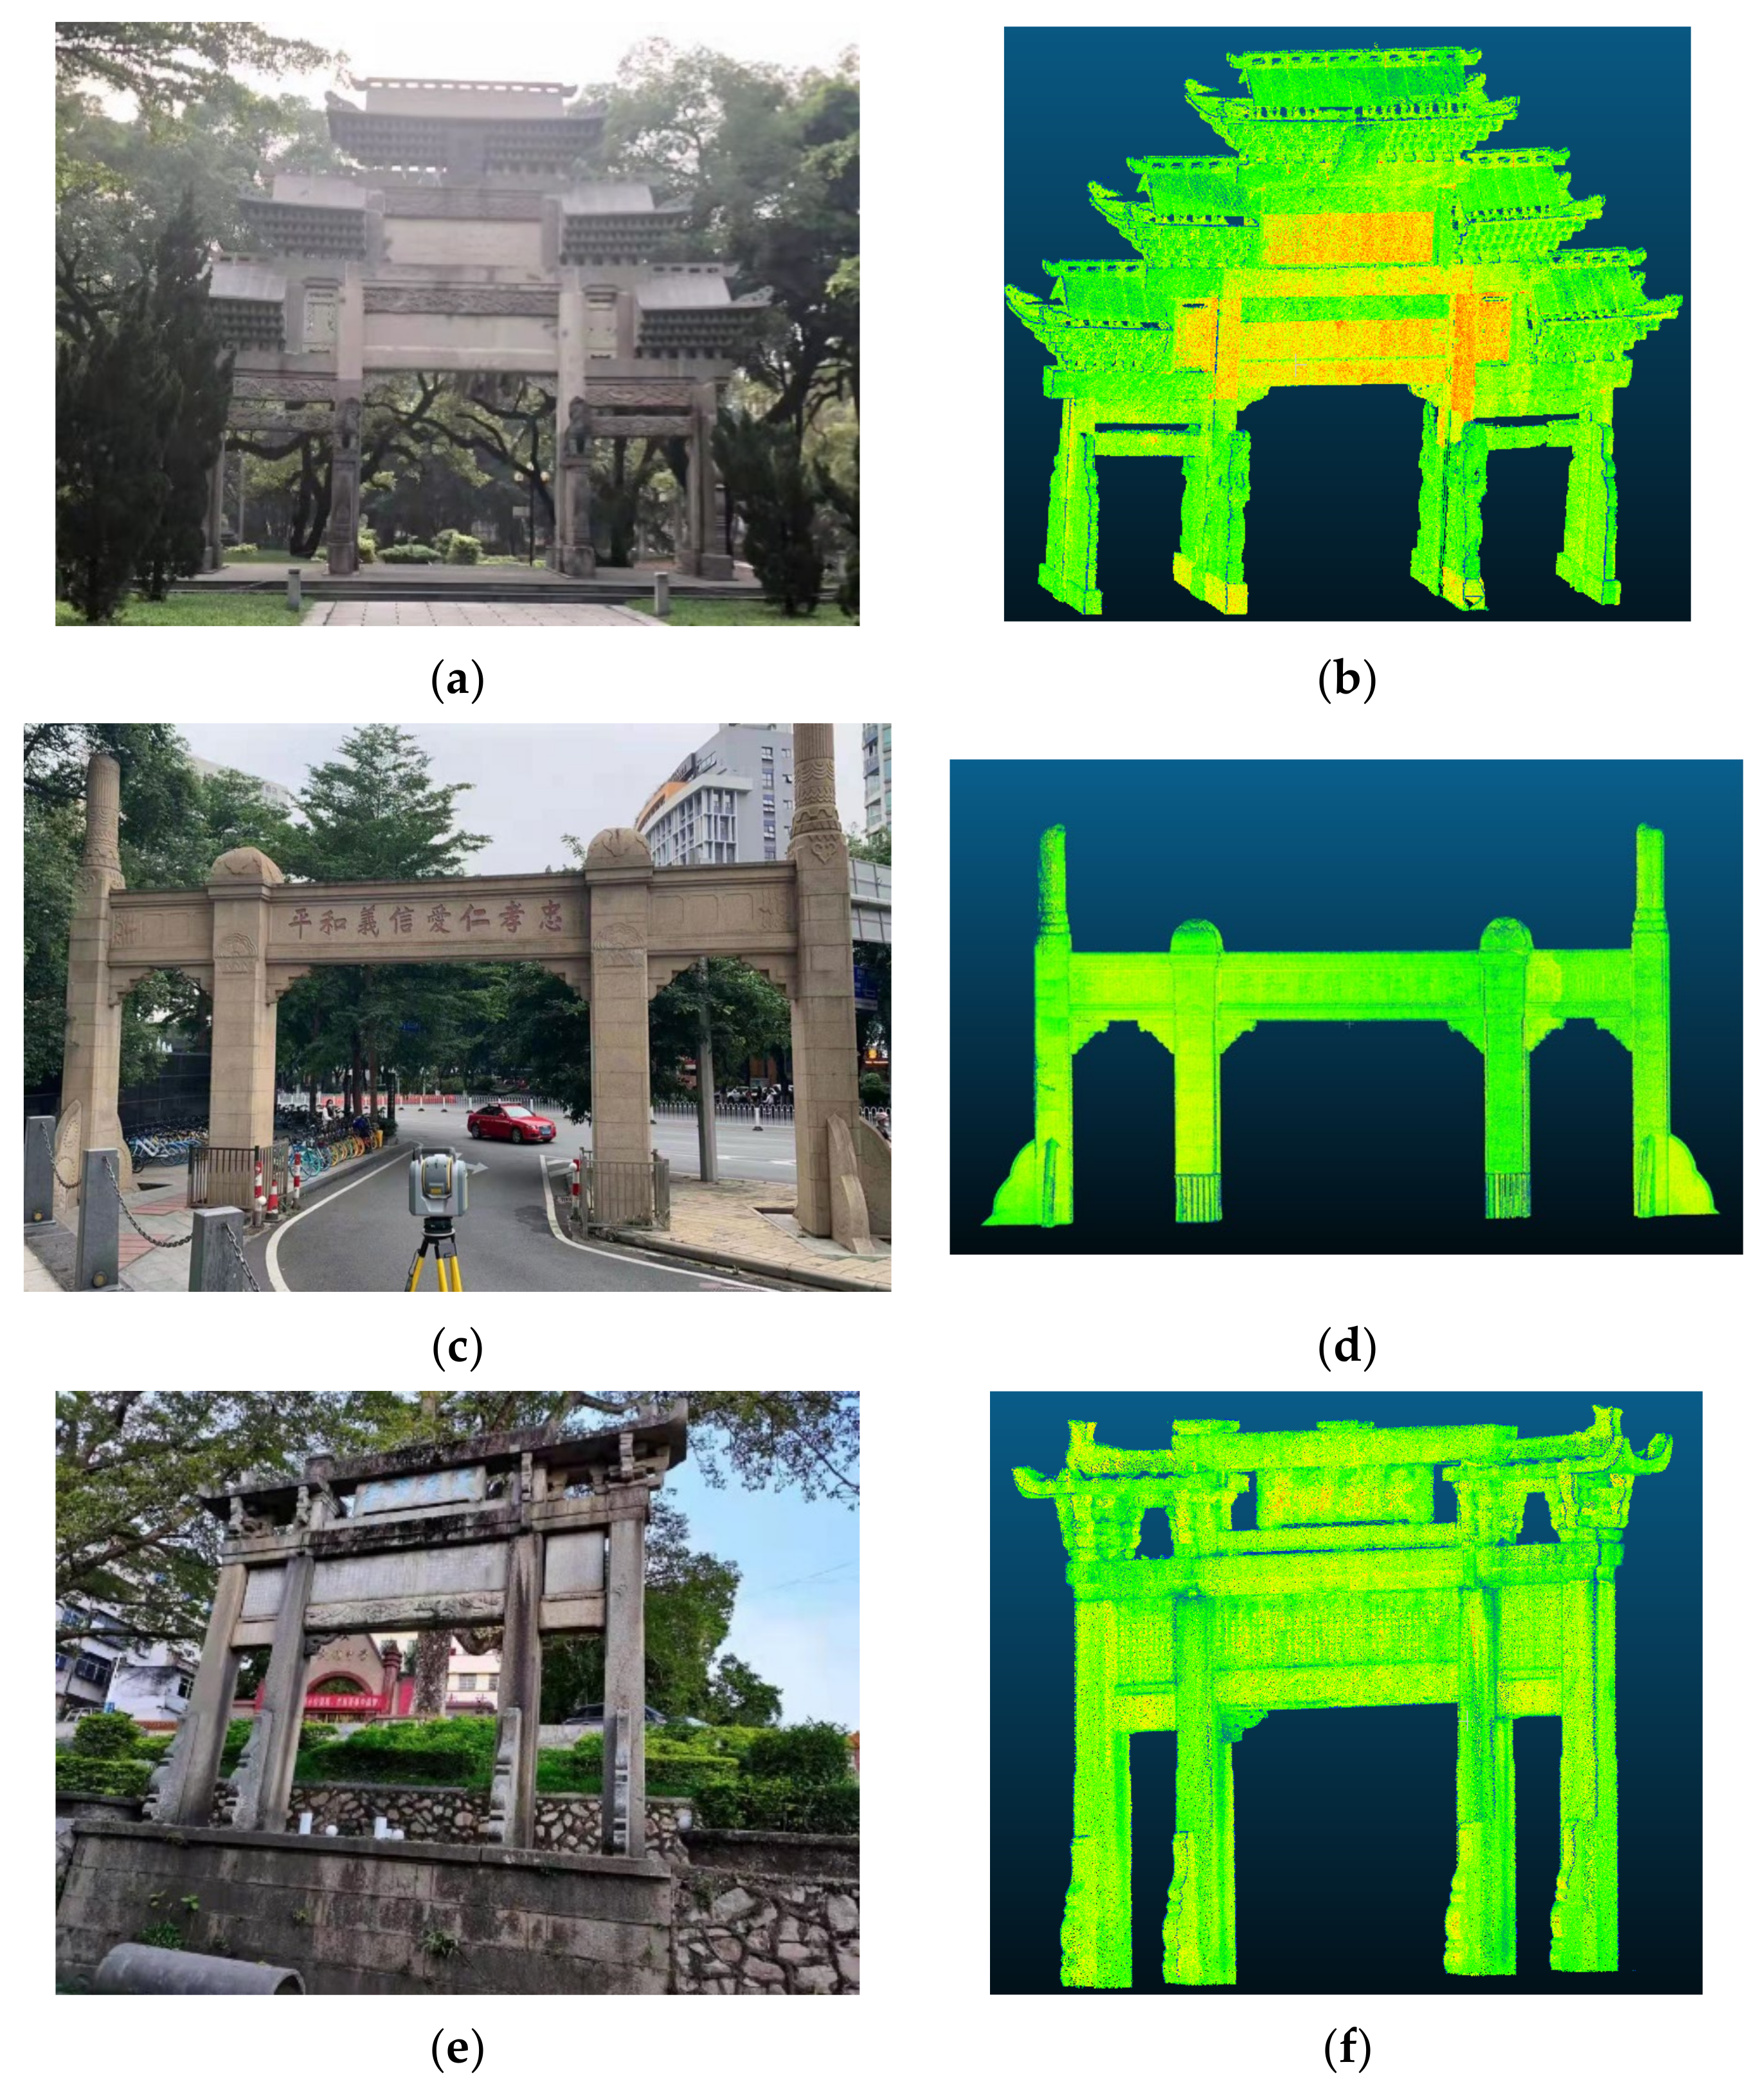
Three ancient Chinese paifangs were scanned as point clouds (Figure 6) using the Trimble SX 10 scanner mounted on a levelled tripod in the Guangdong Province, China. The point clouds of the paifangs are labelled as paifang A, B and C. Their details are shown in Table 2. Paifang A is named Jinshi, it was built around the late Ming dynasty (AC 1368–1644). Paifang B was built inside the Sun Yat-sen University campus in 1935. Paifang C was named Tianbaojiexiao. It was built in the mid-Qing dynasty (AC 1636–1912).
4. Results
4.1. Results for the Simulated Datasets
Figure 7 shows the RMSEs obtained from the ICP matching versus the random error (RE) added to the simulated point cloud of a perfectly symmetric paifang, S1 (Figure 5a). It can be seen that the trend of the RMSEx and RMSEy are almost identical, they are increasing along with the RE. The RMSEs are almost equal to each other because the paifang is perfectly symmetric in both directions. The RE causes the asymmetry of the simulated paifang. When there is no RE, the RMSEx and RMSEy are both zero as the paifang is perfectly symmetric in both directions. As the RE is being added to the paifang, the RMSEs serve as quantities to measure the symmetry. The larger the RE is, the higher the RMSEs are.
When the simulated paifang becomes asymmetric in the X-direction, S2 (Figure 5b), the RMSEy increases significantly as shown in Figure 8. The RMSEx stays the same as that of the original simulated paifang. This is because the paifang is still symmetric in the Y-direction. It is worth noting that the RMSEx stays around 29 mm regardless of the increment of RE. This indicates that the RMSE is significantly governed by the asymmetry, and is resistant to the change of RE. Therefore, RMSE can reflect the degree of symmetry regardless of a reasonable range of random errors found in the measurement. When there is no RE and the paifang is perfectly symmetric in both directions, both RMSEs vanish. The proposed method invokes the ICP to match the different parts divided by the two mutual perpendicular planes of symmetry. As a result, the proposed method is shown to be efficient in reflecting the degree of the symmetry using the RMSE regardless of the existence of the random errors in the method.
4.2. Results for the Real Datasets
Figure 9 shows the estimated planes of symmetry (magenta) for paifang A. It can be seen that the planes divide the paifang into four quadrants as expected. It is assumed that most of the points are symmetrical, so the estimated planes are closest to the planes of symmetry. Similarly, the estimated planes of symmetry are shown in Figure 10 and Figure 11 for paifangs B and C, respectively. It can be seen that the planes divide the paifangs into four quadrants. It is worth noting that the base stones are missing on one side for Paifang C as indicated by Figure 11b. However, the planes of symmetry still divide the paifang at the central positions because most of the points (or the majority of the points) in the paifang are still lying on a symmetrical pattern.
Figure 12 shows the histograms of the point distribution for paifang A. Figure 10a depicts the points distributed in quadrants 1-2 and 3-4 along the X-direction. It can be seen that most of the points from the two quadrants have a very close distribution pattern. However, it is not the case for the points distributed in quadrants 2-3 and 1-4 along the Y-direction as seen in Figure 10b. These suggest that paifang A is more symmetric along the X-direction compared to Y-direction. If paifang A is perfectly symmetric in both directions, the distribution patterns in both directions for those quadrants should be consistent (they should completely overlap each other). As shown in Figure 13, paifang B is a relatively thin paifang as the Y-coordinate spans only a narrow range (approximately 2 m). Similar to the case of paifang A, paifang B is more symmetric along the X-direction compared to the Y-direction, but the degree of asymmetry for paifang B is lower than that of paifang A. However, the degree of asymmetry of paifang C in the X-direction is the highest compared to that of the other two paifangs as shown in Figure 14. This is due to the missing stone base on one side (Figure 11b and Figure 15). Nevertheless, the degree of asymmetry of paifang C in the Y-direction is high as well (Figure 14b). This is likely attributed to the fact that paifang C was transplanted from another place and the structure was altered (if it was assumed that paifang was originally built with a high degree of symmetry).
The RMSEx and RMSEy for paifangs A, B and C are tabulated in Table 3. It can be seen that the RMSEy of paifang C is the highest, indicating it is the most asymmetric among all three paifangs. This is again due to the missing stone base on one side, as shown in Figure 15. Comparing the three sets of RMSE for paifangs A, B and C, it can be seen that paifang B is the most symmetric since it possesses the lowest RMSE. It is consistent with their ages. Paifang B was built only around 90 years ago but paifangs A and C are much older (400–500 years). Considering the RMSE (excluding the RMSEy for paifang C) is relatively low (less than 3 m), it is concluded that paifangs A, B and C are very symmetric. This is consistent with the assumption that Chinese paifangs are usually built with a highly symmetrical standard.
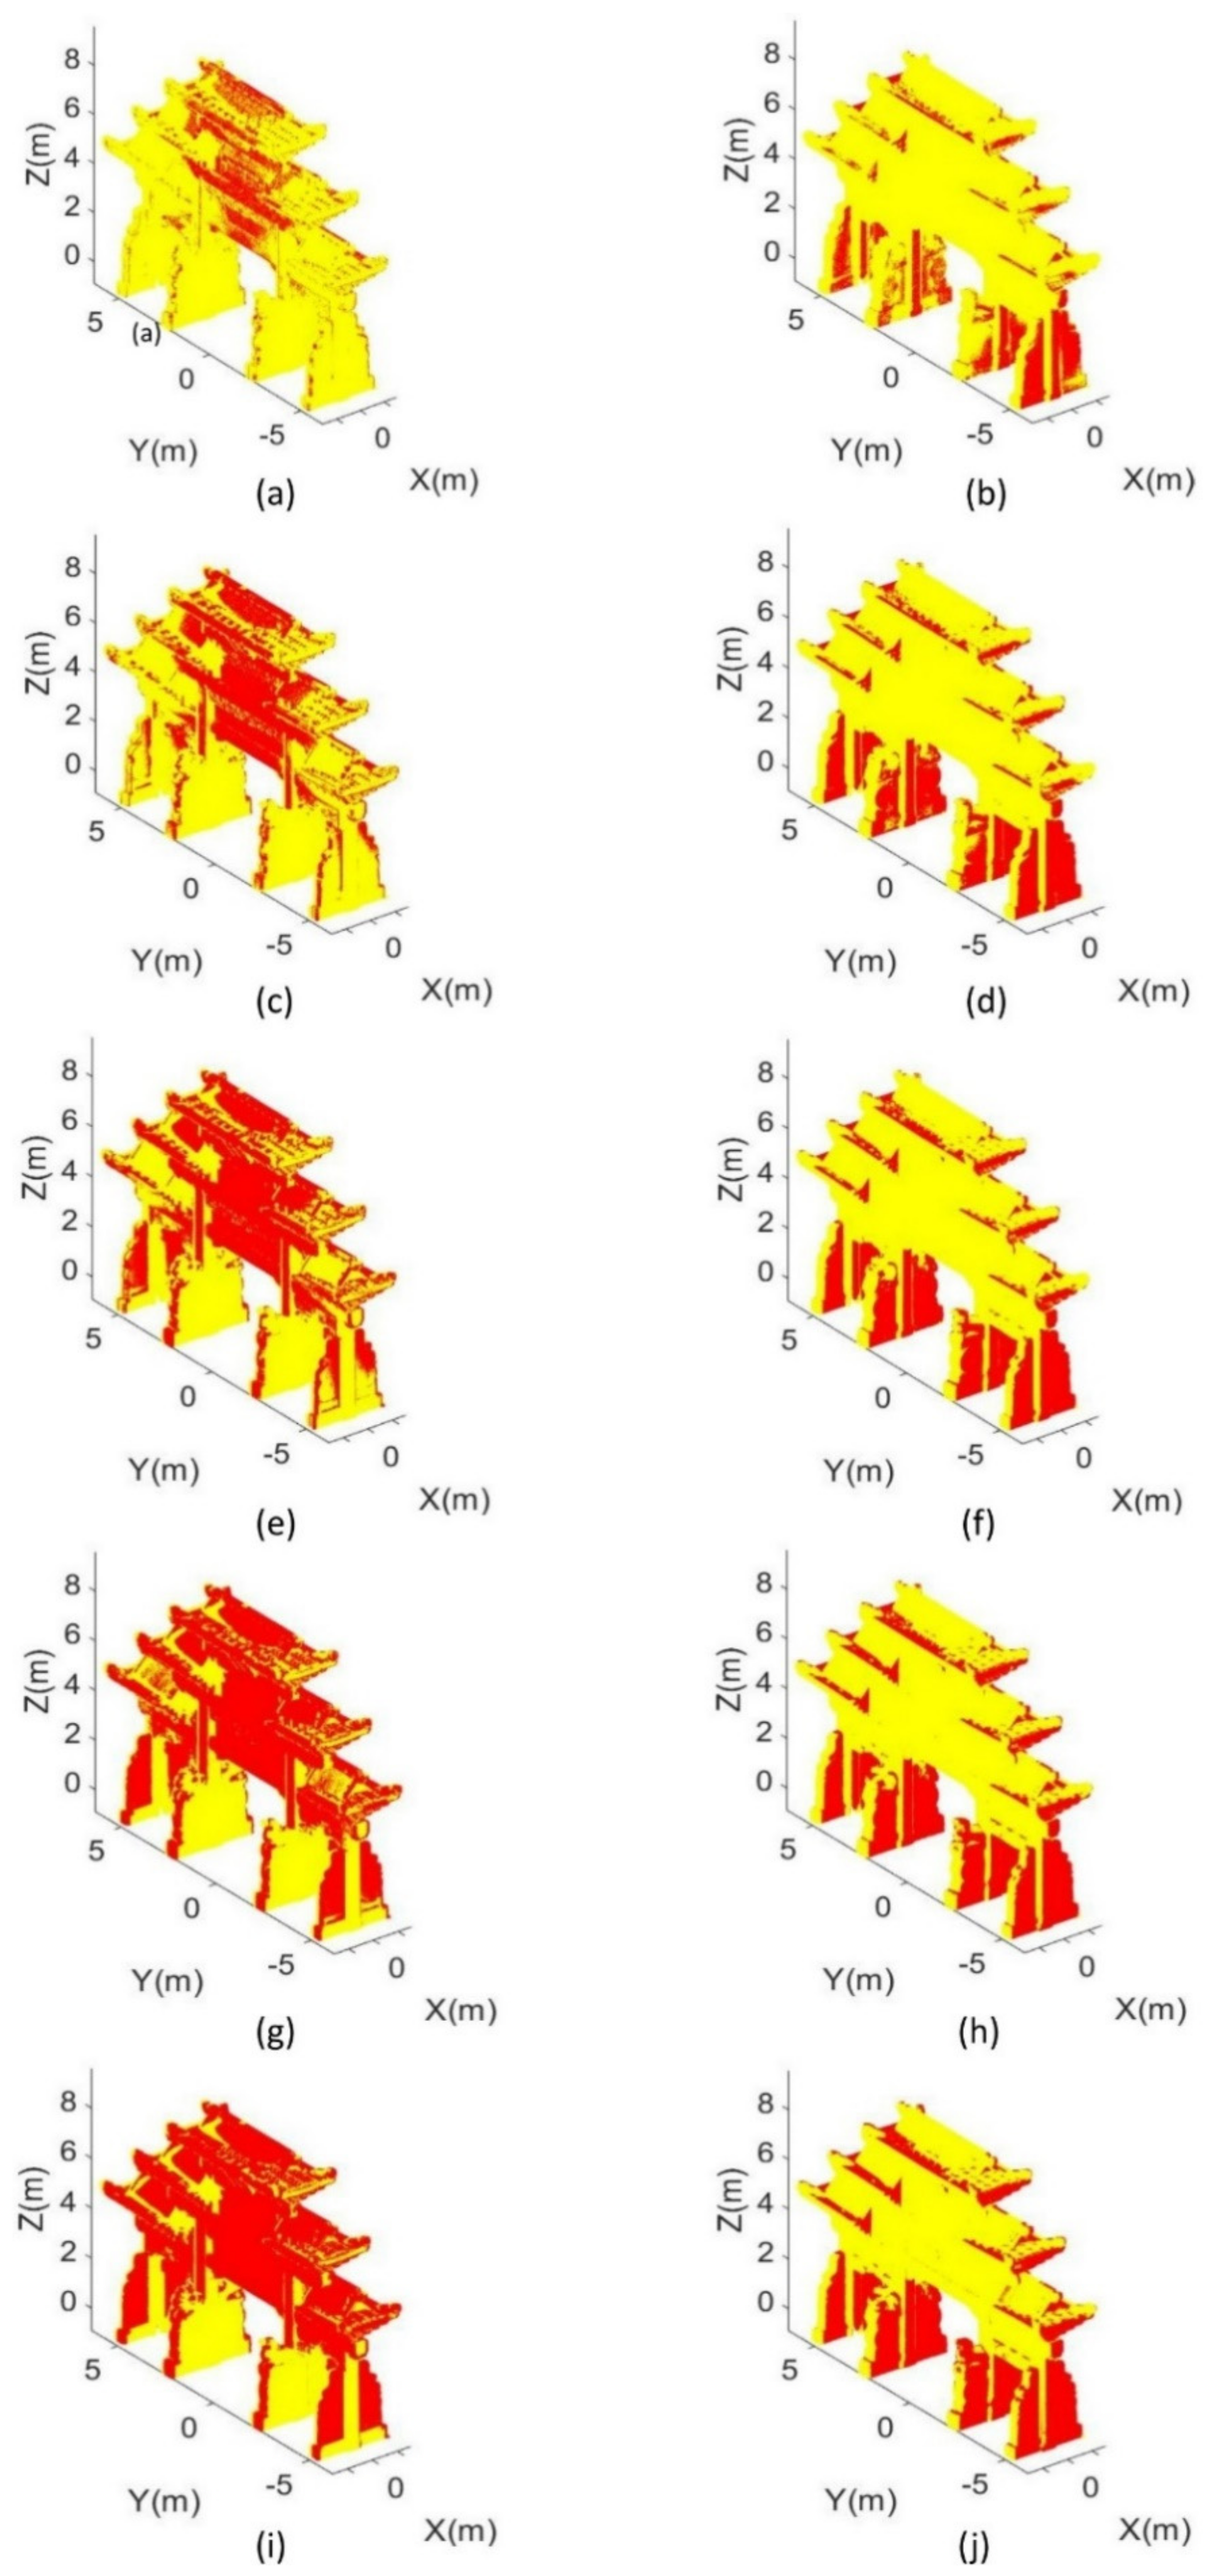
To locate which part of the paifang is relatively symmetric, the conjugate points separated by the planes of symmetry were found by using the k-nearest neighbors algorithm [28]. All the points in quadrants 1-2/2-3 were first translated to quadrants 3-4/1-4, and then a nearest neighbor search was performed to find out the conjugate points within a sphere defined by a radius. The symmetric conjugate points are shown in Figure 16, Figure 17 and Figure 18.
It can be seen that the middle parts of paifangs A, B and C are the most symmetrical as the points with conjugate points found within a 1 cm radius sphere focused on the middle, as seen in Figure 16a, Figure 17a and Figure 18a, respectively. It is because points further away from the central line are usually prone to external forces and more serious bending/deformations occur. From the left column of Figure 16, Figure 17 and Figure 18, it can be seen that the lower portions of the paifangs are usually more symmetrical. This is because the lower portion is less exposed to the wind and other environmental factors that can cause chronic deformations. In addition, it can be seen that paifang A is the most asymmetrical in the Y-direction, mostly in the eaves. It is a giant paifang that was built around 500 years ago, with a relatively more complicated structure compared to the other two paifangs. The eaves had likely been deformed over time along the Y-axis, and therefore it caused such an asymmetry.
5. Conclusions
In this paper, a new method for the detection and analysis of the reflection symmetry of 3D point clouds of Chinese paifangs was proposed. The proposed method is composed of a new model for simultaneously fitting two vertical planes of symmetry to the point clouds of the paifangs, via breaking down the plane-fitting problem into a line-fitting problem. After the parameters of the planes of symmetry were estimated, the point cloud of the paifang could be transformed and then divided into four equivalent quadrants, resulting in evaluation for the degree of symmetry based on the ICP algorithm. Several simulated datasets were used to verify the proposed method. It was found that the proposed method was able to quantify the degree of symmetry regardless of the presence of some random noises added to the measurements, indicating that the proposed method is practical. Meanwhile, real datasets for three old Chinese paifangs (with ages ranging from 90 to 500 years old) were collected using a Trimble scanner to input into the method for the symmetry analysis. The results showed that the degrees of symmetry could be quantified in term of the RMSEs obtained from the ICP, which ranged from 20 to 61 mm. The results revealed that the paifang with apparent asymmetry had the largest RMSE (61 mm) among all three Chinese paifangs. It was shown that the method not only could quantify the reflection symmetry of the paifang, but also could locate which portion of the paifang was relatively more symmetric. Therefore, the proposed method has a high potential for structural health inspection and cultural studies of Chinese paifangs and other similar types of architecture.
Author Contributions
Conceptualization, T.O.C. and L.L.; methodology, T.O.C.; software, T.O.C. and Y.S.; validation, J.Y., L.L. and J.Z.; formal analysis, T.O.C., J.Y. and L.L.; investigation, Y.S. and J.Y.; resources, T.O.C. and Y.S.; data curation, T.O.C. and Y.S.; writing—original draft preparation, T.O.C., Y.S. and L.L.; writing—review and editing, T.O.C., L.L., Y.S., J.Y. and J.Z.; visualization, J.Y. and J.Z.; supervision, T.O.C., L.L. and J.Z.; project administration, L.L. and J.Z.; funding acquisition, J.Z., J.Y. and L.L. All authors have read and agreed to the published version of the manuscript.
Funding
This research was funded by the National Natural Science Foundation of China (No. 51978675) offered to Juan Zeng, and the National Natural Science Foundation of China (No. 42106180) offered to Jiayong Yu.
Institutional Review Board Statement
Not applicable.
Informed Consent Statement
Not applicable.
Acknowledgments
The authors would like to thank the anonymous reviewers for the comments for the manuscript.
Conflicts of Interest
The authors declare no conflict of interest.
References
- Wang, Y.; Duan, Y. A study on the classification and value of Ming Dynasty paifang in China: A case study of paifang in Jinxi County. J. Asian Archit. Build. Eng. 2016, 15, 147–154. [Google Scholar] [CrossRef] [Green Version]
- Lu, Y. A History of Chinese Science and Technology, 1st ed.; Springer: Berlin/Heidelberg, Germany, 2015; pp. 1–194. [Google Scholar]
- Remondino, F. Heritage Recording and 3D Modeling with Photogrammetry and 3D Scanning. Remote Sens. 2011, 3, 1104–1138. [Google Scholar] [CrossRef] [Green Version]
- Ozimek, A.; Ozimek, P.; Skabek, K.; Łabędź, P. Digital Modelling and Accuracy Verification of a Complex Architectural Object Based on Photogrammetric Reconstruction. Buildings 2021, 11, 206. [Google Scholar] [CrossRef]
- Combes, B.; Hennessy, R.; Waddington, J.; Roberts, N.; Prima, S. Automatic symmetry plane estimation of bilateral objects in point clouds. In Proceedings of the 2008 IEEE Conference on Computer Vision and Pattern Recognition, Anchorage, AK, USA, 23–28 June 2008; pp. 1–8. [Google Scholar]
- Hu, L.; Kneip, L. Globally Optimal Point Set Registration by Joint Symmetry Plane Fitting. J. Math. Imaging Vis. 2021, 63, 689–707. [Google Scholar] [CrossRef]
- Chan, T.O.; Xia, L.; Chen, Y.; Lang, W.; Chen, T.; Sun, Y.; Wang, J.; Li, Q.; Du, R. Symmetry Analysis of Oriental Polygonal Pagodas Using 3D Point Clouds for Cultural Heritage. Sensors 2021, 21, 1228. [Google Scholar] [CrossRef]
- Ecins, A.; Fermller, C.; Aloimonos, Y. Detecting reflectional symmetries in 3D data through symmetrical fitting. In Proceedings of the IEEE International Conference on Computer Vision Workshops, Venice, Italy, 22–29 October 2017; pp. 1779–1783. [Google Scholar]
- Xue, F.; Lu, W.; Webster, C.J.; Chen, K. A derivative-free optimization-based approach for detecting architectural symmetries from 3D point clouds. Isprs. J. Photogramm. Remote Sens. 2019, 148, 32–40. [Google Scholar] [CrossRef]
- Gao, L.; Zhang, L.X.; Meng, H.Y.; Ren, Y.H.; Lai, Y.K.; Kobbelt, L. PRS-Net: Planar Reflective Symmetry Detection Net for 3D Models. TVCG 2020, 27, 3007–3018. [Google Scholar] [CrossRef]
- Ji, P.; Liu, X. A fast and efficient 3D reflection symmetry detector based on neural networks. Multimed. Tools Appl. 2019, 78, 35471–35492. [Google Scholar] [CrossRef]
- Wu, Z.; Jiang, H.; He, S. Symmetry detection of occluded point cloud using deep learning. Procedia Comput. Sci. 2021, 183, 32–39. [Google Scholar] [CrossRef]
- Sadd, M.H. Elasticity: Theory, Applications, and Numerics, 1st ed.; Academic Press: Cambridge, MA, USA, 2009. [Google Scholar]
- Hyun, S.W. Formation of Symmetrical Layout of Bell and Drum Towers in Chinese Buddhist Temples. J. Asian Archit. Build. Eng. 2015, 14, 505–511. [Google Scholar] [CrossRef] [Green Version]
- Nguyen, H.L.; Belton, D.; Helmholz, P. Planar surface detection for sparse and heterogeneous mobile laser scanning point clouds. Isprs. J. Photogramm. Remote Sens. 2019, 151, 141–161. [Google Scholar] [CrossRef]
- Nurunnabi, A.; Belton, D.; West, G. Robust statistical approaches for local planar surface fitting in 3D laser scanning data. Isprs. J. Photogramm. Remote Sens. 2014, 96, 106–122. [Google Scholar] [CrossRef] [Green Version]
- Lichti, D.D.; Chan, T.O.; Belton, D. Linear regression with an observation distribution model. J. Geod. 2021, 95, 1–14. [Google Scholar] [CrossRef]
- Chan, T.O.; Lichti, D.D.; Belton, D.; Nguyen, H.L. Automatic point cloud registration using a single octagonal lamp pole. Photogramm. Eng. Remote Sens. 2016, 82, 257–269. [Google Scholar] [CrossRef]
- Zhang, W.; Qi, J.; Wan, P.; Wang, H.; Xie, D.; Wang, X.; Yan, G. An Easy-to-Use Airborne LiDAR Data Filtering Method Based on Cloth Simulation. Remote Sens. 2016, 8, 501. [Google Scholar] [CrossRef]
- Forsythe, G.E. Computer Methods for Mathematical Computations; Prentice-Hall Series in Automatic Computation; Prentice Hall: Hoboken, NJ, USA, 1977; p. 259. [Google Scholar]
- Xu, Y.; Tong, X.; Stilla, U. Voxel-based representation of 3D point clouds: Methods, applications, and its potential use in the construction industry. Autom. Constr. 2021, 126, 103675. [Google Scholar]
- Smith, S.E.; Salkover, M.; Justice, H.K. Analytic Geometry, 2nd ed.; John Wiley & Sons: Hoboken, NJ, USA, 2012; pp. 230–237. [Google Scholar]
- Skaloud, J.; Lichti, D. Rigorous approach to bore-sight self-calibration in airborne laser scanning. Isprs. J. Photogramm. Remote Sens. 2006, 61, 47–59. [Google Scholar] [CrossRef]
- Chan, T.O.; Lichti, D.D.; Belton, D.; Klingseisen, B.; Helmholz, P. Survey Accuracy Analysis of a Hand-held Mobile LiDAR Device for Cultural Heritage Documentation. J. Bionanosci. 2016, 10, 153–165. [Google Scholar] [CrossRef]
- Chen, M.; Chan, T.O.; Wang, X.; Lin, Y.; Luo, M.; Huang, H.; Sun, Y.; Cui, G.; Huang, Y. A Risk Analysis Framework for Transmission Towers under Potential Pluvial Flood–LiDAR Survey and Geometric Modelling. Int. J. Disaster Risk Reduct. 2020, 50, 101862. [Google Scholar] [CrossRef]
- Förstner, W.; Wrobel, B. Mathematical Concepts in Photogrammetry. In Manual of Photogrammetry, 5th ed.; McGlone, J.C., Mikhail, E.M., Bethel, J., Mullen, R., Eds.; American Society of Photogrammetry and Remote Sensing: Bethesda, MA, USA, 2004; pp. 15–180. [Google Scholar]
- Besl, P.J.; Mckay, H.D. A method for registration of 3-D shapes. IEEE Trans. Pattern Anal. Mach. Intell. 1992, 14, 239–256. [Google Scholar] [CrossRef]
- Friedman, J.H.; Bentely, J.; Finkel, R.A. An Algorithm for Finding Best Matches in Logarithmic Expected Time. ACM Trans. Math. Softw. 1997, 3, 209–226. [Google Scholar] [CrossRef]
Figure 1.
Workflow of the proposed method for the symmetry detection and analysis of a Chinese paifang.
Figure 1.
Workflow of the proposed method for the symmetry detection and analysis of a Chinese paifang.

Figure 2.
Model parameters of the two mutually perpendicular planes of symmetry of a Chinese paifang (3D view).
Figure 2.
Model parameters of the two mutually perpendicular planes of symmetry of a Chinese paifang (3D view).

Figure 3.
Model parameters of the two mutually perpendicular planes of symmetry of a Chinese paifang (bird-eye view).
Figure 3.
Model parameters of the two mutually perpendicular planes of symmetry of a Chinese paifang (bird-eye view).

Figure 4.
Four quadrants defined after the paifang is translated from the nominal position into the initial position using the estimated parameters.
Figure 4.
Four quadrants defined after the paifang is translated from the nominal position into the initial position using the estimated parameters.

Figure 5.
Simulated point clouds of a paifang (yellow): (a) paifang with perfect symmetry in both X and Y directions; (b) paifang with perfect symmetry in Y direction only.
Figure 5.
Simulated point clouds of a paifang (yellow): (a) paifang with perfect symmetry in both X and Y directions; (b) paifang with perfect symmetry in Y direction only.

Figure 6.
Real datasets: (a) paifang A (photo); (b) paifang A (point cloud); (c) paifang B (photo); (d) paifang B (point cloud); (e) paifang C (photo); (f) paifang C (point cloud).
Figure 6.
Real datasets: (a) paifang A (photo); (b) paifang A (point cloud); (c) paifang B (photo); (d) paifang B (point cloud); (e) paifang C (photo); (f) paifang C (point cloud).

Figure 7.
RMSE versus RE for the simulated paifang, S1.

Figure 8.
RMSE versus RE for the simulated paifang, S2.

Figure 9.
Point cloud of paifang A (yellow) and the estimated planes of symmetry (magenta): (a) 3D view; (b) bird-eye view (transformed to the origin).
Figure 9.
Point cloud of paifang A (yellow) and the estimated planes of symmetry (magenta): (a) 3D view; (b) bird-eye view (transformed to the origin).

Figure 10.
Point cloud of paifang B (yellow) and the estimated planes of symmetry (magenta): (a) 3D view; (b) bird-eye view (transformed to the origin).
Figure 10.
Point cloud of paifang B (yellow) and the estimated planes of symmetry (magenta): (a) 3D view; (b) bird-eye view (transformed to the origin).

Figure 11.
Point cloud of paifang C (yellow) and the estimated planes of symmetry (magenta): (a) 3D view; (b) bird-eye view (transformed to the origin).
Figure 11.
Point cloud of paifang C (yellow) and the estimated planes of symmetry (magenta): (a) 3D view; (b) bird-eye view (transformed to the origin).

Figure 12.
Histograms of points distribution for paifang A after the translation: (a) along X-direction; (b) along Y-direction. Blue: points in quadrants 1-2 for X-direction (2-3 for Y-direction); red: points in quadrants 3-4 for X-direction (1-4 for Y-direction); light blue: overlap.
Figure 12.
Histograms of points distribution for paifang A after the translation: (a) along X-direction; (b) along Y-direction. Blue: points in quadrants 1-2 for X-direction (2-3 for Y-direction); red: points in quadrants 3-4 for X-direction (1-4 for Y-direction); light blue: overlap.

Figure 13.
Histograms of points distribution for paifang B after the translation: (a) along X-direction; (b) along Y-direction. Blue: points in quadrants 1-2 for X-direction (2-3 for Y-direction); red: points in quadrants 3-4 for X-direction (1-4 for Y-direction); light blue: overlap.
Figure 13.
Histograms of points distribution for paifang B after the translation: (a) along X-direction; (b) along Y-direction. Blue: points in quadrants 1-2 for X-direction (2-3 for Y-direction); red: points in quadrants 3-4 for X-direction (1-4 for Y-direction); light blue: overlap.

Figure 14.
Histograms of points distribution for paifang C after the translation: (a) along X-direction; (b) along Y-direction. Blue: points in quadrants 1-2 for X-direction (2-3 for Y-direction); red: points in quadrants 3-4 for X-direction (1-4 for Y-direction); light blue: overlap.
Figure 14.
Histograms of points distribution for paifang C after the translation: (a) along X-direction; (b) along Y-direction. Blue: points in quadrants 1-2 for X-direction (2-3 for Y-direction); red: points in quadrants 3-4 for X-direction (1-4 for Y-direction); light blue: overlap.

Figure 15.
Paifang C: red circles are the missing stone base positions.

Figure 16.
Points symmetric (red) and asymmetric (yellow) with respect to the planes of symmetry for paifang A: (a,c,e,g,i) along X-direction with search radius of 1, 2, 3, 4 and 5 cm, respectively; (b,d,f,h,j) along Y-direction with search radius of 1, 2, 3, 4 and 5 cm, respectively.
Figure 16.
Points symmetric (red) and asymmetric (yellow) with respect to the planes of symmetry for paifang A: (a,c,e,g,i) along X-direction with search radius of 1, 2, 3, 4 and 5 cm, respectively; (b,d,f,h,j) along Y-direction with search radius of 1, 2, 3, 4 and 5 cm, respectively.

Figure 17.
Points symmetric (red) and asymmetric (yellow) with respect to the planes of symmetry for paifang B: (a,c,e,g,i) along X-direction with search radius of 1, 2, 3, 4 and 5 cm, respectively; (b,d,f,h,j) along Y-direction with search radius of 1, 2, 3, 4 and 5 cm, respectively.
Figure 17.
Points symmetric (red) and asymmetric (yellow) with respect to the planes of symmetry for paifang B: (a,c,e,g,i) along X-direction with search radius of 1, 2, 3, 4 and 5 cm, respectively; (b,d,f,h,j) along Y-direction with search radius of 1, 2, 3, 4 and 5 cm, respectively.

Figure 18.
Points symmetric (red) and asymmetric (yellow) with respect to the planes of symmetry for paifang C: (a,c,e,g,i) along X-direction with search radius of 1, 2, 3, 4 and 5 cm, respectively; (b,d,f,h,j) along Y-direction with search radius of 1, 2, 3, 4 and 5 cm, respectively.
Figure 18.
Points symmetric (red) and asymmetric (yellow) with respect to the planes of symmetry for paifang C: (a,c,e,g,i) along X-direction with search radius of 1, 2, 3, 4 and 5 cm, respectively; (b,d,f,h,j) along Y-direction with search radius of 1, 2, 3, 4 and 5 cm, respectively.


Table 1.
Details of the simulated datasets.
| Simulated Paifang | Number of Points | Symmetry |
|---|---|---|
| S1 | 417,400 | Perfectly symmetric in both directions |
| S2 | 418,540 | Perfectly symmetric in only one direction |
Table 2.
Details of the real datasets.
| Paifang | Name/Location | Number of Scans | Total Number of Points | Scanned Date |
|---|---|---|---|---|
| A | Jinshi, Haizhu, Guagnzhou | 6 | 5,739,606 | May 2019 |
| B | Zhongda/Tianhe, Guangzhou | 4 | 2,115,214 | May 2021 |
| C | Tianbaojiexiao/Dabu, Meizhou | 4 | 678,314 | November 2020 |
Table 3.
RMSE for symmetry analysis of paifangs A, B and C.
| Paifang | RMSEx (mm) | RMSEy (mm) |
|---|---|---|
| A | 32.2 | 24.6 |
| B | 20.4 | 22.1 |
| C | 25.4 | 61.1 |
Publisher’s Note: MDPI stays neutral with regard to jurisdictional claims in published maps and institutional affiliations. |
© 2021 by the authors. Licensee MDPI, Basel, Switzerland. This article is an open access article distributed under the terms and conditions of the Creative Commons Attribution (CC BY) license (https://creativecommons.org/licenses/by/4.0/).
Share and Cite
MDPI and ACS Style
Chan, T.O.; Sun, Y.; Yu, J.; Zeng, J.; Liu, L. Symmetry Detection and Analysis of Chinese Paifang Using 3D Point Clouds. Symmetry 2021, 13, 2011. https://doi.org/10.3390/sym13112011
AMA Style
Chan TO, Sun Y, Yu J, Zeng J, Liu L. Symmetry Detection and Analysis of Chinese Paifang Using 3D Point Clouds. Symmetry. 2021; 13(11):2011. https://doi.org/10.3390/sym13112011
Chicago/Turabian StyleChan, Ting On, Yeran Sun, Jiayong Yu, Juan Zeng, and Lixin Liu. 2021. "Symmetry Detection and Analysis of Chinese Paifang Using 3D Point Clouds" Symmetry 13, no. 11: 2011. https://doi.org/10.3390/sym13112011
Note that from the first issue of 2016, this journal uses article numbers instead of page numbers. See further details here.