
Impact of a HVDC Link on the Reliability of the Bulk Nigerian Transmission Network
by
 and
and
Omowumi Grace Olasunkanmi
1,
Waliu O. Apena
2,
Andrew R. Barron
1,
Alvin Orbaek White
1 and
and
Grazia Todeschini
1,3,*
1
Energy Safety Research Institute, Swansea University Bay Campus, Swansea SA1 8EN, UK
2
Department of Computer Engineering and Department of Electrical and Electronics Engineering, Federal University of Technology, Akure 340110, Nigeria
3
Department of Engineering, The Strand, King’s College, London WCR2 2LS, UK
*
Author to whom correspondence should be addressed.
Energies 2022, 15(24), 9631; https://doi.org/10.3390/en15249631
Submission received: 31 October 2022
/
Revised: 11 December 2022
/
Accepted: 14 December 2022
/
Published: 19 December 2022
(This article belongs to the Special Issue Power Systems Flexibility, Reliability, and Resilience)
Abstract
:Regular and reliable access to energy is critical to the foundations of a stable and growing economy. The Nigerian transmission network generates more electricity than is consumed but, due to unpredicted outages, customers are often left without electrical power for several hours during the year. This paper aims to assess the present reliability indices of the Nigerian transmission network, and to determine the impact of HVDCs on system reliability. In the first part of this paper, the reliability of the Nigerian transmission system is quantified by building a model in DIgSILENT PowerFactory and carrying out a reliability study based on data provided by the Nigerian transmission-system operator. Both network indices and load-point indices are evaluated, and the weakest points in the network are identified. In the second part of the paper, an HVDC model is built and integrated into the existing network at the locations identified by the reliability study. A comparative study using two different HVDC connections is then carried out, to determine the critical impact of HVDC on system reliability. The reliability results indicate that the weakest points of the transmission system are the radial feeders, and the highest impact could be achieved by spanning an HVDC line between two busbars located at the two extremes of a radial feeder: Azura and Yola.
1. Introduction
There are numerous personal, societal and social advantages associated with a reliable electricity network. Electrical supply in Nigeria is less than the demand, and frequent outages take place. Therefore, due to both lack of generation and deficiencies in maintenance and infrastructure, as a result of long hours of outages, many of the basic comforts provided by the availability of electricity are not reliably available. Nigeria has been producing commercial quantities of electricity for over a century, but the population cannot access a reliable power supply because of the slow speed at which its energy infrastructure is being developed and maintained. For example, over half (c.a. 56%) of Nigerians linked to the national grid experience erratic, inconsistent, and weak power supplies, while the remaining population (c.a. 44%) have no connection to the national power system at all [1]. This status causes a major impediment to business and industrial growth. In summary, there is 12,522 MW of installed generation capacity, but only 3879 MW is currently running, with up to 27.7% of the load being rejected at distribution and 7.4% being lost in transmission, leaving just about 2519 MW of supply [2].
The reliability of the transmission network is crucial to the whole system’s performance [3], and it is the foundation upon which any present-day or future infrastructure stands Without adequate operational performance, it clearly cannot support economic growth or assist in raising the living standards of the Nigerian population. The electric utility’s objective is to provide electricity to satisfy its customers’ needs and expectations to a better level within the resources under operational economic viability [4,5,6]. Regardless of the choice of future electricity generation, the transmission network must function well for overall system security and dependability, and therefore it is imperative to carry out a systems reliability analysis so that efforts are focused on the appropriate areas to deliver a reliable energy infrastructure. This assessment is carried out by means of reliability evaluations that allow, among other objectives, the identification of weak points and the determination of network performance toward the future load requirement. Reliability models can be divided into two categories, namely deterministic (absence of randomness) and stochastic (random) models. Deterministic models are usually expressed in terms of differential equations, together with the initial and boundary conditions which exactly predict the development of a system. Stochastic models are described by random variables whose outcomes are uncertain, and they can only compute the probability distributions of possible outcomes [7]. By making assumptions about the random component of a model, stochastic models allow the validity of the assumptions to be tested statistically [8]. This latter method is thought to be more suitable, due to the higher accuracy of the results compared with deterministic models [9].
Reliability is assessed through various indices, such as the System Average Interruption Frequency Index (SAIFI), the System Average Interruption Duration Index (SAIDI), the Customer Average Interruption Duration Index (CAIDI), and the Average Service Availability Index ASAI. Target values for each index are provided by standards such as IEEE 1366 [10].
A reliability evaluation of a complete power system, including generation, transmission, and distribution is often not conducted, due to the size and complexity of the problem. Rather, the reliability of transmission systems and distribution network segments are conducted independently [3].
Therefore, based on the results of reliability studies, various approaches to improving system reliability can be deployed [11] These approaches include dynamic line rating or a unified power flow controller. High-voltage direct-current (HVDC) systems have been considered as a solution, due to their high degree of reliability. Additionally, they allow improved power-system flexibility and power transfer [12].
Previous qualitative studies assessed the impacts of HVDC lines on the transmission-system reliability using the Nordic32 transmissions test system in the NEPLAN environment. The studies showed that the embedded HVDC line upgraded the system operating conditions, enhanced the static component of voltage stability, and reduced the number of load-point failures [13]. This work developed a framework for investigating the reliability implications of the instantaneous tripping of a DC tie over a frequency response, using a detailed dynamic model. It concluded that the integration of an HVDC transmission link significantly improved the frequency regulation of the power grid to which it is connected, and increased the annual responsive reserve which was valued at around USD 93 million [13]. In another study, a reliability model for an HVDC system with a tapping station was created. The outcomes of the numerical analysis demonstrated that a tapping station can raise significantly the load-point reliability [14].
Herein we present our work to quantify the reliability of the Nigerian transmission network by using a detailed computer model, and then to evaluate the impact of HVDC interconnections on reliability indices. This work is carried out using data provided by the Nigeria Electricity System Operator (NESO), which were used to build a stochastic model using the DIgSILENT PowerFactory (PF), and a statistical analysis method was adopted [10,15]. The PF was chosen to carry out this research, due to its advanced tools for reliability assessment, and for power-system analysis. The work presented in this paper is part of a larger project aimed at addressing the impact of HVDC connections on various power-system performance metrics, including voltage profiles and stability, and therefore PF allows for the carrying out of various power-system studies while using the same underlying network model. This paper is organized as follows: Section 2 presents an overview of the reliability indices, in order to provide a common terminology, and presents values of these indices for different countries, based on the literature review. Section 3 describes the network model and the HVDC model, and shows the calculations performed to determine the number of customers connected to each busbar. Section 4 shows the results for both network indices and load indices for the existing system configuration and identifies the points in the network with low reliability, and suitability for HVDC connection. Section 5 describes the HVDC interconnections used in the study, and quantifies the impact of HVDCs on system reliability. Section 6 draws the concluding remarks.
2. Methodology
2.1. Reliability Indices
Numerous reliability indices exist, and they can be divided into load-point indices and system indices [16]. Load-point indices (LPIs) measure the expected number of outages and their duration for individual customers, while system indices measure the reliability of the system as a whole, and can be used to compare the effects of different design and maintenance strategies on the system’s reliability [17,18].
Reliability indices typically require input data, such as number of customers, magnitude of the connected load, duration of the interruptions (referred sometimes as faults), amount of power (kVA) interrupted, and frequency of interruptions [19]. The reliability indices used in this paper will be defined in the following sections.
2.1.1. Load-Point Indices
The LPIs considered in this research are the Load-Point Interruption Frequency (LPIF) and the Load-Point Interruption Time (LPIT). These load-point indices are used to identify weak points in a system, and are defined as shown below [17,20]:
where is the frequency of occurrence of contingency k and is the probability of occurrence of contingency k.
2.1.2. System Indices
System indices provide a measure of global adequacy that can be used to compare the performance of different power systems, and are used to track the performance of a region or a circuit [20,21]. In this research, SAIFI, SAIDI, CAIDI and ASAI are used to measure the performance of the network. The definition of these indices is briefly provided below, in order to define a common terminology:
- SAIFI: System Average Interruption Frequency Index (interruptions per year). This index measures the number of interruptions customers experience each year [22], and it is expressed mathematically as shown below:where is the Average Customer Interruption Frequency, and is the number of customers supplied by load point (customers on a particular bus bar).
- SAIDI: this stands for System Average Interruption Duration Index (hours or minutes per year). This index captures the duration of power outages each year [10] and it is measured in units of time, i.e., hours or minutes [22]. SAIDI represents the average time each customer was without electricity each year and is defined below:where is the Average Customer Interruption Time?
- CAIDI: Customer Average Interruption Duration Index (hours). This index expresses the average time required to restore service, and the expression is given below [23]. It is worth noticing that CAIDI can be calculated as the ratio of SAIDI over SAIFI.
2.2. Reliability Performance in Various Countries
The reliability indices for some countries are discussed briefly in this section, based on results retrieved from the literature review. These results provide examples and illustrate the different performance of power systems in various regions of the world.
The IEEE Standard 1366 provides reference values for the network reliability indices, and these values are shown in Table 1. However, it is worth noticing that this standard may not be applied in all countries listed in the table.
To describe the reliability of the power system supply in Algeria, SAIFI and SAIDI were calculated for the 400 kV transmission line. The values are 1.4 h/year and 45 interruption/year, respectively [23].
In India, a reliability simulation was carried out using the Electrical Transient Analyzer Program (ETAP) software. The SAIFI and SAIDI for the line with the highest total duration of interruption (1113.016 h) were calculated to be 10 interruption/month and 185.50 h/month, respectively. For the line with the lowest total duration of interruption (0.583 h), SAIFI and SAIDI were equal to 0.167 (interruption/month) and 0.097 h/month, respectively. These indices were used to create a reliability assessment framework to be used during transmission planning to ensure system security, robustness, and reliability [24].
The Nairobi power-system reliability was also calculated using SAIFI, SAIDI, and CAIDI, and the average results were given as 4.5 h/year, 11.5 interruption/year, and 2.6 h, respectively [25].
The results from various countries are summarized in Table 1. Reliability indices for the USA, UK and Australia are also included [26]. It is worth observing that the reliability for Egypt is close to the one for Western countries, while for other regions on the African continent, reliability is generally much lower.
3. Network Model and HVDC Model
The first step in carrying out the reliability assessment was to build a model of the Nigerian transmission network, including both electrical parameter and reliability data provided by the Nigeria Electricity System Operator (NESO). Where data were lacking, assumptions were made regarding the calculation of the number of customers connected to each busbar.
Additionally, a generic HVDC model was built separately—this model was then connected to the network at the locations with lower reliability, as explained in a later section.
Outage data provided by NESO consisted of the time of occurrence of a fault, fault duration in hours, and restoration time. The total connected load at each bus bar was also provided in MW, but the number of connected customers was not given. Because this quantity is required for reliability assessment, the number of customers connected at each bus bar was calculated as shown in Section 2.2.
3.1. Network Model
The Nigerian power system is composed of four sub-systems: generation, transmission, sub-transmission and distribution.
The generation system (comprising the power stations) is managed by the Generating Companies (GENCOs), with a total installed capacity of 14,034 MW. The generators in the network consist of three hydro stations (14.69% of installed generation, 2062 MW) and seventeen gas stations (85.31% of installed generation, 11,972 MW), which are connected to the transmission system via step-up transformers [27].
The transmission system includes high-voltage lines and switching stations, and it is managed by the Transmission Company of Nigeria (TCN). The transmission voltage level is 330 kV, while sub-transmission is rated at 132 kV. The bulk of the power transmitted through the main grid is fed through 330/132/33 kV transformers. Lastly, the distribution is managed by the Distribution Companies (DISCOs), with medium-voltage and lower-voltage levels equal to 33 kV and 11 kV, respectively [27].
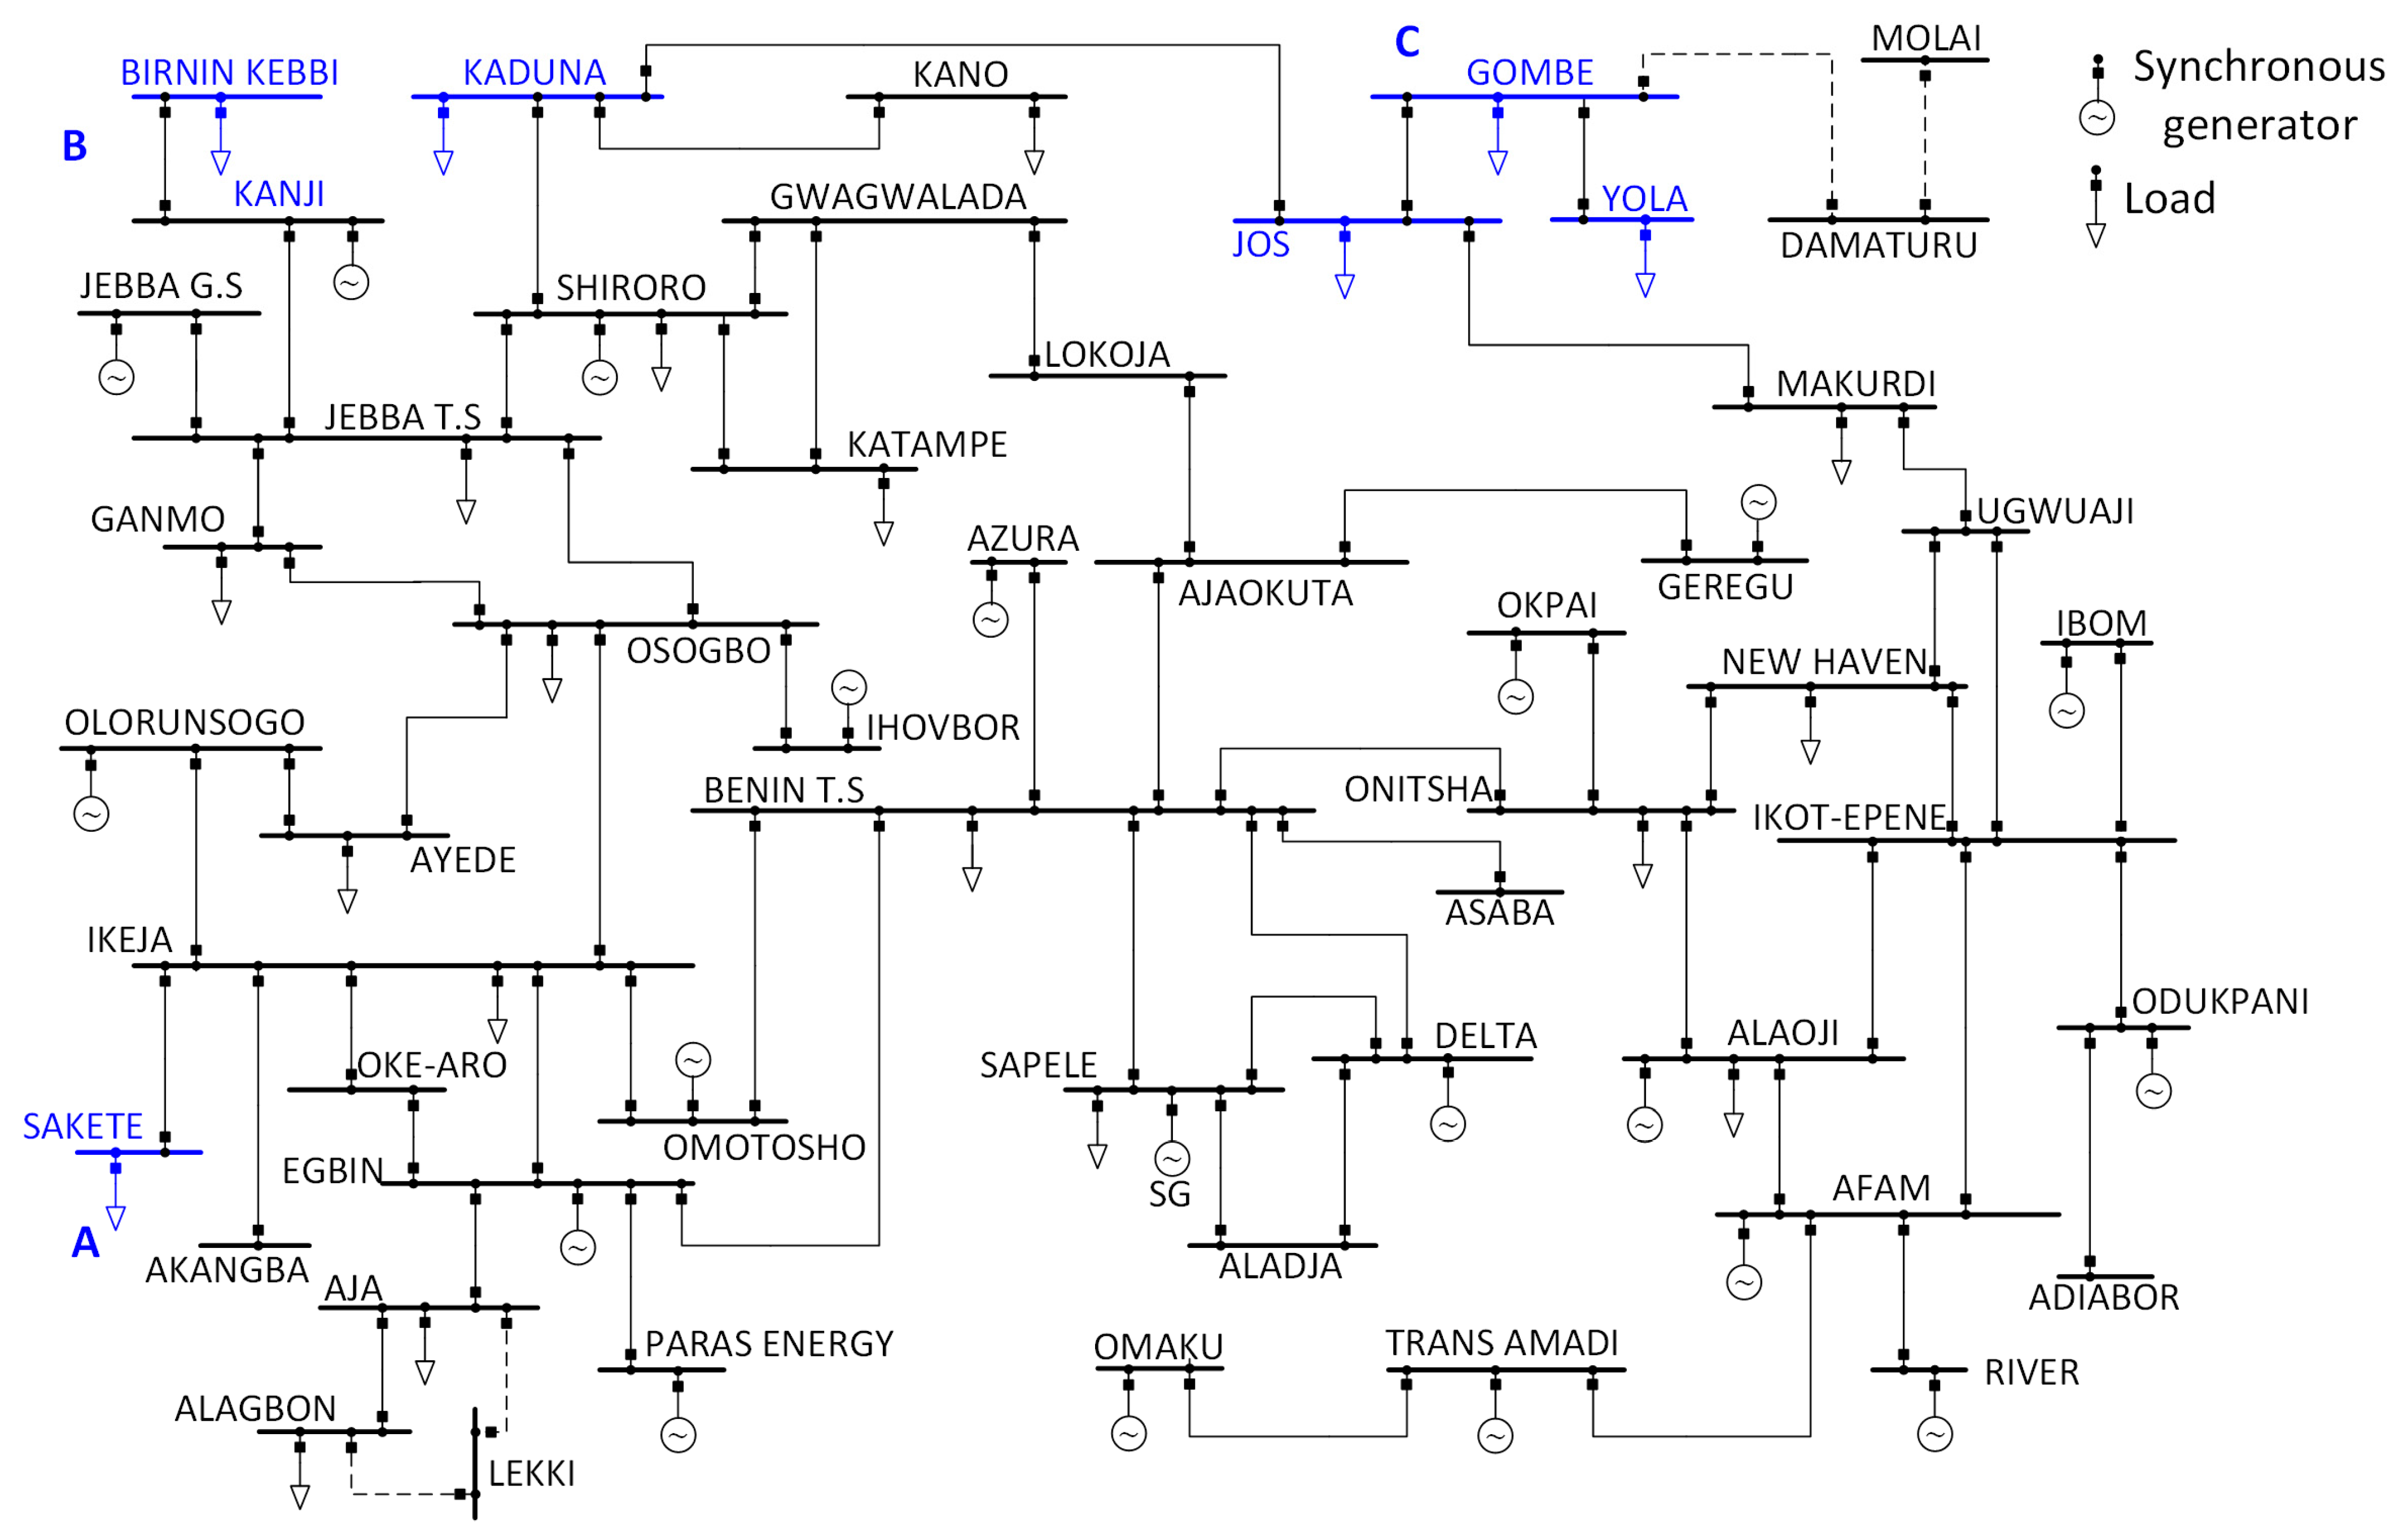
Figure 1 shows the single-line diagram of the Nigerian 330 kV-transmission-system model used in this study: it consists of 64 transmission lines (including 21 double lines), with a total length of 6575.30 km, 52 busbars, 20 generators (2 out of service at the time of this study) and 23 loads. In the figure, the dotted lines indicate the portion of the system that is out of service. The blue busbars indicate the radial feeders (named A, B and C), which will be the point of attention of the reliability analysis.
3.2. Repair-Duration (RD) and Failure-Frequency (FF) Computation
The data provided by the NESO for the reliability study include the time of occurrence of faults (including planned and unplanned outages), the restoration time, the number of outages (NO), and the fault duration (FD). This data was provided for each month in the year 2019 (January to December), and for each line.
However, the FD and the NO could not be applied directly in the study, but were rather used to determine the mean time to repair (MTTR), also known as repair duration (RD), and the failure frequency (FF), as required by PF to run the reliability analysis.
To evaluate the MTTR and RD for each line, it was necessary to calculate two intermediate quantities: the total fault duration, TFD (i.e., the cumulative fault-duration across the entire year), and the total number of outages, TNO (i.e., the cumulative number of outages across the entire year). Once TFD and TNO were known, the MTTR and the FF for each line were obtained in accordance with the equations below [14,16]:
3.3. Number of Customers Computation
The calculation of SAIFI and CAIDI requires knowing the number of customers connected to a busbar. Since this parameter was not provided by the NESO, some assumptions were made based on the literature review and practical considerations.
According to [28], the number of residential customers connected to an 11/0.415 kV 500 kVA distribution transformer in Nigeria is 268. Under normal operating conditions, the transformer does not always operate at full load conditions, and for this study an 80% loading is assumed.
Based on the above, the following transformer rating is assigned to each customer:
The number of connected customers () on a load bus-bar is then calculated, using the following equation:
Since the NESO only provided the active power demand for each load, the apparent power of each load required in (11) was calculated by assuming a power factor of between 0.7 and 1.
For example, the active power demand at Aja (summer scenario) is 162.70 MW, and a power factor of 0.8 was assumed, thus resulting in an apparent power of 202.76 MVA. The number of connected customers at Aja was calculated using (11), as shown below:
The same approach was applied at all busbars for both scenarios (summer and winter), with the number of connected customers shown in Table 3.
3.4. HVDC Model
An HVDC model was built in PF, based on typical values found in the literature. This model will be integrated into the second part of the study, depending on the locations informed by the reliability study. The baseline model will be maintained, while other parameters such as the power set-point and the line length will need to be adapted for the location(s) under study.
An overview of the model is shown in Figure 2. A bipolar configuration was adopted, because it is the most common one [29,30]. The bipolar configuration consists of two independent DC circuits, where each circuit can draw half of the rated power. The ground return electrode carries very little current in the bipolar configuration (compared with the monopolar one), and it is not shown in Figure 2, for simplicity.
One advantage of the bipolar configuration, in the context of reliability, is that it can deliver part of the rated power in the event of maintenance or outage of one of the two lines, as the other half of the system continues to supply power.
A voltage-source-converter (VSC) configuration was adopted, as this has become the standard for new HVDCs. Converter 1 is controlled in Vdc-Q mode, while converter 2 is in PV mode [31]. This fixed control-mode is sufficient for the purpose of this study, because in the system under consideration the power flow is unidirectional, and therefore active power always flows from Converter 1 to Converter 2, as shown in Figure 2. Therefore, when this model is deployed, Converter 1 is connected to the sending end (with voltage Vs), while Converter 2 is connected to the receiving end (with voltage Vr), where the loads are connected [32,33].
In terms of reliability, PF does not provide a way to input reliability values for some of the individual components, such as the converters. Therefore, an overall HVDC reliability was modelled in the AC line connecting the sending end to the converter transformer. Since this component is modelled in series with the rest of the system, failure of the AC line will result in overall HVDC failure, thus allowing the correct representation of the intended behaviour. For future and more detailed reliability studies, this approach may need to be revised.
4. Results
This section presents the reliability study results, starting with the reliability indices for the overall network, and then describing load-point indices at various locations. The impact of HVDC will be analysed in the next section.
4.1. System Indices
SAIDI, SAIFI, CAIDI, and ASAI were used as tools to evaluate the reliability of the transmission network. These parameters were calculated according to (3)–(6), with results summarized in Table 6.
During the winter, SAIDI is equal to 0.872 hr/yr, thus indicating a better performance than in the summer. This result can be explained by observing that, during the winter (the dry season), faults are cleared faster than in the summer (the rainy season), when the weather is stormy and windy; therefore, in this case, the reliability is a factor of operational-maintenance capabilities. The summer has a higher value of SAIFI (0.8105 vs. 0.4037 in the winter), which means that the frequency of interruptions is higher. This again can be explained by observing that heavy storms may cause trees to fall and land on transmission lines, causing leakages to the earth. This event is not unlikely, as transmission lines run for several kilometres, and a large portion of them are in forested areas [36].. When this occurs, transmission lines may trip and cause a short circuit. This situation is aggravated by observing that isolators and fuses fail more often during the summer than during the winter, thus increasing overall system failure.
A CAIDI value of 2.16 implies that there was no supply of electricity for 2.16 h every day for the whole year, or that, on average, it takes 2.16 h to restore the power supply whenever there is an interruption or system failure. This value can be explained by observing that SAIDI and SAIFI are used as numerator and denominator for CAIDI calculations: as the number of customers experiencing prolonged outages decreases, the denominator (SAIDI) of the CAIDI index decreases, relative to the value of the numerator (SAIFI), and the overall index rises [37]. The value of ASAI was 99.98% for both scenarios. Although this number appears high, it is still below the standard value of 99.9999% [22].
4.2. Manual Calculation
In this section, system reliability indices were calculated manually and compared with the PF results. This process was carried out to confirm the validity of the simulation results, and, more importantly, to demonstrate that, for radial feeders, reliability can be calculated easily by applying the formulae presented in Section 2.1. The summer scenario was used for this validation.
To manually calculate the system indices, the following data is required: TNO, TFD and . The values used in this section are summarized in Table 7.
In order to simplify the calculation, it was assumed that three radial feeders posses a low reliability, while the rest of the system was assumed as highly reliable, due to the meshed topology shown in Figure 1. The three radial feeders analysed in this section are labelled as A, B and C in Figure 1. Reliability indices of each radial feeder were calculated, to compare them with the results obtained from PF.
- Calculation of SAIFI
The SAIFI calculation for each radial feeder was carried out as shown below, where the symbol ‘’ indicates a line. It is worth noticing that for the radial feeder C, the calculation requires a consideration of the total line-length of the load from Yola to Jos, and this is why there is an additional term, compared with the other two feeders:
SAIFI is then calculated by adding the terms calculated above and dividing by the total number of customers (Tc) from Table 3:
- Calculation of SAIDI
Similarly, to the approach described in the previous section, three intermediate quantities are calculated, based on the and the FD:
SAIDI is determined by adding all the terms above:
- Calculation of CAIDI and ASAI
Applying (5) and (6) respectively, CAIDI and ASAI were determined:
It is worth noticing that the reliability indices are calculated by PF based on RD, FF and the , while in the manual calculation, FD, NO and were used.
A summary of the results and the difference between the PF results and manual calculation is presented in Table 8. One can observe how the calculated values match closely to the simulation, and confirm our hypothesis that the radial feeders mostly contribute to the poor reliability performance of this network.
4.3. Load-Point Indices for the Radial Feeders
After calculating the network reliability indices, LPIs were obtained through PF, to identify the weakest load busbars. These loads are located at the end of the radial feeders studied in the previous section. The LPIs at Gombe, Yola, Birnin Kebbi, and Sakete bus bars were higher than at other busbars, as shown in Table 9. The LPIF (1/yr) at Gombe are very close to 2—this threshold indicates that a load is subject to frequent interruptions.
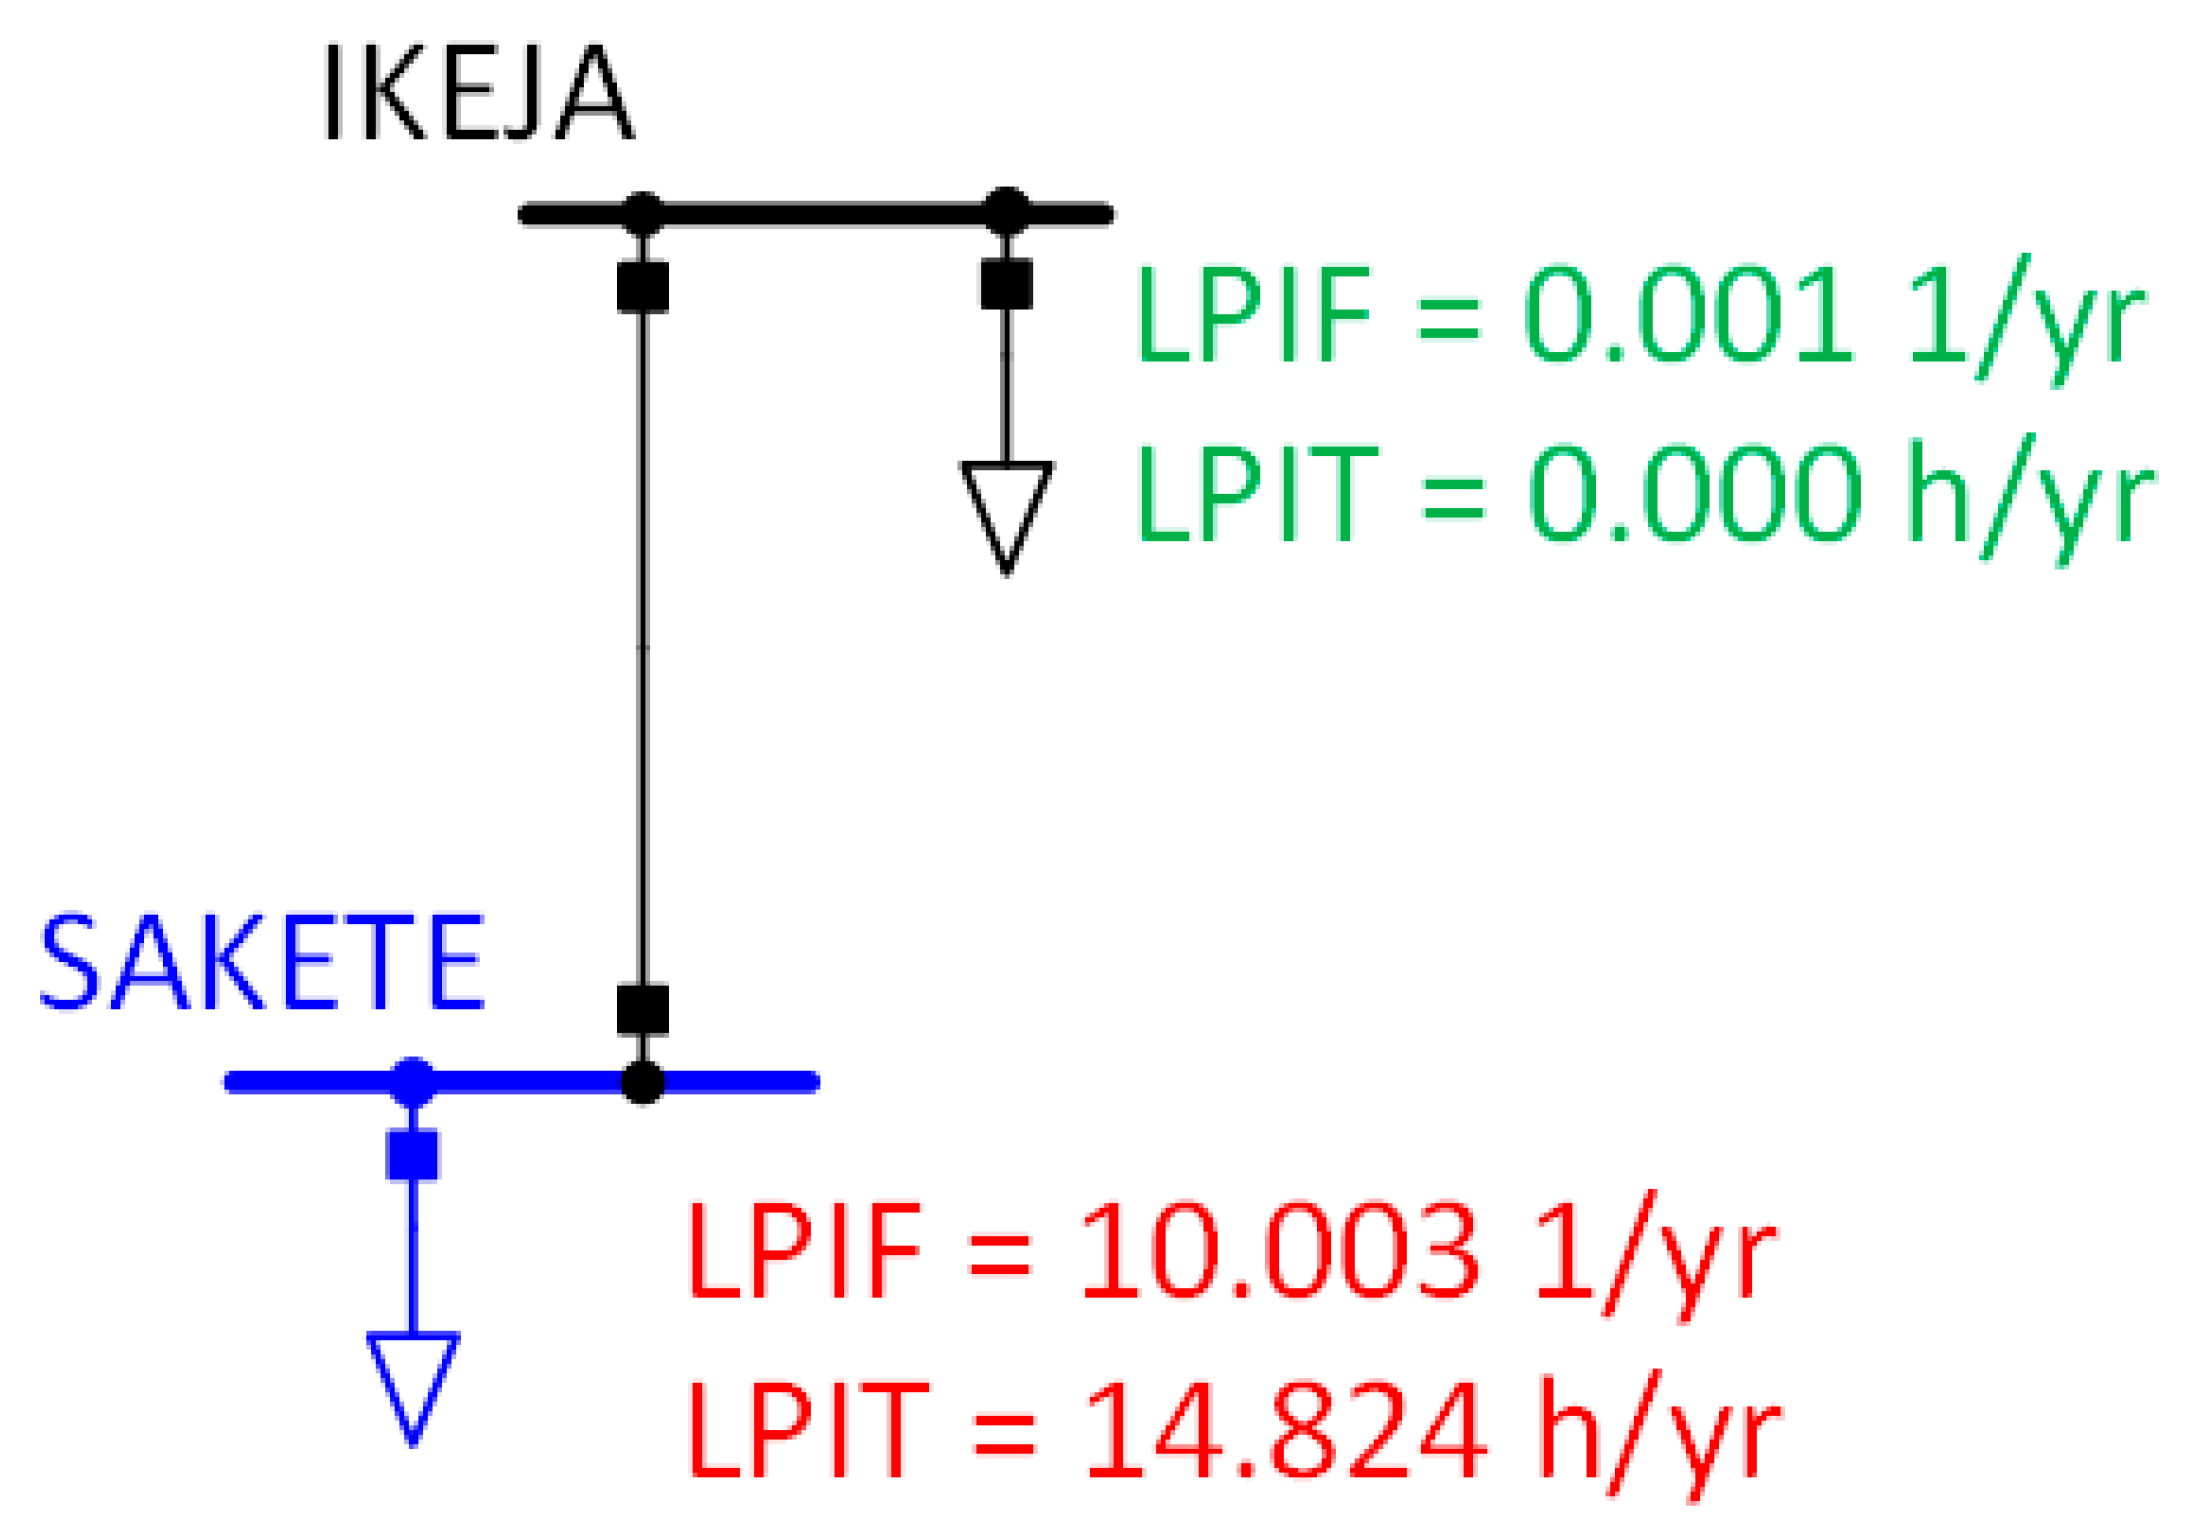
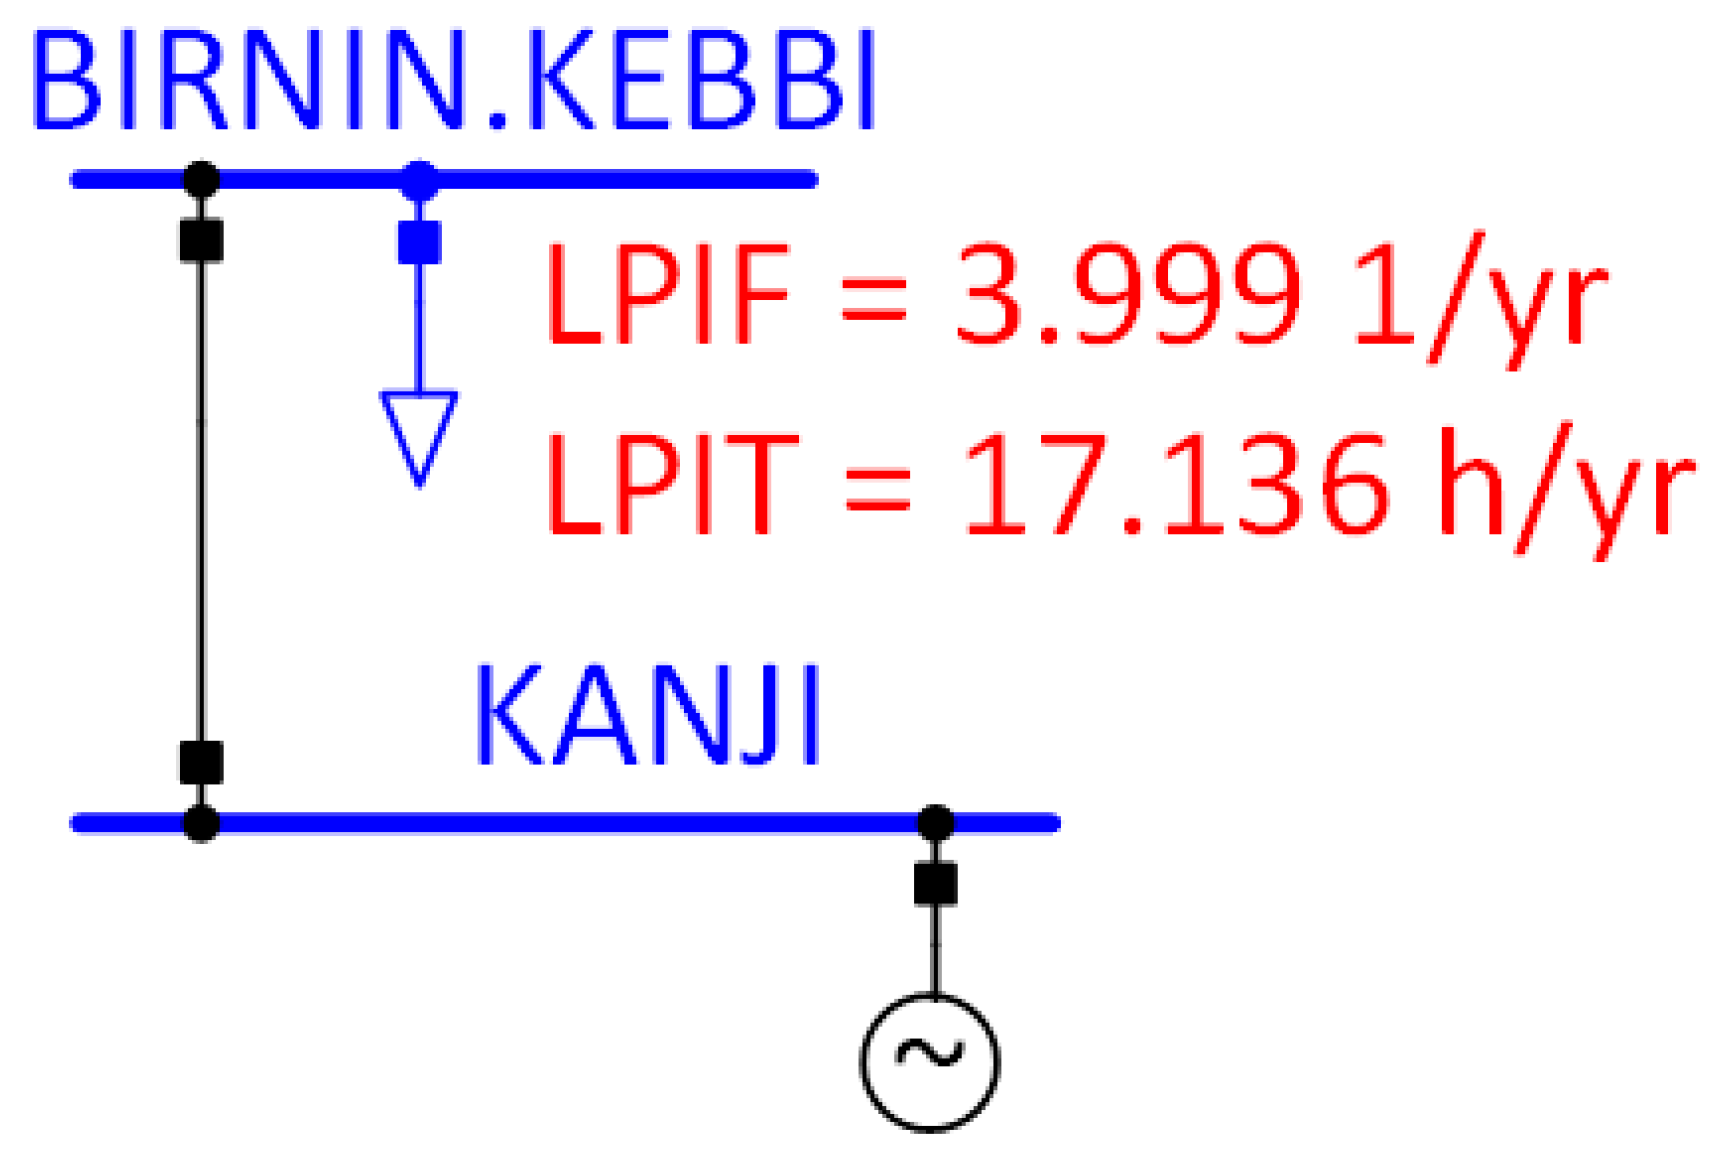
Figure 3, Figure 4 and Figure 5 show more in details the LPIs for the feeders under consideration: the loads indicated in red are the ones where LPIs are greater than two. It is worth observing that nearby loads may sometimes have very different performance. For example, LPIs at Ikeja are close to zero, while at Sakete they are higher than ten (Figure 3). This is because Ikeja is interconnected to the rest of the system by several lines (as shown in Figure 1), while the load at Sakete is connected by a single line prone to outages. Similar considerations apply to the radial-feeder loads shown in Figure 4 and Figure 5.
4.4. Comparison with other countries
The comparison of the reliability results in Table 1 with the Nigerian power-transmission reliability of Table 10. shows that:
- -
- In terms of SAIDI, the Nigerian transmission-system experience more power outages compared with India, Egypt, and Australia. On the contrary, the Nigerian transmission-system performance appeared more reliable than that of Algeria.
- -
- The high SAIFI value indicates that there are more faults compared with Algeria, India, Egypt, and Australia. This further produces an overall negative impact on CAIDI, decreasing both reliability and customer supply.
5. Impact of HVDC on Reliability Indices
The reliability analysis indicated that the weakest points of the transmission system are the radial feeders. However, it was determined that the impact of an HVDC interconnection on radial feeder C should be studied, as it is the longest one and it has two load busbars. The other two radial feeders are too short for an HVDC connection, and therefore were not studied further.
In this section, the impact of HVDC on reliability is presented for two cases: Case 1 is the Azura–Gombe HVDC connection and Case 2 is the Azura–Yola HVDC connection. In both cases, Azura was the sending-end busbar, and it was selected because of the presence of a large generator and the distance from the loads. The HVDC length was 1020 km and 1025 km, for Case 1 and Case 2, respectively. The HVDC parameters shown in Table 2 were adopted in both cases: it is worth noticing that a rated power of 500 MVA was used even if the loads were smaller at these busbars (as shown in Table 1), given future system-expansion.
Table 10 presents the values of the system indices for Case 1 and Case 2, together with the results for the original network, referred to as Case 0.
For Case 2, there was an improvement of 1.371 h/year on the average time when customers were without electricity during the year (SAIDI), compared to 1.418 for Case 1, and for the case when there was no HVDC link on the network (1.441).
Additionally, both the frequency of interruption (SAIFI) and the service available to the customers during the year (ASAI) are improved for Case 2.
Only the average time for repair (CAIDI) was improved for Case 1, with 1.980 h compare with Case 2, with 2.204 h, although the best performance was obtained for Case 0, with 1.779 h.
In conclusion, the simulation results show that for Case 2, the system has a better SAIDI, SAIFI, and ASAI.
For both cases, the LPIs were calculated as well, and compared with the base case, with results summarized in Table 11 and Table 12. One can notice that the LPIs improve at the busbars in close proximity to where the HVDC is connected. In particular, Case 2 is effective in zeroing the LPI for both the Gombe and Yola loads, thus confirming its superior performance to Case 1. It is also worth noticing that loads connected at other busbars are not affected by the HVDC. This is expected from the analysis carried out in Section 4, as it has been demonstrated that the LPIs at the end of each radial feeder are mostly determined by the reliability of the line they are connected to.
The results above indicate the positive influence that HVDC has on both network-reliability indices and on load indices.
6. Conclusions
Using DIgSILENT PF, we conducted a reliability analysis for the Nigerian transmission system, based on data provided by the Nigeria Electricity System Operator (NESO), for both summer and winter 2019. Given that the network configuration has not changed substantially since then, the results of this work can still be considered as up to date. An HVDC model was developed using data retrieved from the literature, as currently no HVDCs are used in Nigeria.
The data provided by the NESO were used to build a summer and a winter scenario in DIgSILENT PF. Reliability studies were carried out, and both network indices and load indices were obtained. Manual calculations were carried out to demonstrate that the reliability of the radial feeders is not affected by the rest of the system, which is highly meshed. This finding allows the simplification of the analysis for systems with a similar configuration, in particular when not all system data are available.
Based on the results of the reliability data, two locations were identified to test the impact of the HVDC connection on system reliability. The reliability-study results indicated in both cases an improvement in the overall system reliability. In both cases the reliability-study results realized an improvement in the overall system reliability. In particular, adding an HVDC line between Azura and Yola (referred to as a Case 2) provided the best results, both in terms of system indices and in terms of load indices. The next step of this study is to repeat a similar assessment for system stability, and to assess the impact of HVDC interconnections on stability indices. An overall optimization of the HVDC location will be also carried out.
Author Contributions
Conceptualization, O.G.O. and G.T.; methodology, O.G.O. and G.T.; formal analysis, O.G.O. and W.O.A.; investigation, G.T. and A.R.B.; resources, A.O.W. and A.R.B..; data curation, A.R.B. and W.O.A.; writing—original draft preparation, O.G.O. and W.O.A.; writing—review and editing, G.T., A.R.B., A.O.W. and W.O.A.; supervision, G.T. and A.O.W.; funding acquisition, G.T. All authors have read and agreed to the published version of the manuscript.
Funding
This research was supported by the Tertiary Education Trust Fund (TETFUND) under the Academic Staff Training & Development (AST&D) program of the Federal Republic of Nigeria and by the UK Engineering and Physical Sciences Research Council (EPSRC) grant EP/T013206/2. TETFUND’s support to produce this publication does not constitute an endorsement of the contents, which reflect the views only of the authors, and the Commission cannot be held responsible for any use which may be made of the information contained therein.
Data Availability Statement
Due to the confidential nature of some of the research materials supporting this publication not all of the data can be made accessible to other researchers.
Acknowledgments
The authors acknowledge the National Control Centre, Osogbo, Nigeria for making the data available for this research work and Olabisi Onabanjo University for supporting the research work. For the purpose of open access, the author has applied a Creative Commons Attribution (CCBY) license to any Author-Accepted-Manuscript version arising.
Conflicts of Interest
The authors declare no conflict of interest.
Glossary
| ASAI | Average Service Availability Index |
| CAIDI | Customer Average Interruption Duration Index |
| FD | Fault Duration |
| HVDC | High Voltage Direct Current |
| IEEE | Institute of Electrical and Electronics Engineers |
| LPI | Load Point Index |
| LPIF | Load Point Interruption Frequency |
| LPIT | Load Point Interruption Time |
| NESO | Nigeria Electricity System Operator |
| NGET | National Grid Electricity Transmission |
| NO | Number of Outages |
| Number of Connected Customers | |
| SAIFI | System Average Interruption Frequency Index |
| SAIDI | System Average Interruption Duration Index |
| TFD | Total Fault Duration |
| TNO | Total Number of Outages |
| VSC | Voltage Source Converter |
References
- Chanchangi, Y.N.; Adu, F.; Ghosh, A.; Sundaram, S.; Mallick, T.K. Nigeria’s energy review: Focusing on solar energy potential and penetration. Environ. Dev. Sustain. 2022. [Google Scholar] [CrossRef] [PubMed]
- Joseph, A. Renewable Energy and Nigeria’s Power Sector; 2016. Available online: https://foundationchambers.com/wp-content/uploads/2021/02/NIGERIA%E2%80%99S-POWER-SECTOR.pdf (accessed on 4 September 2022).
- Augutis, J.; Krikstolaitis, R.; Alzbutas, R.; Matuzas, V.; Uspuras, E. Reliability analysis of the electricity transmission system in Lithuania. Manag. Inf. Syst. 2004, 9, 573–580. [Google Scholar]
- Olasunkanmi, O.G.; Alao, P.O.; Onaifo, F.; Osifeko, M.O.; Sholabi, J.O. Reliability assessment of a gas generating station in Ogun State, Nigeria. J. Appl. Sci. Environ. Manag. 2018, 22, 1005. [Google Scholar] [CrossRef] [Green Version]
- Olasunkanmi, O.; Oyodeji, A.; Okubanjo, A. Fault analysis and prediction of power distribution networks on 11 kV Feeders: A case study of Eleweeran and Poly Road 11kV Feeders, Abeokuta. MANAS J. Eng. 2020, 8, 37–48. [Google Scholar]
- Nader, A.A.S. Reliability Assessment of Electric Power Systems Using Genetic Algoriths; Texas A & M University: College Station, TX, USA, 2004. [Google Scholar]
- Dechsiri, C. Introduction to Stochastic Models and Markov Chains. In Particle Transport in Fluidized Beds: Experiments and Stochastic Models; Groningen, The Netherlands, 2004; pp. 1–23. Available online: https://research.rug.nl/en/publications/particle-transport-in-fluidized-beds-experiments-and-stochastic-m (accessed on 20 February 2021).
- F&I of Actuaries. Description of Stochastic Models; 1959; Volume 2, Available online: https://faculty.wcas.northwestern.edu/robvoigt/courses/2021_fall/ling334/readings/finitary_models.pdf (accessed on 20 February 2021).
- Aschidamini, G.L.; da Cruz1, G.A.; Resener, M.; Leborgne, R.C.; Pereira1, L.A. A Framework for Reliability Assessment in Expansion Planning of Power Distribution Systems. Energies 2022, 15, 5073. [Google Scholar] [CrossRef]
- IEEE Guide for Electric Power Distribution Reliability Indices, 2012th ed.; IEEE (Ed.) IEEE: New York, NY, USA, 2012. [Google Scholar]
- Billinton, R.; Allan, R.N. Reliability Evaluation of Engineering Systems: Concepts and Techniques, 2nd ed.; Plenum Press: New York, NY, USA, 1992; Volume 5, ISBN 9781489906878. [Google Scholar]
- Du, P.; Li, W. Frequency Response Impact of Integration of HVDC into a Low-Inertia AC Power Grid. IEEE Trans. Power Syst. 2021, 36, 613–622. [Google Scholar] [CrossRef]
- Zadkhast, S.; Fotuhi-Firuzabad, M.; Aminifar, F.; Billinton, R.; Faried, S.O.; Edris, A.A. Reliability evaluation of an HVDC transmission system tapped by a VSC station. IEEE Trans. Power Deliv. 2010, 25, 1962–1970. [Google Scholar] [CrossRef]
- Ghiasi, M.; Ghadimi, N.; Ahmadinia, E. An Analytical Methodology for Reliability Assessment and Failure Analysis in Distributed Power System. SN Appl. Sci. 2018, 1, 1–44. [Google Scholar] [CrossRef] [Green Version]
- Okozi, S.O. Reliability Assessment of Nigerian Power Systems Case Study of 330kv Transmission Lines in Benin Sub–Region. Int. J. Eng. Res. 2018, V7, 399–405. [Google Scholar] [CrossRef]
- DIgSILENT. PowerFactory 2020 User Manual, 2020th ed.; GmbH, D., Ed.; DIgSILENT GmbH Heinrich-Hertz-Straße 9: Gomaringen, Germany, 2020. [Google Scholar]
- Van der Merwe, J. Simplified Approach for the Reliability Estimation of Large Transmission and Sub-Transmission Systems. 2014. Available online: https://open.uct.ac.za/handle/11427/9093 (accessed on 20 February 2021).
- Kueck, J.D.; Brendan, J.K.; Philip, N.O.; Lawrence, C.M. Measurement Practices for Reliability and Power Quality; 2004. Available online: https://info.ornl.gov/sites/publications/Files/Pub57467.pdf (accessed on 20 February 2021).
- Billinton, R.; Kumar, S. A Comparative Study of System Versus Load Point Indices for Bulk Power Systems. IEEE Power Eng. Rev. 1986, PWRS-1, 41. [Google Scholar] [CrossRef]
- Okorie, P.U.; Aliyu, U.O.; Jimoh, B.; Sani, S.M. Reliability Indices of Electric Distribution Network System Assessment. Quest J. J. Electron. Commun. Eng. Res. 2015, 3, 1–6. [Google Scholar]
- Reliability and Quality of Supply of Electricity to Customers in NSW; New South Wales. 2005. Available online: https://www.google.com/url?sa=t&rct=j&q=&esrc=s&source=web&cd=&ved=2ahUKEwjIq-yS6YT8AhXYlGoFHXwuBrUQFnoECAwQAQ&url=https%3A%2F%2Fwww.ipart.nsw.gov.au%2Fsites%2Fdefault%2Ffiles%2Fdocuments%2Finformationpaperno3-reliabilityandqualityofsupplyofelectricitytocustomersinnsw-pdffinal_000.pdf&usg=AOvVaw2lyQBV3Ir8SGT2sHJhrF5f (accessed on 20 February 2021).
- Teixeira, J. IEEE 1366-Reliability Indices; Boston, MA, USA, 2019. Available online: https://powerquality.blog/2021/01/19/ieee-1366-reliability-indices/ (accessed on 20 February 2021).
- CEER (Council of European Energy Regulators) 6th CEER Benchmarking Report on the Quality of Electricity and Gas Supply; Brussels, Belgium, 2016. Available online: http://webfileservice.nve.no/API/PublishedFiles/Download/201506197/2126667 (accessed on 5 March 2021).
- Khanorkar, A.R.; Kinhekar, N. Development of reliability assessment framework for extra high voltage transmission network in India and application on Maharashtra. In Proceedings of the Proceedings-2018 International Conference on Smart Electric Drives and Power System, ICSEDPS, Nagpur, India, 12–13 June 2018; IEEE: Piscataway, NJ, USA, 2018; pp. 198–203. [Google Scholar]
- SAIDI & SAIFI | kplc.co.ke. Available online: https://kplc.co.ke/content/item/794/saidi---saifi (accessed on 30 August 2021).
- Rouse, G.; Kelly, J. Electricity Reliability: Problems, Progress, and Policy Solutions; Galvin Electricity Initiative: Chicago, IL, USA, 2011; Available online: http://www.galvinpower.org/sites/default/files/Electricity_Reliability_031611.pdf (accessed on 15 May 2022).
- Olasunkanmi, O.G.; Deng, Z.; Todeschini, G. Load flow analysis of the Nigerian transmission grid using DIgSILENT PowerFactory. In Proceedings of the 2021 56th International Universities Power Engineering Conference: Powering Net Zero Emissions, UPEC 2021-Proceedings, Middlesbrough, UK, 31 August 2021–3 September 2021; IEEE: Piscataway, NJ, USA, 2021; pp. 8–13. [Google Scholar]
- Akintola, A.A.; Awosope, C.O.A. Reliability Analysis of Secondary Distribution System in Nigeria: A Case Study of Ayetoro 1 Substation, Lagos State. Int. J. Eng. Sci. 2017, 6, 13–21. [Google Scholar] [CrossRef]
- Alassi, A.; Bañales, S.; Ellabban, O.; Adam, G.; MacIver, C. HVDC Transmission: Technology Review, Market Trends and Future Outlook. Renew. Sustain. Energy Rev. 2019, 112, 530–554. [Google Scholar] [CrossRef]
- Dey, S.; Bhattacharya, T. Monopolar operation of Modular Multilevel DC-DC Converter Based Hybrid Bipolar HVDC Links. In Proceedings of the 2021 IEEE Texas Power Energy Conf. TPEC 2021, College Station, TX, USA, 2–5 February 2021. [Google Scholar] [CrossRef]
- DIgSILENT GmbH. Technical Reference PWM Converter; DIgSILENT GmbH Heinrich-Hertz-Straße 9: Germany, 2020. Available online: https://www.digsilent.de (accessed on 7 May 2022).
- Converter. Wartsila. Available online: https://www.wartsila.com/encyclopedia/term/converter (accessed on 9 August 2022).
- Font, A.; Ilhan, S.; Ismailoglu, H.; Cortes, F.E.; Ozdemir, A. Design and technical analysis of 500–600 kV HVDC transmission system for Turkey. In Proceedings of the 2017 10th International Conference on Electrical and Electronics Engineering, ELECO, Bursa, Turkey, 30 November–2 December 2017; pp. 201–205. [Google Scholar]
- Flourentzou, N.; Member, S.; Agelidis, V.G.; Member, S.; Demetriades, G.D. VSC-Based HVDC Power Transmission Systems: An Overview. IEEE Trans. POWER Electron. 2009, 24, 592–602. [Google Scholar] [CrossRef]
- Qin, X.; Zeng, P.; Zhou, Q.; Dai, Q.; Chen, J. Study on the development and reliability of HVDC transmission systems in China. In Proceedings of the 2016 IEEE International Conference on Power System Technology, POWERCON, Wollongong, Australia, 28 September–1 October 2016; IEEE: Piscataway, NJ, USA, 2016. [Google Scholar]
- Akinloye, B.O.; Oshevire, P.O.; Epemu, A.M. Evaluation of System Collapse Incidences on The Nigeria Power System. 2016, Volume 3. Available online: www.jmest.org (accessed on 25 July 2022).
- Department of Energy, U. Reliability Improvements from the Application of Distribution Automation Technologies-Initial Results. 2012. Available online: www.smartgrid.gov (accessed on 20 September 2022).
Figure 1.
Single-line diagram of the Nigerian 330 kV transmission network.

Figure 2.
VSC-HVDC single line model.

Figure 3.
LPI results for radial feeder A.

Figure 4.
LPI results for radial feeder B.

Figure 5.
LPI results for radial feeder C.


Table 1.
Reliability indices of the case study compared with the IEEE standard 1366 [26].
Table 1.
Reliability indices of the case study compared with the IEEE standard 1366 [26].
| Index | SAIDI (h/yr) | SAIFI (Interruption/yr) | CAIDI (h) | ASAI % |
|---|---|---|---|---|
| IEEE Standard 1366 | 1.50 | 1.10 | 1.36 | 99.9999 |
| India | 0.27 | 0.17 | 1.62 | - |
| Algeria | 45.0 | 1.40 | - | - |
| Egypt | 1.27 | 0.09 | 14.11 | - |
| Kenya | 11.5 | 4.5 | 2.6 | - |
| USA | 4.08 | 1.49 | 2.05 | 99.91 |
| UK | 1.50 | 0.80 | 1.67 | 99.96 |
| Australia | 0.93 | 0.80 | 1.16 | - |
Table 2.
Load-flow results [27].
Table 2.
Load-flow results [27].
| Load-Flow Result | ||
|---|---|---|
| P (MW) | Q (Mvar) | |
| Generation | 4804.39 | −297.566 |
| Load | 4654.46 | 1281.339 |
| Losses | 149.9325 | −2338.07 |
Table 3.
for the summer and the winter scenarios.
| Summer | Winter | |||||
|---|---|---|---|---|---|---|
| Bus | P (MW) | S (MVA) | P (MW) | S (MVA) | ||
| Aja | 162.7 | 202.76 | 136,082 | 123.41 | 123.41 | 382,826 |
| Alagbon | 162.0 | 178.52 | 119,811 | 135.03 | 143.99 | 96,638 |
| Alaoji | 414.7 | 426.69 | 286,372 | 330.6 | 403.17 | 270,584 |
| Ayede | 208.0 | 209.47 | 140,581 | 230.0 | 237.04 | 159,090 |
| Birnin-Kebbi | 198.0 | 198.02 | 132,899 | 187.0 | 202.15 | 135,669 |
| Benin | 132.9 | 179.6 | 120,536 | 170.9 | 195.43 | 131,164 |
| Ganmo | 80.0 | 80.0 | 53,691 | 122.0 | 122.61 | 82,291 |
| Gombe | 154.0 | 156.89 | 105,299 | 116.0 | 153.28 | 102,872 |
| Ikeja West | 1135.0 | 1152.56 | 773,529 | 1102.0 | 1305.86 | 876,417 |
| Jebba | 14.0 | 14.07 | 9443 | 21.0 | 22.14 | 14,856 |
| Jos | 80.0 | 101.81 | 68,331 | 54.0 | 67.18 | 45,089 |
| Kaduna | 176.0 | 176.0 | 118,121 | 102.0 | 102 | 68,456 |
| Kano | 277.0 | 277.0 | 185,906 | 199.0 | 199 | 133,557 |
| Katampe | 465.0 | 482.83 | 324,047 | 381.1 | 390.9 | 262,352 |
| Makurdi | 161.96 | 208.11 | 139,673 | 135.23 | 135.23 | 90,758 |
| New Haven | 100.0 | 101.19 | 67,913 | 170.0 | 230.22 | 154,507 |
| Onitsha | 141.5 | 152.13 | 102,104 | 168.0 | 196.37 | 131,792 |
| Osogbo | 167.0 | 195.09 | 130,930 | 162.6 | 198.04 | 132,915 |
| Sakete | 226.0 | 228.0 | 153,018 | 54.0 | 59.68 | 40,055 |
| Sapele | 64.1 | 79.94 | 53,652 | 74.4 | 74.91 | 50,278 |
| Shiroro | 61.6 | 61.8 | 41,479 | 88.0 | 88.57 | 59,444 |
| Yola | 73.0 | 77.49 | 52,008 | 42.0 | 52.5 | 35,233 |
| Lekki | 0 | 0 | 0 | 135.03 | 135.03 | 90,624 |
| Total | 4654.46 | 4939.98 | 3,315,425 | 4303.30 | 4838.73 | 3,547,467 |
Table 4.
Electrical parameters and reliability parameters of the HVDC model in PF.
| Parameters | Values |
|---|---|
| Rated DC-voltage | ±500 kV |
| Converter-rated power | 500 MVA |
| Rated AC-voltage | 330 kV |
| Topology | Bipolar |
| Short-circuit impedance | 10% |
| Copper losses | 25 MW |
| Failure frequency | 3 (1/yr) |
| Repair duration | 5 h |
Table 5.
Control parameters of the HVDC model in PF.
| Parameters | Values |
|---|---|
| DC voltage setpoint | 1 pu |
| AC voltage setpoint | 1 pu |
| Reactive-power setpoint | 0 Mvar |
| Active-power setpoint | (to be set based on the location) |
Table 6.
Base-case reliability indices result for the Nigerian Transmission System.
| Index | SAIDI (h/yr) | SAIFI (Interruption/yr) | CAIDI (h) | ASAI % |
|---|---|---|---|---|
| Summer | 1.441 | 0.8105 | 1.779 | 99.9832 |
| Winter | 0.872 | 0.4037 | 2.160 | 99.9892 |
Table 7.
Line data for manual reliability (summer scenario).
| Line | TNO | TFD (h) | |
|---|---|---|---|
| Gombe | 2 | 0.5 | Gombe: 105,299 |
| Gombe Yola | 6 | 2.99 | Yola: 52,008 |
| Birnin Kebbi Kanji | 4 | 17.14 | Birnin Kebbi: 132,899 |
| Sakete Ikeja West | 10 | 14.82 | Sakete: 153,018 |
Table 8.
Comparison of PF results and manual calculations.
| Index | SAIDI (h/yr) | SAIFI (Interruption/yr) | CAIDI (h) | ASAI % |
|---|---|---|---|---|
| PF results | 1.441 | 0.811 | 1.779 | 99.9832 |
| Manual calculation | 1.442 | 0.811 | 1.778 | 99.9835 |
| Difference | 0.001 | 0.000 | 0.001 | 0.0003 |
Table 9.
LPI values for the four loads with lowest performances in the network.
| Load-Point Interruption | Gombe | Yola | Birnin-Kebbi | Sakete |
|---|---|---|---|---|
| LPIF (1/yr) | 1.987 | 7.988 | 3.999 | 10.003 |
| LPIT (h/yr) | 0.497 | 3.487 | 17.136 | 14.824 |
Table 10.
Reliability results without VSC-HVDC and with VSC-HVDC link on the network (for the summer scenario).
Table 10.
Reliability results without VSC-HVDC and with VSC-HVDC link on the network (for the summer scenario).
| Index | SAIDI (h/yr) | SAIFI (Interruption/yr) | CAIDI (h) | ASAI % |
|---|---|---|---|---|
| Case 0-Without HVDC links | 1.441 | 0.811 | 1.779 | 99.9832 |
| Case 1-HVDC between Azura and Gombe | 1.418 | 0.716 | 1.980 | 99.9838 |
| Case 2-HVDC between Azura and Yola | 1.371 | 0.622 | 2.204 | 99.9843 |
Table 11.
LPI results for the four loads for Case 1.
| Load-Point Interruption Case 1 | Gombe | Yola | Birnin- Kebbi | Sakete |
|---|---|---|---|---|
| LPIF (1/yr) | 0 | 6 | 3.999 | 10.003 |
| LPIT (h/yr) | 0 | 2.99 | 17.136 | 14.824 |
Table 12.
LPI results for the four loads for Case 2.
| Load-Point Interruption Case 2 | Gombe | Yola | Birnin- Kebbi | Sakete |
|---|---|---|---|---|
| LPIF (1/yr) | 0 | 0 | 3.999 | 10.003 |
| LPIT (h/yr) | 0 | 0 | 17.136 | 14.824 |
Publisher’s Note: MDPI stays neutral with regard to jurisdictional claims in published maps and institutional affiliations. |
© 2022 by the authors. Licensee MDPI, Basel, Switzerland. This article is an open access article distributed under the terms and conditions of the Creative Commons Attribution (CC BY) license (https://creativecommons.org/licenses/by/4.0/).
Share and Cite
MDPI and ACS Style
Olasunkanmi, O.G.; Apena, W.O.; Barron, A.R.; White, A.O.; Todeschini, G. Impact of a HVDC Link on the Reliability of the Bulk Nigerian Transmission Network. Energies 2022, 15, 9631. https://doi.org/10.3390/en15249631
AMA Style
Olasunkanmi OG, Apena WO, Barron AR, White AO, Todeschini G. Impact of a HVDC Link on the Reliability of the Bulk Nigerian Transmission Network. Energies. 2022; 15(24):9631. https://doi.org/10.3390/en15249631
Chicago/Turabian StyleOlasunkanmi, Omowumi Grace, Waliu O. Apena, Andrew R. Barron, Alvin Orbaek White, and Grazia Todeschini. 2022. "Impact of a HVDC Link on the Reliability of the Bulk Nigerian Transmission Network" Energies 15, no. 24: 9631. https://doi.org/10.3390/en15249631
Note that from the first issue of 2016, this journal uses article numbers instead of page numbers. See further details here.