
Modelling Fertilizer Use in Relation to Farmers’ Household Characteristics in Three Gorges Reservoir Area, China


1
College of Resources and Environment, Southwest University, Beibei, Chongqing 400715, China
2
Soil Physics and Land Management Group, Wageningen University, 6708 PB Wageningen, The Netherlands
3
College of Engineering, Swansea University, Swansea SA2 8PP, UK
*
Author to whom correspondence should be addressed.
Agriculture 2021, 11(6), 472; https://doi.org/10.3390/agriculture11060472
Submission received: 10 April 2021
/
Revised: 19 May 2021
/
Accepted: 19 May 2021
/
Published: 21 May 2021
(This article belongs to the Section Agricultural Economics, Policies and Rural Management)
Abstract
:Non-point source pollution from excessive use of fertilizers in agriculture is a major cause of the eutrophication problem in China. Understanding farmers’ decision-making concerning fertilization and identifying the influencing factors in this process are key to tackling overfertilization and related pollution issues. This paper reports a study on modelling decisions about fertilizer use based on data collected from 200 farmer households in the Three Gorges Reservoir area of China, using a well-fitted artificial neural network (ANN) with incorporated variance-based sensitivity analysis. The rate of fertilizer use estimated from the model is in good agreement with observed data. The model is further validated and tested by comparing the simulated and observed values. Results show that the model is able to identify the influencing factors and their interactions causing the variation in fertilizer use and to help pinpoint the underlying reasons. It is found that the farmers’ fertilization behavior is greatly affected by the area of cultivated land, followed by the interaction among farmers’ education level, annual income, and awareness of the importance of environmental protection. Future land consolidation is one of several ways to achieve more sustainable fertilization strategies.
1. Introduction
Chemical fertilizers are widely used in many agricultural fields and have contributed to achieving global food security [1,2,3,4]. In China, the application of chemical fertilizers has become one of the most widely used measures to increase crop production to feed the massive population while facing a relative scarcity of cultivable land. Consequently, China currently contributes around 31% of the world’s total fertilizer use according to the statistics released by the Food and Agriculture Organization (FAO) [5]. Although the widespread application of chemical fertilizers has improved the overall agricultural output in China, it has caused serious environmental problems that threaten further sustainable agricultural development [6] by inducing a decline in soil fertility and fertilizer utilization efficiency, and environmental pollution [7,8]. For example, the Yangtze River and the Yellow River Basins have witnessed severe eutrophication, with approximately 92% and 88% of the total nitrogen (TN) coming from agricultural non-point source pollution every year, respectively [9].
The agricultural area adjoining the middle section of the Three Gorges reservoir has been regarded as a key area for the prevention and control of nutrient pollution [10]. The Three Gorges reservoir area is characterized by its mountainous topography and subtropical monsoon climate, with an annual precipitation of 1000 to 1800 mm [11]. Around 33.6% of the land of this hilly and mountainous area is covered by crops. Such sloping arable land is often exposed to heavy rainfall, which exacerbates the risk of pollution caused by nitrogen, phosphorus, and other agricultural fertilizers, ultimately affecting the water quality of the reservoir. The best way to reduce the pollution by fertilizer use has become an urgent issue to be addressed. On the one hand, the water quality in the Three Gorges Reservoir has gradually deteriorated because of poor self-purification capacity and a concentrated backwater area [12]. For example, 52% to 59% of the total phosphorus, total nitrogen, organic matter, and other pollutants in the secondary rivers are due to the agricultural fertilizer use [13]. On the other hand, the mountainous topography splits the cultivated land into many small parcels, which significantly hinders the application of mechanized planting. Moreover, there is a lack of scientific guidance on fertilizer application, and as such, individual farmers are the main entity determining the usage of fertilizers. Thus, human-related factors, such as motivation, education, and access to advisory services, have affected the agricultural environment through farmers’ decision-making on fertilizer use. The complex relationship between these factors and fertilizer use, as well as the interaction among these factors, render it very challenging to quantify and further predict the fertilizer use in the region.
While individual farmers’ characteristics and considerations play a significant role in deciding the usage of fertilizer in their fields, studies quantifying key variables are scarce. One such study, conducted by Freeman and Omiti [14], identified that the annual income per capita, farmers’ education level, and agricultural technology promotion are the main factors affecting farmers’ fertilizer use. Other studies found that the farmers’ gender, age, educational level, and income level can affect farmers’ environmental awareness and hence their environmental behaviors towards agricultural pollution [15,16,17]. The opportunity cost of labour and the quality of land are also found to be important factors, e.g., a price-premium on organic food and farm size are the driving factors that encourage farmers to apply organic fertilizers to reduce or replace chemical fertilizers [18]. Overall, as farmers are the main decision makers in fertilization management, their knowledge and skills have a direct impact on the quantity of fertilizer use and the efficiency of fertilization [19]. To understand the variation in farming behavior on fertilizer use, several studies employed multiple linear regression models (MLR) [14,15,16,17,18,19,20] and correlation analysis [15,16,17] to quantify the strength of the relationship between the response (e.g., fertilizer use) and the impact factors by assuming a linear relationship. However, such a prior assumption of the models has been challenged as the actual relation between responses is usually more complex and nonlinear [21]. Therefore, more sophisticated tools such as the Epistics agronomic model [22] and decision trees [23] have also been applied to identify the important factors influencing nitrogen fertilizer use efficiency.
In this study, we designed a questionnaire-based survey to investigate the characteristics of farmers’ households, followed by building an artificial neural network (ANN) model to identify and quantify the links between household characteristics and fertilizer use in several typical rural villages in the Three Gorges Reservoir in China. ANN, as a popular machine learning method, has been widely adopted in many fields to address various types of problems [24]. One of the advantages of ANN models is their ability to reveal the nonlinear and often intricate relationships between input and response variables [25,26,27]. This makes it a strong candidate for studying the decision-making in fertilization, which is also the reason for selecting ANN in this study.
The rest of the paper is structured as follows: Section 2 discusses the study area as well as the main methodologies in survey design, ANN model building, and sensitivity analysis. The results are presented in Section 3, while the discussion and conclusions are given in Section 4 and Section 5, respectively.
2. Materials and Methods
2.1. Study Area
The study area (29°89′–29°92′ N, 107°45′–107°53′ E) is located in the Fuling county in the city of Chongqing and consists of 8 villages of approximately 50 km2 in size, as shown in Figure 1. It is situated to the north of the Yangtze River within the Three Gorges Reservoir Area. The study area has a humid subtropical monsoon climate, with a mean annual temperature of 22.0 °C and a mean annual precipitation of 1052 mm (2000–2016). The main soil type is the lithomorphic purple soil (Inceptisol), where the topsoil nutrient status is rich in mineral content and natural nutrients [28]. Around 95% of the total area is hilly, with elevations between 153 and 330 m, including 7.46% with slopes 0°–6°, 32.29% with slopes 6°–15°, and 53.24% with slopes over 15°. The land use can be classified into paddy fields, dryland crops, forests, orchards, grasslands, ponds, and housing estates. The main types of crops planted in the area are rice, maize, and tuber mustard (Brassica juncea subsp. Tsatsai). Tuber mustard is an important industrial crop in the study area: 52% of tuber mustard in China is produced in the Fuling county. Manual cultivation is the main tillage method practiced in the area, supplemented by micro-mechanical cultivation. Decisions about fertilizer use are made by individual farmers in this area. Frequent heavy rainfalls combined with the steep topography cause soil erosion and induce nonpoint-source pollution under the excessive fertilization regime [28].
2.2. Methodology
The main data, i.e., the farmers’ household characteristics, were collected via questionnaires that were manually distributed to the households in the study area during a face-to-face survey. The answers collected in the questionnaire were then classified and used as input variables (predictors) to train an ANN model whose output is the household fertilizer use. A variance-based sensitivity analysis was then applied to obtain the most sensitive (influencing) factors that determine fertilizer use. The three-step methodology is summarized below and depicted as a flow chart in Figure 2.
- Questionnaire collection and data processing: responses to the questionnaire questions that are related to basic, economic, and agricultural information, and farmers’ attitudes towards the environment, were firstly collected from the survey conducted in the area where 200 households were visited and responded. Then, the collected answers were summarised as 8 factors (presented in Table 1) and converted into numerical values used as the inputs (i.e., the first 7 factors) and output (i.e., the fertilizer use) of ANN models.
- Analysis of the correlation among the factors: Pearson correlation coefficients (R) were calculated among the 8 factors to detect whether there is a significant relation between them and to reveal the interdependencies.
- Building and training the ANN models: after processing and testing for correlations between factors, several ANN models were built with different settings of the hidden layers. The data were randomly partitioned into three sets (70%/15%/15%) to feed in these ANN models for training, validating, and testing, respectively. Subsequently, an error analysis was conducted for evaluating the performance of the ANN models and the optimal structure was selected.
- Sensitivity analysis: a variance-based sensitivity analysis of the optimal ANN model was conducted over the input variables that were sampled using a quasi-Monte-Carlo [27] sampler with pre-defined distributions. Both direct and interaction contributions of factors to the variation of fertilizer use were quantified in order to select the most important factors and explain the underlying reasons.
2.2.1. Data Collection and Questionnaire Design
At the beginning of the study, a field survey was conducted with pre-designed questionnaires distributed to 200 households via face-to-face interviews with the farmers. The households surveyed cover the entire population of 982 people in the area where multiple generations live under one roof and the average household size is around 4.9 persons. The landscape of sloped farmland and the manual cultivation tillage method of the study area is typical in the Three Gorges reservoir area [12,13]. For each household, the respondent is the decision maker concerning fertilizer uses of the household. Therefore, exploring the fertilization practices of farmers is of practical significance to identify possible factors for enhancing environmental protection. The characteristics of the respondents in our survey reflected the current situation in rural China, i.e., aging, labour shortage, and widespread low levels of education.
The survey was targeted at the planting activities of the previous year of each household and the related factors that may affect the decision-making of fertilizer use, covering the following five aspects:
- Basic information of the household decision-maker, i.e., gender, age, and education level.
- Economic situation of the household, i.e., the annual income.
- Agricultural background of the household, i.e., the cultivated area of each household and the main crop grown.
- The main decision-makers’ attitude towards environmental protection, i.e., perception on responsibility to address pollution (local government, industries, or individuals), willingness to take action (reduce pollution, test soil fertilization, or do nothing), and their perceived required strategy to address fertilizer pollution (government action or individual responsibility).
- Fertilizer use for the past year.
Answers to these questions were recorded into two formats: the quantitative factors such as cultivated area and annual income were recorded as numerical data, and the qualitative factors such as gender and education levels were categorized. The details of the factors are shown in Table 1, where factors X1 to X8 are used as the input variables and (fertilizer use) is the output variable for the ANNs to be trained.
2.2.2. ANN Model Training and Calibration
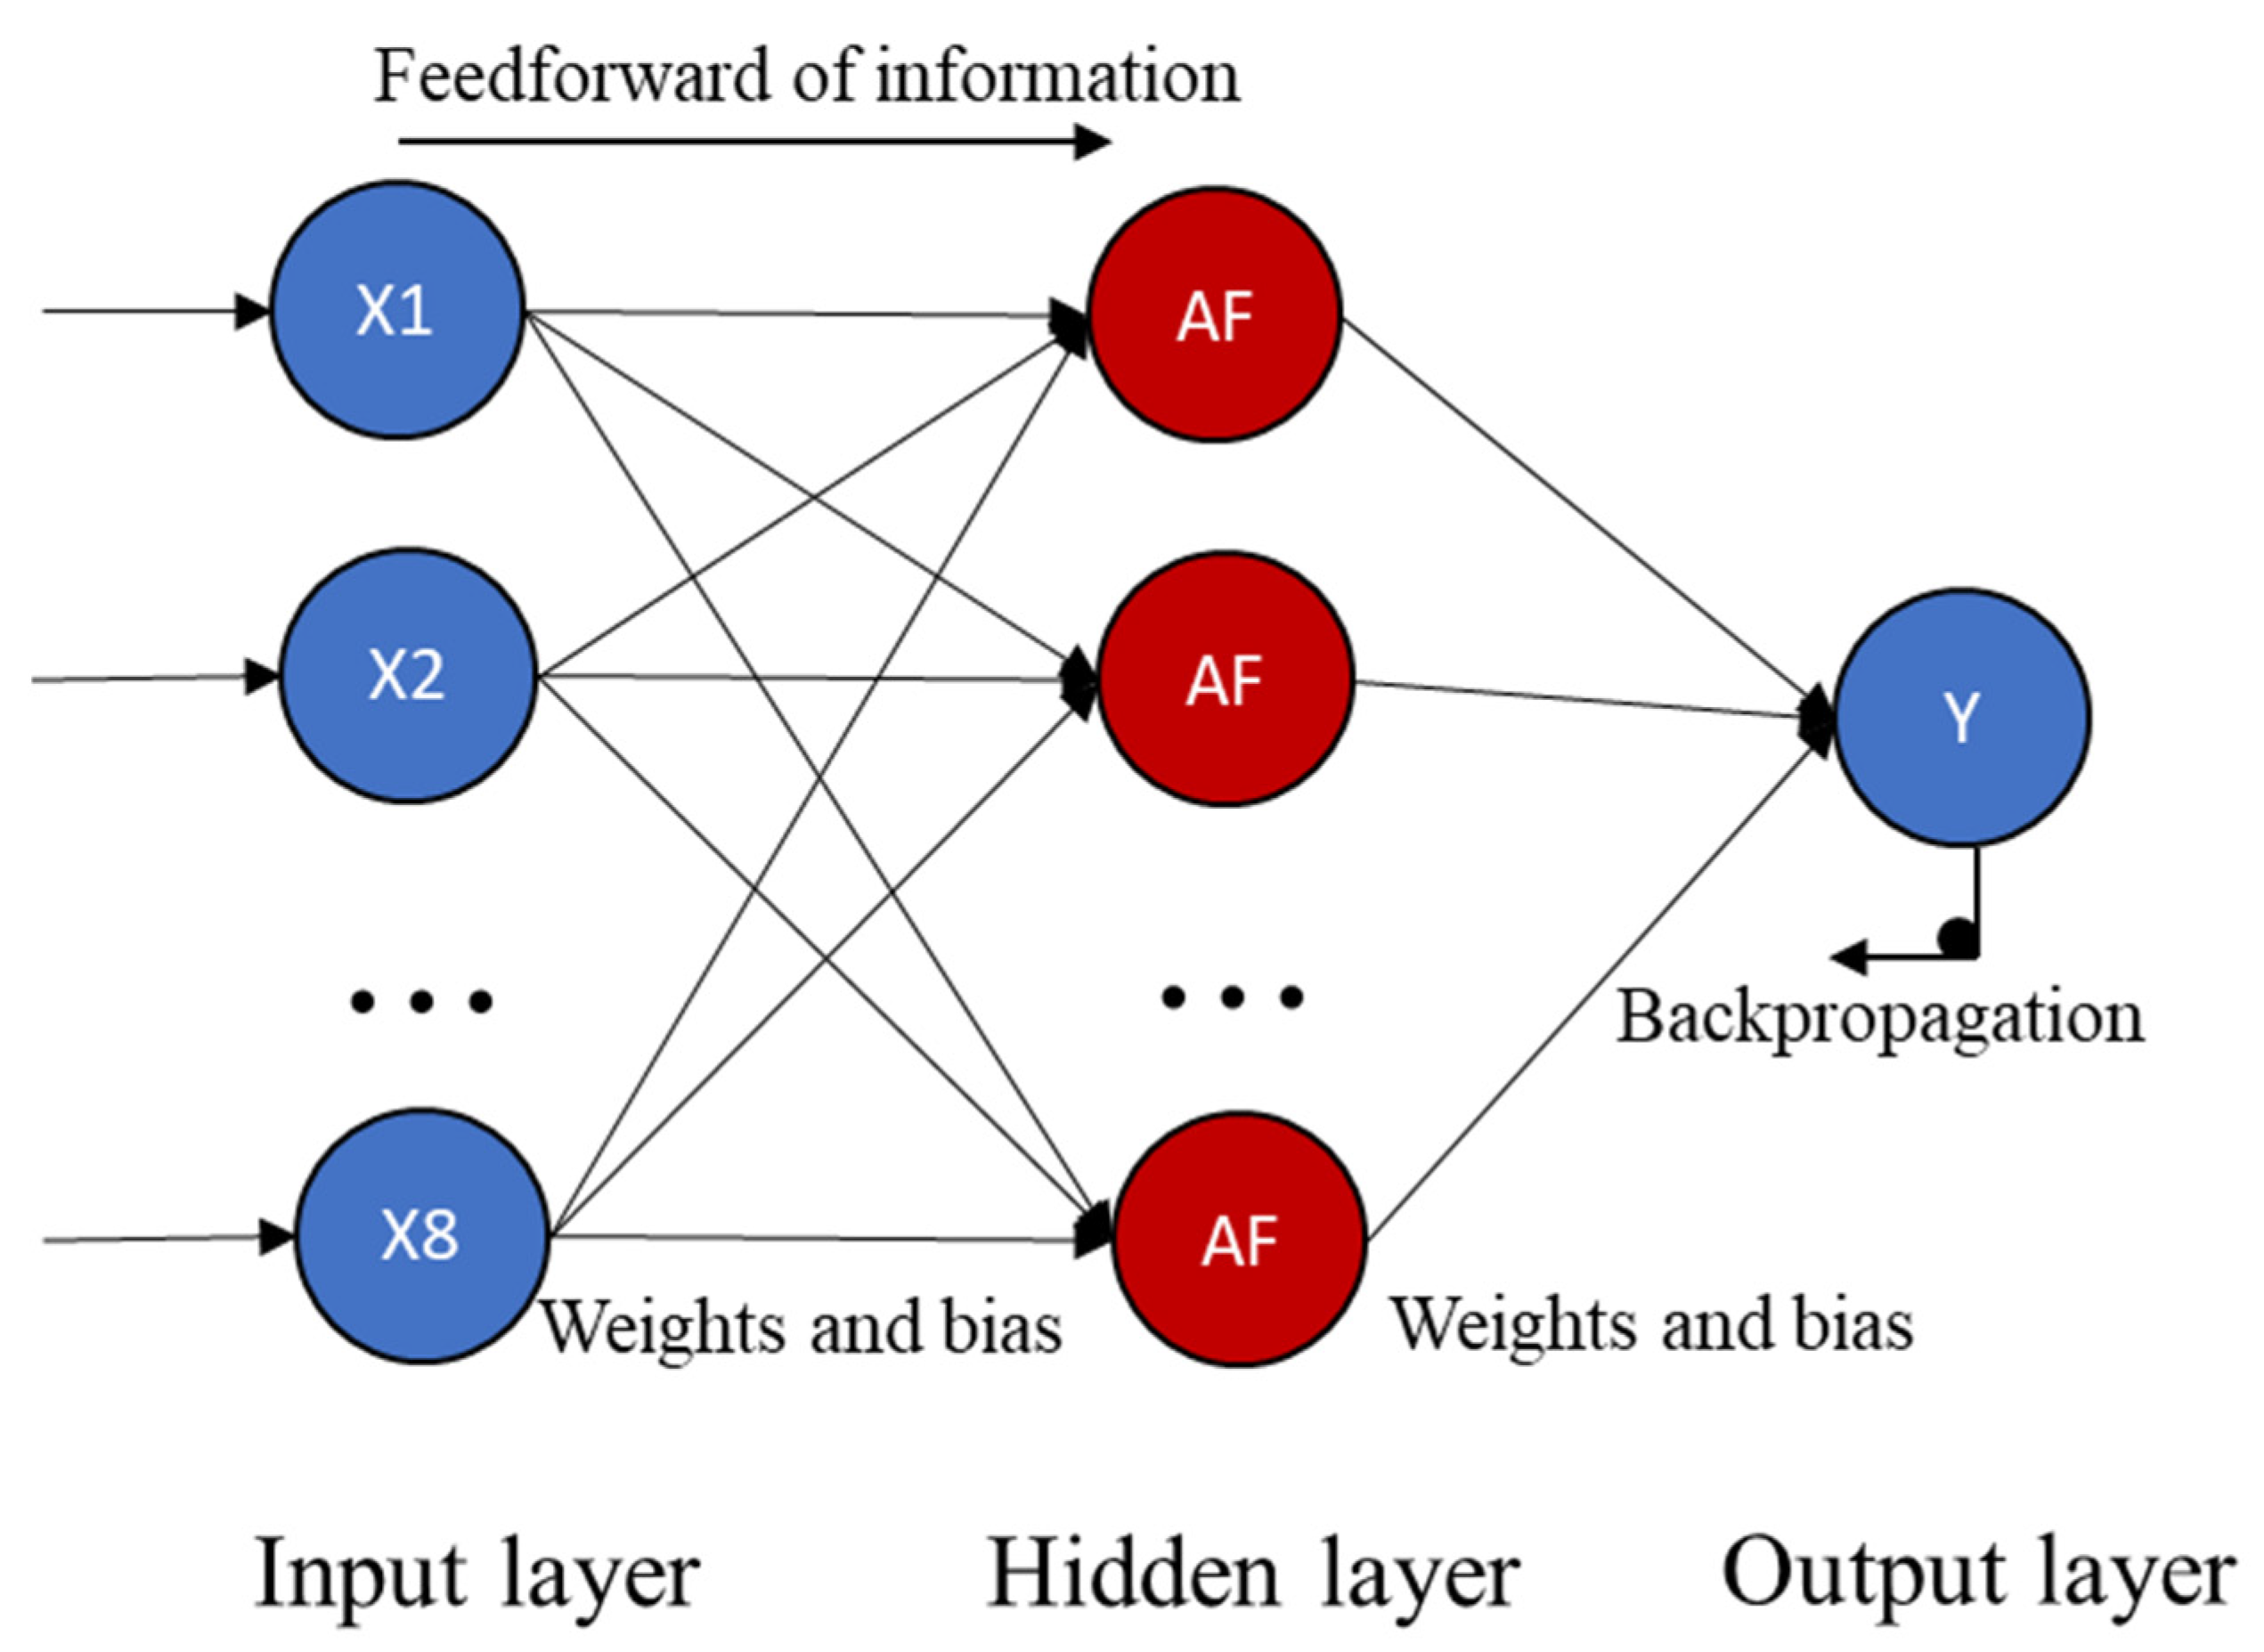
Inspired by the sophisticated functionality of human brains that contain numerous inter-connected neurons working parallelly [29,30], artificial neural networks (ANNs) have been proposed and widely applied in many research areas that require simulations of complex relationships between input features and response(s). In this study, an ANN model was built to quantify the relationship between the fertilizer use and the household characteristics of the farmers from the study area. Figure 3 shows the architecture of the designed ANN, which includes three layers, i.e., an input layer receiving 8 inputs ( in Table 1) based on the answers from the respondents; an output layer for producing the output, which is the amount of fertilizer use ( in Table 1); and a hidden layer that contains several hidden nodes (neurons) to link the input and the output layers. Each connection (i.e., the lines shown in Figure 3 among the neurons) is associated with a weight and a bias.
Before being sent to the hidden layer, the inputs are transformed using the estimated weight and bias , which is given by [31]:
where is the output of the hidden layer, is the input at the ith input node, and is the total number of hidden nodes; is the activation function (AF), which is usually identical among all hidden nodes of the hidden layer. In this study, we employed the commonly used sigmoid function as the activation function to bond the nodes and to avoid a weak network by divergent nodes [32]. The sigmoid function is given by:
There are also weights and biases used to transform into the final output of the ANN. The Levenberg–Marquardt backpropagation algorithm was used to estimate the weights and bias on each connection. While BP is a steepest descent algorithm, the Levenberg–Marquardt algorithm is derived from Newton’s method that was designed for minimizing functions that are sums of squares of nonlinear functions [33]. As stated by its name, this algorithm starts estimation from the last parameter (i.e., weight or bias) in the last connection (i.e., the connection between the hidden layer and output layer) by assuming the model structure before these connections is already optimal and then propagates backward to update all other weights and biases. The optimal values of the parameters can be obtained by minimizing the sum of the squared residual (SSR), which is defined as the difference between the observed outputs and their corresponding modelled outputs. Furthermore, in order to reach an optimal estimation of the parameters, the algorithm starts with a randomly assigned parameter on the last connection (e.g., the last bias ) and then calculates the step moving to the next estimated [34]:
where learning rate is the factor to control the speed of the backpropagation’s learning process. Usually, a higher learning rate will produce a faster learning process; however, an overly fast process will cause the problem of lack of convergence, while an overly slow process will lead to a less than optimal solution by sticking in a local minimum error [35]. Thus, and the calculation is repeated until the step size approaches to 0 at which point an optimal value of is supposed to be reached.
The number of hidden nodes can be determined by the performance of the network, although some researchers choose this number based on their experience. For example, Bailey and Thompson (1990) [36] suggested the number of hidden neurons can be 75% of input nodes, and Masters (1995) [37] suggested to square the product of the number of input and output nodes to be the number of hidden nodes. In general, too few hidden nodes will lead to an inappropriate and bad model whereas too many nodes will cause overfitting. Thus, we varied the number of hidden neurons from 2 (25% of 8 inputs) to 10 (125% of 8 inputs) and evaluated the performance of each model to find the optimal one.
To analyse the performance of the ANN model, we randomly partitioned the collected data into three sub-sets: 70% of the data for training, 15% for validating, and 15% for testing. The reason for partitioning in this way is to provide a criterion to stop training the network when it becomes overfitting. The test set was chosen to evaluate the prediction skill of the built network by feeding new data. Two indexes were used to measure the model performance, i.e., the coefficient of determination (R2) and the root mean square error (RMSE), which are given by:
where and are the observed and estimated quantity of fertilizer use (i.e., the outputs of ANN), respectively; is the number of samples; and and are the average of observed and estimated quantity of fertilizer use. A better simulation model has a higher R2 value and lower RMSE. Additionally, the values of the lowest error indexes for prediction in RMSE are normally coincident with the highest R2 values. A plot of regression fit was then generated to visualize the performance of the network, and the optimal network was chosen by considering both R2 and RMSE, which are used further for sensitivity analysis.
2.2.3. Sensitivity Analysis
• Uncertainties in inputs
As shown in Table 1, the eight inputs consist of two different types. For the qualitative inputs ( and ), the level, which is the different value the input can take on, should be quantified by the probability of occurrence. However, as there is no prior knowledge or experience on the information, which is mainly the background description of the respondents, we assumed an equal probability for all qualitative inputs. For the quantitative inputs ( and ), as they are measured on a numeric scale, the level can be defined by its probability density function, and the common assumption is to use the uniform distribution over the given range. In addition, the correlations among the inputs were taken into account, especially of those between the inputs and the output. The Pearson correlation coefficients were used to pre-test whether there is a significant correlation between the selected inputs and outputs. The coefficient close to 1 (or −1) indicates a strong positive (or negative) linear relation, while 0 means no linear correlation.
• Variance-based sensitivity analysis
In order to identify and prioritize the most influential factors (among the eight factors) that affect the fertilizer use, we applied a variance-based sensitivity analysis, which performs well when the model is nonlinear or non-monotonic. To briefly explain the procedure, suppose a random vector which represents the 8 input factors, is fed into the deterministic model (i.e., the ANN in this study) whose output denotes . Therefore, the functional composition of the output variance can be presented by analysis of variance (ANOVA, more details can be seen in Sobol (2001) [38] as:
where denotes the variance of , is the second order interaction, and the rest terms are the higher order ones. Then, the sensitivity indices can be derived as presented by Sobol (2001) [38]:
where is the first-order sensitivity index (i.e., “main effect index”), which presents the contribution to the model output variation from the single factor ; denotes the sum of all variance terms excluding the th factor; and is the total sensitivity index, which considers the interactions between the th factor and other 7 factors. An equality between the two indexes ( and ) means the effect of the th factor on the output is only produced by itself and there is no interactive effect between this factor and others.
To estimate the main effect index and total index, a quasi-Monte Carlo sampling method [39] was employed with an initial size of the Monte Carlo sample set as 2000. The estimation process over each sample was repeated 15 times with different values of the factors, picking from their value space to generate the 95% confidence interval of the index. Thus, the total number of model simulations is 2000 × 15. Finally, we analysed two sensitivity indexes and provide a figure (bar with boxplot) to visualize the results.
3. Results
3.1. Background Information of the Respondents
Figure 4a presents the background information of all respondents, such as the proportion of genders, education levels, cultivated area, and annual income. Some remarkable yet very interesting patterns can be found:
- There are no respondents aged below 30—regardless of gender.
- For respondents younger than 60, their households are mainly led by a female. Most of the respondents of this type (more than 70%) have a very low education level, i.e., up to primary school or even illiteracy.
- For respondents older than 60, their household’s leaderships are split more evenly by gender (45% females and 55% males); however, there is always a higher proportion of men that obtained higher education level, regardless of the age groups.
The pattern identified above is quite remarkable, yet far from being unique. It is just a reflection of the rapid urbanization process across China, through which younger generations with good education have moved to the cities and, to some extent, abandoned farmland. Only those older generations lacking sufficient skills and education are left behind and continue practicing agriculture [15,16,17].
Figure 4b presents a Venn chart to show the proportion of different attitudes of respondents to the three environment-related issues:
- The awareness of environmental pollution. Around 20% (38 out of 200) of the respondents show poor or even no awareness at all, while 20% (38 out of 200) acknowledge the importance of environment protection and think that the individual plays an essential role in it.
- Responsibility of pollution reduction. Most respondents selected a single responsible party, i.e., the individuals (40%) and the local government (31%), while few of them (6%) think industrial companies are the primary responsible party.
- The willingness to act in the future. It is observed that more than 90% (188 out of 200) of the respondents are willing to either reduce their fertilizer use or test the soil prior to fertilization.
The general types of fertilizer used are urea (46N), a compound fertilizer named Tengsheng, N (20%), P2O5 (8%), and K2O (10%) (N-P-K: 20-8-10). In this paper, the fertilizer use (kg·hm−2) refers to the total weight of different types of fertilizer per area used by the farmers. The mean value of fertilizer use per area collected from the questionnaires was 423.5 kg·hm−2. In comparison, the average fertilizer use in China was 465.8 kg·hm−2 in 2019, indicating that the mean fertilizer use of the sample was lower than the national average. Regarding the differences in fertilizer use across all respondents, in total, 34.5% respondents (69 out of 200) used more fertilizer than the local mean value. Some respondents applied more than twice the amount of the mean value. Further, around 7% respondents applied fertilizer rates higher than 800 kg·hm−2, alongside 24% who applied less than 200 kg·hm−2.
These large differences in fertilizer use in the same region should be treated seriously. According to the farmers investigated in this study, many farmers (not only those investigated) in this region (Chongqing) choose to practice rice-tuber mustard and especially maize-tuber mustard rotations in order to achieve more economic gains. Fertilizers are applied only once during the paddy rice cultivation but twice during the maize cultivation, with the first taking place before the planting in March and the second application at the jointing stage in May. In contrast, tuber mustard usually receives twice the amount of fertilizer as farmers believe there is a strong relation between mustard yield and the quantity of fertilizer applied. From government statistic in 2008–2015, the average yield of rice is 6.8 t/hm2, maize is 5.6 t/hm2, and tuber mustard is 36 t/hm2 by comparison. During the tuber mustard season, the amount of nitrogen fertilizer applied by farmers is generally high, although the application rate among farmers is also variable.
3.2. Statistical Analysis on the Inputs
To screen the relationship among all the inputs and output, Pearson correlation coefficients are calculated at the significance level of 0.05. The results are shown in Table 2, where the -values are given in brackets. A -value less than the significance level indicates a significant correlation. All significant correlations are highlighted in bold in Table 2. Among the model inputs, there is a relatively strong positive correlation between the factor of the cultivated area () and the annual income (), which implies that the main source of income of these households remains the sales volume of farming products, which in turn depends on the size of the cultivated area they own. More interestingly, there are significant correlations among the gender (), the age (), and the highest education level () of the leader (respondent) of the households, which is also visualized in Figure 4a. However, a negative correlation (R = −0.218, -value =0.002) between the age and the highest education level factors echoes the reality of a high proportion of illiteracy in the old generation who participate in agriculture production. Additionally, there is a significant negative relation between age () and willingness to act (), and between cultivation area () and willingness to act (). In other words, farmers of old age having larger land areas tend to be unwilling to make any changes such as to test soil before fertilization or to reduce fertilizer use, which can be attributed to the limited labour compared with the expected heavy workload.
As to the correlation between the inputs and the output, only two factors (age and cultivated area) are shown to have a significantly negative correlation with the output, i.e., fertilizer use. It means the aged, larger cultivated area owners tend to plan a reduced use of fertilizer. However, as the correlation analysis mainly focuses on identifying the significance of linear relationships, we employed the ANN model and sensitivity analysis to quantify the contributions of factors to the output.
3.3. ANN Model Buiding and Selection
Table 3 presents the performance of the ANNs with different numbers of hidden neurons (from 2 to 10) on their training set (70% of the data), validation set (15%), and testing set (15%). All ANNs stop training when the root mean square error (RMSE) on the validation set increases, which is the sign of overfitting of the training set. We then evaluated the determination coefficient R2 and found that the best neural network is the one with 5 hidden neurons, which also has the lowest RMSE value for the training samples. However, the networks with a range of the neurons between 4 and 6 are also acceptable because their R2 are close to 0.8 in all phases (i.e., training, validating, and testing). It is also found that when increasing the number of hidden neurons beyond 6, the performance on the testing sets becomes unsatisfactory due to overfitting with training data. It should be noted that increasing the number of hidden nodes also leads to the increased complexity of the ANN, resulting in more complex probability calculations and an increased risk of excessive training requirement.
Figure 5 shows the performance (error distribution and regression results) of the optimal ANN with five hidden neurons. It can be observed that the error, which is the difference between the actual fertilizer use and the one modelled by the ANN, is mainly distributed within the range of ±100 kg/hm2 and the fitness on training and validation sets (85% of whole data) is very good with an R2 close to 1.0 (i.e., perfect fit). For the testing results, although they are not as good due to a limited amount of data in the testing set (only 30 data points) that made R2 sensitive to the outliers, they are able to show the utility of the models in predicting a general fertilizer application rate.
3.4. Sensitivity Analysis
Figure 6 presents the sensitivity analysis results, where Figure 6a demonstrates the total and first-order sensitivity indexes of the 8 inputs where the boxplots show the 95% confidence intervals for each factor and the bars show the average values of 15 estimation processes.
It can be observed that:
- The input (cultivated area), which has an averaged total sensitivity index around 0.78, is the most significant input contributing to the variance of fertilizer use, for both its direct effect (indicated by the first-order sensitivity index) and its interactions with other inputs (indicated by the total sensitivity index). This is also consistent with the correlation analysis, which shows a strong linear relation between the cultivated area and the unit fertilizer use. The larger cultivated area leads to a decrease of unit fertilizer use. Moreover, the averaged first-order index of cultivated area also has the highest value (around 0.25) among all inputs, meaning that its interactions with other inputs alone produce more than 50% (0.78 − 0.25 = 0.53) of the total variance of the output.
- The inputs (education level), (annual income), and (awareness) are among the second level of sensitive inputs, with similar direct effects on the variance of fertilizer use, which are 0.03, 0.05, and 0.07, respectively. To show their contributions to the unit fertilizer use by their interactions, we present the second-order sensitivity indexes in Figure 6b, which show that both the interaction between and and that between and not only have a similar contribution to the variance of the output but they are also greater than that between and . This implies that the awareness of environment is closely related to the education level and annual income, and they jointly affect the final decision on fertilizer use. However, the interaction between education level and annual income does not play a significant role.
- The inputs (gender), (age), (attribution of the pollution responsibility), and (willingness to reduce pollution) are insignificant in affecting the variance of the unit fertilizer use. Nevertheless, their total sensitivity indexes are high (although the first-order sensitivity indexes are closed to zero) because of their interactions with .
4. Discussion
Average fertilization levels of an area often ignore the fertilization habits and variable fertilization decision-making among individual farmers, especially in areas lacking scientific agricultural guidance and mechanized farming. In our study area, farmers’ decisions about fertilization are made mainly based on their own judgments. In this study, remarkable differences in fertilization per unit area were found to be correlated with different characteristics of the farmers. The predominantly household-based farming practice in the area with small, isolated farm-lands highlights the fact that decisions of individual households on fertiliser use play a significant role in over fertilization and related water pollution. Fertilizer plays an important role in grain productivity [40], and the use of fertilizer in China is extremely inefficient [41]. In the process of reducing the use of fertilizer, there is a phenomenon of separation of beneficiaries: while the benefits of fertilizer application are direct and tangible to farmers, the beneficiaries of the enormous environmental benefits of reducing the application of fertilizer are not farmers but the public [42], i.e., the environmental effects of fertilizer application are indirect.
The results from the neural network models, along with the sensitivity analysis, show that the cultivated area has the greatest impact on farmers’ fertilization decision-making, followed by farmers’ education level, annual income, and their awareness of environmental pollution. The direct/single contribution of the cultivated area dominates the variance of the unit fertilization, which means the decision-making and judgment of farmers’ fertilization is to a great extent based on their cultivated area. The feasibility of some pathways depends on factors such as farm size and land consolidation [43]. These results are consistent with the studies of Ju (2016) [44] and Lu (2019) [18]. The land transfer and concentration are the only way for agricultural development from smallholder farmers to carry out intensive agriculture [45]. There exist huge differences in management strategies of large farms compared to farms with small cultivated areas for agricultural activities such as planting species, tillage, irrigation and fertilizer management [46]. Farmers with small farm size often encounter more uncertainty in their decision making and hence exhibit more irrational fertilizer behaviors, which also produces an over-fertilization risk in China. Farmers with less farmland may find it more difficult to spread risks across all plots and thus pin their hopes on chemical fertiliser to stabilize crop yields. [47]. In southwest mountain (hill)-based agriculture, it is hard for smallholder farmers to implement mechanization and intensify cultivation [48]. In this study, the size of the land area (average 5.3 hm [2]) held by farmers has a large, negative impact on the rate of fertilization, which may be a key point that is easy to ignore.
Farmers’ educational and cultural backgrounds may limit their understanding of pollution problems [43]. Age, education, farm size, and land fragmentation are the socioeconomic factors influencing farmers’ adoption of eco-friendly fertilization technology [49]. Farmers’ gender and age, perceived responsible party to address pollution, and willingness to reduce pollution show very low contributions to the variance of farmers’ fertilization. In the analysis of the combined sensitivity of factors, the education level, annual income, and awareness of environmental protection are correlated and have a combined effect on the variance of fertilizer use, which is greater than their singular effects. According to the Pearson correlation analysis, the most significant factors affecting farmers’ fertilizer behavior are (cultivated area) and (age), while ANN sensitivity analysis detected that (cultivated area) is the most significant factor, before (education level), (annual income), and (the awareness of environment). Compared with the traditional Pearson correlation analysis, not only the direct effect of single factors but also the synergy among multiple factors can be detected and quantified by applying the proposed ANN sensitivity analysis. For example, the factors of farmers’ education level and their income coming from agriculture production, which fail to be detected by Pearson correlation analysis, are revealed by ANN sensitivity analysis, which is more consistent with our common understanding of fertilizer use behavior, e.g., farmers with higher education level tend to have a relatively good awareness of environmental protection and follow the scientific guidance to use fertilizer to obtain higher crop yields and thereby higher income. Although their single effect on fertilizer use is not as high as (cultivated area), their synergy effects also play an essential role in decision making of fertilizer use.
Generally, agricultural source pollution control policy often includes restrictions on unit area fertilization, products or input factors allowed to be used [50], incentive systems, large-scale use of technology, de-cultivation [51], and other measures. However, it will be hard to implement these measures in our study area because the farmers are too dispersed, their planting area is too small and fragmented, and it is difficult to carry out targeted demonstration. At present, the policy in China is to stimulate straw resource utilization as an alternative to replace chemical fertilizers, and this has become one of the most important policies for reducing the air pollution and increasing soil fertility. Comprehensive utilization efficiency of straw will be up to 85% by applying new advanced technologies [52]. Increasing the application of organic fertilizer and planting green manures are also encouraged by the policy [46]. It is expected that the dependence on fertilizers will be reduced at the source of demand. These policies will have an impact on the fertilization behavior of farmers in the region. Considering the degree of fragmentation of the sloping farmland, it is difficult to achieve land consolidation and to increase the farm size in Three Gorges Reservoir area. Therefore, it is expected that the non-point source pollution will continue to increase in the next few years in the Three Gorges Reservoir area. Although education level of the farmers is not directly related to their economic gain, it helps improve the awareness of the importance of environmental protection and will ultimately help to reasonably reducing fertilizer use. Further studies are expected to reduce the uncertainty in questionnaire-based survey such as conducting consistency analysis, changing presentation of decision-making questions.
5. Conclusions
In this paper, we developed and applied an artificial neural network (ANN) model with an incorporated backpropagation method alongside a variance-based sensitivity analysis to simulate farmers’ fertilizer use in the Three Gorge reservoir area in China, where water pollution caused by over fertilization is a significant issue. We designed and carried out a questionnaire-based survey for collecting the characteristics of 200 local households on three aspects: basic information (gender, age, and education levels) of the farmers, their agricultural and economic situation, the farmers’ attitudes to environmental pollution (e.g., recognition of parties responsible for reducing pollution, awareness of environmental protection), and their willingness to reduce fertilizer use.
The results show that (1) the ANN model with five hidden nodes performs well (overall determination coefficient R2 is 0.776) on simulating fertilizer use based on different characteristics of farmers. (2) According to sensitivity analyses, farmers’ decisions on fertilizer use are mainly determined by the area of cultivated land indicated by its high singular and combined contributions (S = 0.25 and ST = 0.78), followed by farmers’ education level, annual income, and individual awareness of the importance of environmental protection. (3) However, the farmers’ gender and age, their recognition on the responsibility party to pollution, and their willingness to reduce pollution show a lower sensitivity to the variance of unit fertilizer use, indicating a less significant role in affecting fertilizer-use decision-making in comparison with other factors. The findings increase the understanding of the individual decision-making in the peasant economic zone in the middle section of the Three Gorges reservoir area. The methodology proposed in this paper (i.e., ANN, along with a sensitivity analysis) is highlighted for its ability and good performance in simulating such complex social-environmental interactions in the field of (over)fertilization and can be conveniently extended to other areas.
Author Contributions
Conceptualization, L.M. and J.N.; methodology, L.M. and H.W.; validation, L.M., Y.X., and H.W.; formal analysis, Y.X.; investigation, L.M.; resources, L.M.; data curation, L.M. and H.W.; writing—original draft preparation, L.M. and H.W.; writing—review and editing, L.M., J.N., H.W., Y.X., and L.F.; visualization, L.M. and H.W.; supervision, Y.X. and L.F.; project administration, J.N.; funding acquisition, L.M. and J.N. All authors have read and agreed to the published version of the manuscript.
Funding
The study is supported by the grant (data driven and uncertainty analysis of agricultural non-point source for nitrogen and phosphorus pollution) provided by the National Natural Science Foundation of China (Grant 51509214).
Institutional Review Board Statement
Not applicable.
Informed Consent Statement
Not applicable.
Conflicts of Interest
The authors declare no conflict of interest. The funders had no role in the design of the study; in the collection, analyses, or interpretation of data; in the writing of the manuscript; or in the decision to publish the results.
References
- Albornoz, F. Crop Responses to Nitrogen Overfertilisation: A Review. Sci. Hortic. 2016, 205, 79–83. [Google Scholar] [CrossRef]
- Gourevitch, J.D.; Keeler, B.L.; Ricketts, T.H. Determining Socially Optimal Rates of Nitrogen Fertilizer Application. Agric. Ecosyst. Environ. 2018, 254, 292–299. [Google Scholar] [CrossRef]
- Kopittke, P.M.; Menzies, N.W.; Wang, P.; McKenna, B.A.; Lombi, E. Soil and the Intensification of Agriculture for Global Food Security. Environ. Int. 2019, 132, 105078. [Google Scholar] [CrossRef] [PubMed]
- Liu, M.; Zhang, W.; Wang, X.; Wang, F.; Dong, W.; Hu, C.; Sun, R. Nitrogen Leaching Greatly Impacts Bacterial Community and Denitrifiers Abundance in Subsoil under Long-term fertilisation. Agric. Ecosyst. Environ. 2020, 294, 106885. [Google Scholar] [CrossRef]
- FAO. Statistical Pocketbook 2015: World Food and Agriculture; FAO: Rome, Italy, 2015. [Google Scholar]
- Li, H.; Wang, L.; Li, J.; Gao, M.; Zhang, J.; Zhang, J.; Frolking, S. The Development of China-DNDC and Review of Its Applications for Sustaining Chinese Agriculture. Ecol. Model. 2017, 348, 1–13. [Google Scholar] [CrossRef] [Green Version]
- Choe, S.; Kim, S.; Jun, Y.; Lee, W.; Kang, I.; Koong, M.; Park, D. Ambient Air Pollution is Associated with Success of in vitro Fertilisation Cycles: A Retrospective Study in Seoul, Korea. Fertil. Steril. 2017, 108, e325. [Google Scholar] [CrossRef]
- Shi, N.; Zhang, Y.; Li, Y.; Luo, J.; Gao, X.; Jing, Y.; Bo, L. Water Pollution Risk from Nitrate Migration in the Soil Profile as Affected by Fertilisation in a Wheat-maize Rotation System. Agric. Water Manag. 2018, 210, 124–129. [Google Scholar] [CrossRef]
- Mao, C.; Zhai, N.; Yang, J.; Feng, Y.; Cao, Y.; Han, X.; Meng, Q. Environmental Kuznets Curve Analysis of the Economic Development and Nonpoint Source Pollution in the Ningxia Yellow River Irrigation Districts in China. BioMed Res. Int. 2013. [Google Scholar] [CrossRef]
- Zhang, W. Estimation and Control Countermeasures of Pollution Situation in China’s Agricultural Surface Sources I. Estimates of Pollution from Agricultural Sources in China at the Beginning of the 21st Century. China Agric. Sci. 2004, 37, 1008–1017. (In Chinese) [Google Scholar]
- Yang, B.; Yin, K.; Xiao, T.; Chen, L.; Du, J. Annual Variation of Landslide Stability under the Effect of Water Level Fluctuation and Rainfall in the Three Gorges Reservoir, China. Environ. Earth Sci. 2017, 76, 564. [Google Scholar] [CrossRef]
- Deng, C. Study on the Denutrientization of the Three Gorges Reservoir Area; China Environmental Science Press: Beijing, China, 2007. (In Chinese) [Google Scholar]
- Wu, L. The Migration and Transformation of Nitrogen Phosphorus and Pesticide Non-point-source Pollutants and Trends in the Typical Area of the Three Gorges Reservoir Area with the Hydro-Process. Ph.D. Thesis, Chongqing University, Chongqing, China, 2012. (In Chinese). [Google Scholar]
- Freeman, H.A.; Omiti, J.M. Fertilizer Use in Semi-arid Areas of Kenya: Analysis of Smallholder Farmers’ Adoption Behavior under Liberalized Markets. Nutr. Cycl. Agroecosystems 2003, 66, 23–31. [Google Scholar] [CrossRef]
- Tian, W.H.; Chen, R.Y. Analysis of the Factors Influencing the Environmental Awareness of Rural Residents in Gansu Province–Based on Age, Gender and Cultural Level. Resour. Environ. Arid Areas 2013, 27, 33–39. (In Chinese) [Google Scholar]
- Zeng, W.J. Analysis Ecological Compensation of Chemical Fertilizer Reduction Based on the Willingness of Farmers. Ph.D. Thesis, Kunming University of Technology, Kunming, China, 2014. [Google Scholar]
- Zhang, L.G. Analysis on the Behavior of Farmers in Environmentally Friendly Agricultural Production–An Empirical Analysis Based on 278 Questionnaires of Farmers in Jiangxi Province. Agric. Technol. Econ. 2011, 6, 114–120. (In Chinese) [Google Scholar]
- Lu, H.; Zhang, P.; Hu, H.; Xie, H.; Yu, Z.; Chen, S. Effect of the Grain-growing Purpose and Farm Size on the Ability of Stable Land Property Rights to Encourage Farmers to Apply Organic Fertilizers. J. Environ. Manag. 2019, 251, 109621. [Google Scholar] [CrossRef] [PubMed]
- Hoffmann, M.P.; Cock, J.; Samson, M.; Janetski, N.; Janetski, K.; Rötter, R.P.; Oberthür, T. Fertilizer Management in Smallholder Cocoa Farms of Indonesia under Variable Climate and Market Prices. Agric. Syst. 2020, 178, 102759. [Google Scholar] [CrossRef]
- Martey, E.; Kuwornu, J.K.; Adjebeng-Danquah, J. Estimating the Effect of Mineral Fertilizer Use on Land Productivity and Income: Evidence from Ghana. Land Use Policy 2019, 85, 463–475. [Google Scholar] [CrossRef]
- Adamowski, J.; Fung Chan, H.; Prasher, S.O.; Ozga-Zielinski, B.; Sliusarieva, A. Comparison of Multiple Linear and Nonlinear Regression, Autoregressive Integrated Moving Average, Artificial Neural Network, and Wavelet Artificial Neural Network Methods for Urban Water Demand Forecasting in Montreal, Canada. Water Resour. Res. 2012, 48, W01528. [Google Scholar] [CrossRef]
- Nesme, T.; Lescourret, F.; Bellon, S.; Habib, R. A Modelling Approach to Explore Nitrogen Fertilisation Practices of Growers and Their Consequences in Apple Orchards. Agric. Syst. 2009, 99, 76–85. [Google Scholar] [CrossRef]
- Zhang, B.; Tillman, R. A Decision Tree Approach to Modelling Nitrogen Fertiliser Use Efficiency in New Zealand Pastures. Plant Soil 2007, 301, 267–278. [Google Scholar] [CrossRef]
- Zarra, T.; Galang, M.G.; Ballesteros Jr, F.; Belgiorno, V.; Naddeo, V. Environmental Odour Management by Artificial Neural Network–A Review. Environ. Int. 2019, 133, 105189. [Google Scholar] [CrossRef]
- Bekaert, G.; Hoerova, M.; Lo Duca, M. Risk, Uncertainty and Monetary Policy. J. Monet. Econ. 2013, 60, 771–788. [Google Scholar] [CrossRef] [Green Version]
- McEvoy, P.M.; Hyett, M.P.; Shihata, S.; Price, J.E.; Strachan, L. The Impact of Methodological and Measurement Factors on Transdiagnostic Associations with Intolerance of Uncertainty: A Meta-analysis. Clin. Psychol. Rev. 2019, 73, 101778. [Google Scholar] [CrossRef]
- Pisoni, E.; Albrecht, D.; Mara, T.A.; Rosati, R.; Tarantola, S.; Thunis, P. Application of Uncertainty and Sensitivity Analysis to the Air Quality SHERPA Modelling Tool. Atmos. Environ. 2018, 183, 84–93. [Google Scholar] [CrossRef]
- Ding, E.J. Optimization of Land Use for Agricultural Non-point Source Pollution Control in Three Gorges Reservoir Area. Ph.D. Thesis, Southwest University, Chongqing, China, 2010. [Google Scholar]
- Jordan, M.I.; Mitchell, T.M. Machine Learning: Trends, Perspectives, and Prospects. Science 2015, 349, 255–260. [Google Scholar] [CrossRef] [PubMed]
- Wang, S.C. Artificial Neural Network. In Interdisciplinary Computing in Java Programming; Springer: Boston, MA, USA, 2003; pp. 81–100. [Google Scholar]
- Anthony, M.; Bartlett, P.L. Neural Network Learning: Theoretical Foundations; Cambridge University Press: Cambridge, UK, 2009. [Google Scholar]
- Wanto, A.; Windarto, A.P.; Hartama, D.; Parlina, I. Use of Binary Sigmoid Function and Linear Identity in Artificial Neural Networks for Forecasting Population Density. Int. J. Inf. Syst. Technol. 2017, 1, 43–54. [Google Scholar] [CrossRef] [Green Version]
- Lalis, J.; Gerardo, B.; Byun, Y. An Adaptive Stopping Criterion for Backpropagation Learning in Feedforward Neural Network. Int. J. Multimed. Ubiquitous Eng. 2014, 9, 149–156. [Google Scholar] [CrossRef]
- Fahlman, S.E. An Empirical Study of Learning Speed in Back-propagation Networks; Carnegie Mellon University, Computer Science Department: Pittsburgh, PA, USA, 1998. [Google Scholar]
- Zeiler, M.D. Adadelta: An Adaptive Learning Rate Method. arXiv 2012, arXiv:1212.5701. [Google Scholar]
- Bailey, D.; Thompson, D. How to Develop Neural-network Applications. AI Expert 1990, 5, 38–47. [Google Scholar]
- Masters, T. Advanced Algorithms for Neural Networks: A C++ Sourcebook; John Wiley & Sons: New York, NY, USA, 1995. [Google Scholar]
- Sobol, I.M. Global Sensitivity Indices for Nonlinear Mathematical Models and Their Monte Carlo Estimates. Math. Comput. Simul. 2001, 55, 271–280. [Google Scholar] [CrossRef]
- Lemieux, C. Monte-Carlo and Quasi-Monte Carlo Sampling; Springer Science & Business Media: Berlin/Heidelberg, Germany, 2009. [Google Scholar]
- Yousaf, M.; Li, J.; Lu, J.; Ren, T.; Cong, R.; Fahad, S.; Li, X. Effects of Fertilization on Crop Production and Nutrient-supplying Capacity under Rice-oilseed Rape Rotation System. Sci. Rep. 2017, 7, 1–9. [Google Scholar] [CrossRef]
- Cui, K.; Shoemaker, S.P. A Look at Food Security in China. Sci. Food 2018, 2, 4. [Google Scholar] [CrossRef] [PubMed] [Green Version]
- Udvardi, M.; Brodie, E.L.; Riley, W.; Kaeppler, S.; Lynch, J. Impacts of Agricultural Nitrogen on the Environment and Strategies to Reduce These Impacts–ScienceDirect. Procedia Environ. Sci. 2015, 29, 303. [Google Scholar] [CrossRef] [Green Version]
- Stringer, L.C.; Fraser, E.D.; Harris, D.; Lyon, C.; Pereira, L.; Ward, C.F.; Simelton, E. Adaptation and Development Pathways for Different Types of Farmers. Environ. Sci. Policy 2020, 104, 174–189. [Google Scholar] [CrossRef]
- Ju, X.; Gu, B.; Wu, Y.; Galloway, J.N. Reducing China’s Fertilizer Use by Increasing Farm Size. Glob. Environ. Chang. 2016, 41, 26–32. [Google Scholar] [CrossRef]
- Yuneng, D.; Bo, S. The Development of Chinese Agricultural Land Transfer System: Transaction, Concentration and Commercialization. J. Agric. Sci. 2011, 3, 269. [Google Scholar] [CrossRef]
- Xu, H.; Huang, X.; Zhong, T.; Chen, Z.; Yu, J. Chinese Land Policies and Farmers’ Adoption of Organic Fertilizer for Saline Soils. Land Use Policy 2014, 38, 541–549. [Google Scholar] [CrossRef]
- Zhang, Y.; Long, H.; Wang, M.Y.; Li, Y.; Ma, L.; Chen, K.; Zheng, Y.; Jiang, T. The Hidden Mechanism of Chemical Fertiliser Overuse in Rural China. Habitat Int. 2020, 102, 102210. [Google Scholar] [CrossRef]
- Jian, C.; Shi, J.; Li, Y. Present Status and Developing Strategy of Agricultural Mechanization in Southwest China. Trans. Chin. Soc. Agric. Eng. 2003. [Google Scholar]
- Qi, X.; Liang, F.; Yuan, W.; Zhang, T.; Li, J. Factors Influencing Farmers’ Adoption of Eco-friendly Fertilization Technology in Grain Production: An Integrated Spatial–econometric Analysis in China. J. Clean. Prod. 2021, 127536. [Google Scholar] [CrossRef]
- Dowd, B.M.; Press, D.; Huertos, M.L. Agricultural Nonpoint Source Water Pollution Policy: The Case of California’s Central Coast. Agric. Ecosyst. Environ. 2008, 128, 151–161. [Google Scholar] [CrossRef]
- Tian, Y.; Huang, Z.; Xiao, W. Reductions in Non-point Source Pollution through Different Management Practices for an Agricultural Watershed in the Three Gorges Reservoir Area. J. Environ. Sci. 2010, 22, 184–191. [Google Scholar] [CrossRef]
- Ministry of Agriculture of the People’s Republic of China (MOA). China’s 13th Five-Year Agricultural Scientific and Technological Plan. Available online: http://www.moa.gov.cn/sjzz/kjs/dongtai/201703/t201703105514395.htm (accessed on 21 May 2021). (In Chinese)
Figure 1.
Location of the study area in the Three-Gorges Reservoir Area (photo insert: local topography and field work in spring).
Figure 1.
Location of the study area in the Three-Gorges Reservoir Area (photo insert: local topography and field work in spring).

Figure 2.
The workflow of the study.

Figure 3.
Architecture of ANN network with the input, hidden, and output layers, where AF is the shorthand notation for activation function.
Figure 3.
Architecture of ANN network with the input, hidden, and output layers, where AF is the shorthand notation for activation function.

Figure 4.
(a) Basic info of the respondents; (b) respondents’ awareness of environment pollution, perceived responsible party for pollution reduction, and willingness to take action.
Figure 4.
(a) Basic info of the respondents; (b) respondents’ awareness of environment pollution, perceived responsible party for pollution reduction, and willingness to take action.

Figure 5.
The performance of the best selected ANN: (a) the distribution of Error, which indicates the difference between modelled and observed fertilizer uses with 5 hidden nodes; (b) the regression results on training set, validation set, testing set, and general view.
Figure 5.
The performance of the best selected ANN: (a) the distribution of Error, which indicates the difference between modelled and observed fertilizer uses with 5 hidden nodes; (b) the regression results on training set, validation set, testing set, and general view.

Figure 6.
(a) The total and first-order sensitivity indexes of the ANN 8 inputs; (b) the secondary-order sensitivity indexes of three combined inputs , and .
Figure 6.
(a) The total and first-order sensitivity indexes of the ANN 8 inputs; (b) the secondary-order sensitivity indexes of three combined inputs , and .


Table 1.
Household characteristics addressed in the questionnaire and their quantification.
| Factor | Description | Levels | Numerical Representation |
|---|---|---|---|
| Gender | Female | 0 | |
| Male | 1 | ||
| Age | From 20 to 30 | 1 | |
| From 30 to 40 | 2 | ||
| From 40 to 50 | 3 | ||
| From 50 to 60 | 4 | ||
| Over 60 | 5 | ||
| Highest education level | Up to Primary School | 1 | |
| Secondary school | 2 | ||
| High school | 3 | ||
| Above high school | 4 | ||
| Cultivated area | In the range of (0.3, 40) | Actual value in hm2 | |
| Annual income | In the range of (1, 120) | Actual value in 1000 Yuan | |
| Who do you think has the responsibility for pollution reduction? | Only local government | 1 | |
| Only industrial companies | 2 | ||
| Only individuals | 3 | ||
| Both local government and industrial companies | 4 | ||
| Both local government and individuals | 5 | ||
| Both industrial companies and individuals | 6 | ||
| All three parties should take care | 7 | ||
| Others | 0 | ||
| Willingness to act | Reduce fertilizer use | 1 | |
| Test soil fertilisation | 2 | ||
| Both | 3 | ||
| None | 0 | ||
| Strategy to address environmental issues | Need for pollution control through government action | 1 | |
| Individual plays an essential role | 2 | ||
| Both | 3 | ||
| None | 0 | ||
| Fertilizer use | Fertilizer use planned for next year with explanation on the choice of type of fertilizer and method to use it | Actual value in kg·hm−2 |
Table 2.
Descriptive statistics of the input variables and the correlation coefficients between the input and output variables.
Table 2.
Descriptive statistics of the input variables and the correlation coefficients between the input and output variables.
| X1 | X2 | X3 | X4 | X5 | X6 | X7 | X8 | Y | |
|---|---|---|---|---|---|---|---|---|---|
| X1 | 1 | 0.158 ** (0.025) | 0.273 ** (0) | 0.144 ** (0.043) | 0.048 (0.495) | 0.043 (0.550) | −0.041 (0.569) | −0.046 (0.519) | −0.131 * (0.064) |
| X2 | - | 1 | −0.218 ** (0.002) | −0.050 (0.484) | −0.124 * (0.081) | 0 (0.994) | −0.142 ** (0.045) | −0.058 (0.414) | −0.162 ** (0.022) |
| X3 | - | - | 1 | 0.149 ** (0.036) | 0.088 (0.218) | 0.010 (0.893) | 0.024 (0.735) | −0.052 (0.465) | −0.020 (0.781) |
| X4 | - | - | - | 1 | 0.465 ** (0) | 0.133 * (0.060) | −0.179 ** (0.011) | −0.036 (0.609) | −0.262 ** (0) |
| X5 | - | - | - | - | 1 | −0.049 (0.487) | −0.047 (0.511) | −0.042 (0.556) | −0.069 (0.334) |
| X6 | - | - | - | - | - | 1 | −0.049 (0.494) | −0.011 (0.876) | −0.135 * (0.056) |
| X7 | - | - | - | - | - | - | 1 | 0.129 * (0.069) | −0.051 (0.476) |
| X8 | - | - | - | - | - | - | - | 1 | 0.069 (0.333) |
| Y | - | - | - | - | - | - | - | - | 1 |
Note: * and ** stand for significance levels p < 0.05 and p < 0.01, respectively.
Table 3.
Performance of ANN with different number of hidden nodes on training, validation, and testing sets, which is presented by R2 and RMSE.
Table 3.
Performance of ANN with different number of hidden nodes on training, validation, and testing sets, which is presented by R2 and RMSE.
| Number of Hidden Neurons | Training (70%) | Validation (15%) | Testing (15%) | |||
|---|---|---|---|---|---|---|
| R2 | RMSE | R2 | RMSE | R2 | RMSE | |
| 2 | 0.673 | 236.68 | 0.478 | 298.65 | 0.690 | 271.38 |
| 3 | 0.753 | 206.40 | 0.749 | 247.60 | 0.344 | 325.60 |
| 4 | 0.739 | 221.55 | 0.818 | 222.05 | 0.255 | 202.46 |
| 5 | 0.819 | 181.78 | 0.809 | 206.60 | 0.540 | 172.37 |
| 6 | 0.751 | 209.54 | 0.761 | 203.92 | 0.804 | 237.75 |
| 7 | 0.704 | 246.66 | 0.437 | 230.83 | 0.327 | 290.76 |
| 8 | 0.763 | 224.44 | 0.698 | 216.27 | 0.512 | 207.58 |
| 9 | 0.779 | 201.68 | 0.602 | 301.68 | 0.138 | 379.47 |
| 10 | 0.773 | 204.14 | 0.658 | 299.38 | 0.277 | 455.33 |
Publisher’s Note: MDPI stays neutral with regard to jurisdictional claims in published maps and institutional affiliations. |
© 2021 by the authors. Licensee MDPI, Basel, Switzerland. This article is an open access article distributed under the terms and conditions of the Creative Commons Attribution (CC BY) license (https://creativecommons.org/licenses/by/4.0/).
Share and Cite
MDPI and ACS Style
Ma, L.; Ni, J.; Fleskens, L.; Wang, H.; Xuan, Y. Modelling Fertilizer Use in Relation to Farmers’ Household Characteristics in Three Gorges Reservoir Area, China. Agriculture 2021, 11, 472. https://doi.org/10.3390/agriculture11060472
AMA Style
Ma L, Ni J, Fleskens L, Wang H, Xuan Y. Modelling Fertilizer Use in Relation to Farmers’ Household Characteristics in Three Gorges Reservoir Area, China. Agriculture. 2021; 11(6):472. https://doi.org/10.3390/agriculture11060472
Chicago/Turabian StyleMa, Lihua, Jiupai Ni, Luuk Fleskens, Han Wang, and Yunqing Xuan. 2021. "Modelling Fertilizer Use in Relation to Farmers’ Household Characteristics in Three Gorges Reservoir Area, China" Agriculture 11, no. 6: 472. https://doi.org/10.3390/agriculture11060472
Note that from the first issue of 2016, this journal uses article numbers instead of page numbers. See further details here.