
Design of a Flow Visualisation Framework

Department of Computer Science, Swansea University, Swansea, SA2 8PP, Wales, UK
*
Author to whom correspondence should be addressed.
Computers 2015, 4(1), 24-38; https://doi.org/10.3390/computers4010024
Submission received: 13 August 2014
/
Accepted: 25 February 2015
/
Published: 13 March 2015
Abstract
:Research software often consists of individual, isolated prototype applications. Small proof of concept applications are usually enough for demonstrating new algorithms. However, the unification of new research algorithms into a cohesive software framework has advantages. Adding new features to an existing pipeline reduces implementation overhead. The researcher is more able to compare and contrast existing or previous work with new research. Utilizing previously implemented techniques, researchers are able to combine visualization options in new ways that typical research prototypes cannot. The software application can be made available to the domain expert for evaluation and future use. These goals are in part realized by utilizing recent advancements in game design technology and by leveraging features available with recent graphics hardware. Described is the design of a feature-rich flow visualization software framework in more detail than a typical research paper. In contrast to most research prototypes, the system we present handles real-world simulation datasets by interfacing directly with the commercial package called tecplot. We present a description of our system in detail, whereas previously published work focuses on the research contribution. The effectiveness and scalability of the approach is also discussed.
1. Introduction
Computational fluid dynamics (CFD) is a rapidly developing tool for fluid analysis [1]. With wide reaching industrial applications, such as automotive, aerospace, weather and medical, it is an increasingly important software application used to speed up the design process while reducing costs. With increasing data complexity and size, the ability of the user to interpret the CFD results becomes increasingly difficult. Post processing software aims to alleviate this challenge by providing visualization methods for the evaluation and correlation of simulation results. Our visualizations include the latest state-of-the-art flow visualization techniques. Bridging the gap between current visualization software techniques and the latest research techniques is an important goal of our work.
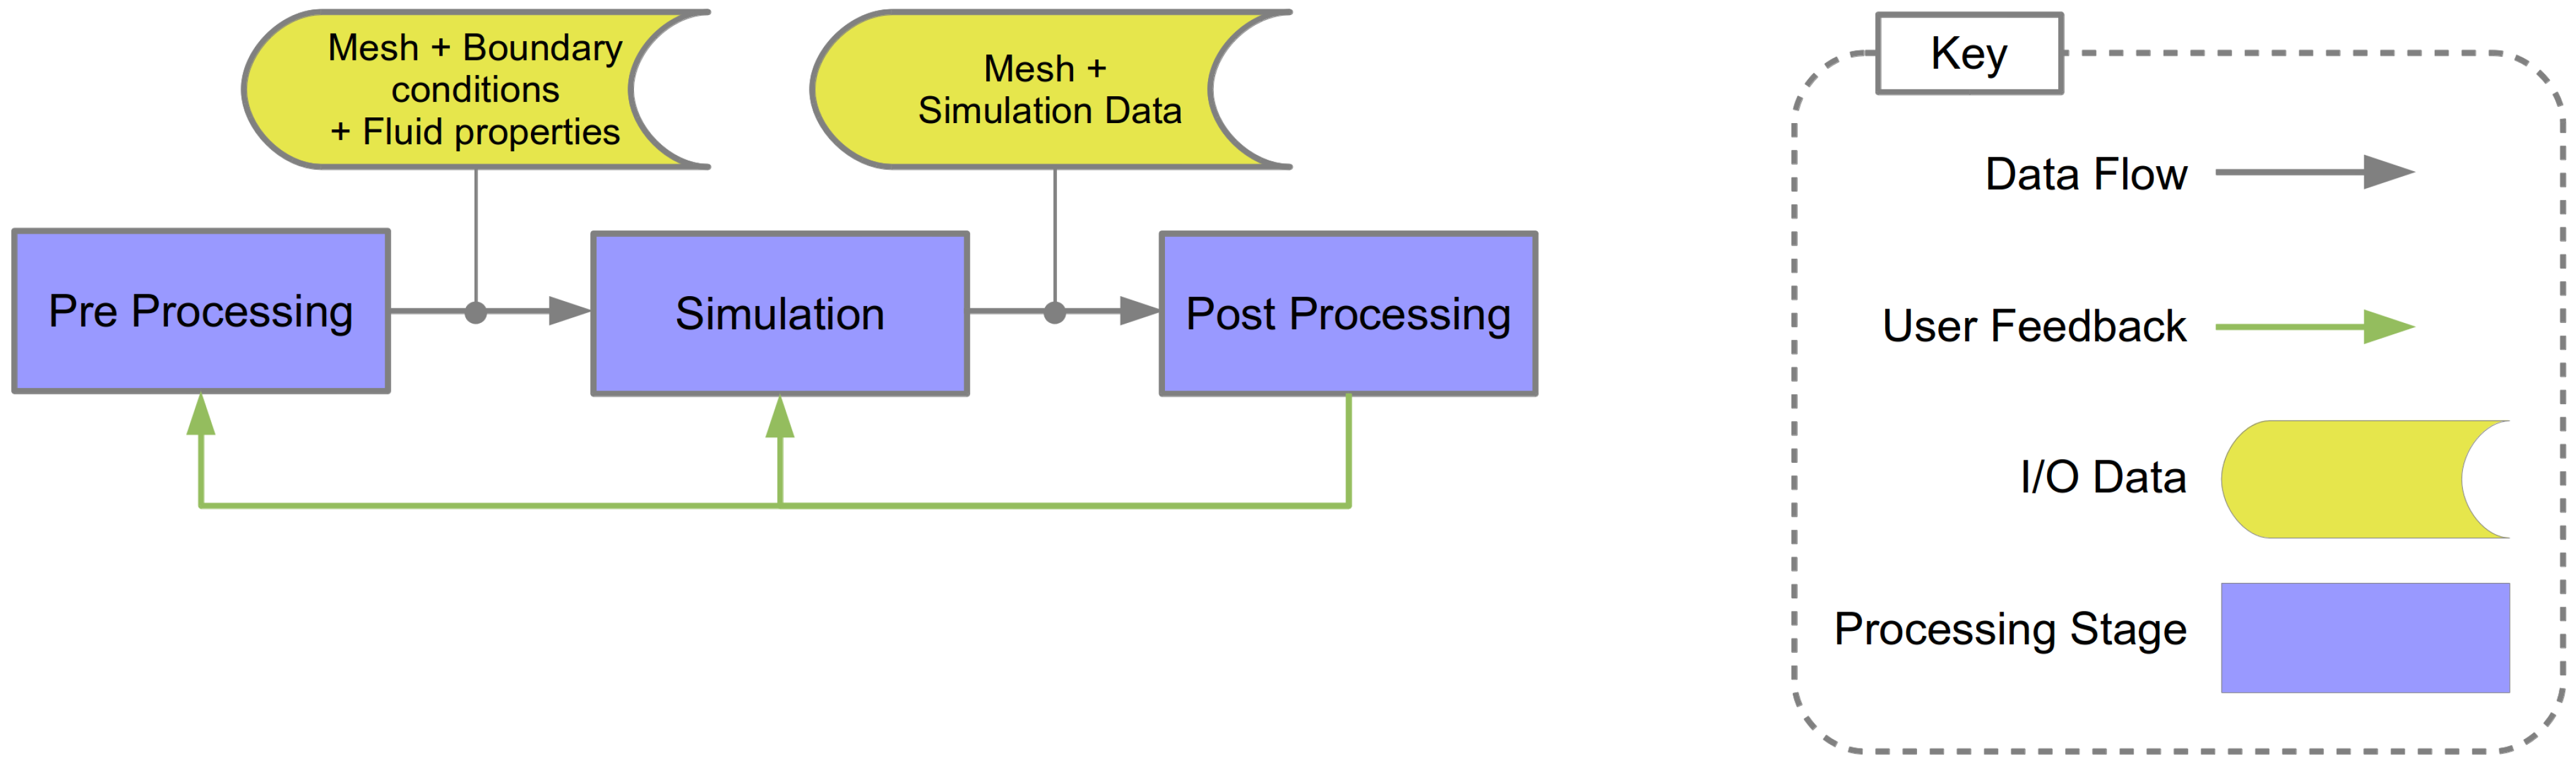
Illustrated in Figure 1 is the CFD simulation pipeline which highlights the inputs, outputs and processing steps. This process is described in three stages:
- (1)
- Preprocessing: A surface and the volumetric mesh is generated to model a physical object. This mesh is generated from computer-aided design (CAD) geometry utilizing mesh generation and manipulation tools. Boundary conditions and fluid properties are defined and specified.
- (2)
- Simulation: A computational simulation of the fluid is performed using numerical methods applied to the mesh, with respect to the boundary conditions and fluid properties.
- (3)
- Post Processing: The simulation result is explored, analyzed and visualized using a range of techniques dependent on the requirements of the CFD engineer.
Figure 1.
The computational fluid dynamics (CFD) simulation pipeline is comprised of a preprocessing stage, the simulation stage and the post-processing stage. This illustration shows the inputs and outputs of each stage and highlights where the different tasks reside.
Figure 1.
The computational fluid dynamics (CFD) simulation pipeline is comprised of a preprocessing stage, the simulation stage and the post-processing stage. This illustration shows the inputs and outputs of each stage and highlights where the different tasks reside.

In order to present a visualization toolkit that is capable of dealing with large simulation data and complex algorithms, a comprehensive and versatile visualization framework is needed. It is the focus of this chapter to describe the design and implementation of a state-of-the-art flow visualization framework that provides scientists and engineers with effective solutions for the visualization of CFD simulation data. By drawing on recent developments in the game and graphics card hardware industry and by combining several scientific visualization techniques, our visualization framework yields the following benefits:
- A platform independent flexible framework, which implements state of the art research algorithms in flow visualization. In particular, stream surface seeding algorithms are incorporated, which were not available in previous systems, such as the VTK or Visit [2].
- A framework specifically designed to enable quick integration of new algorithms for study, testing and evaluation.
- A smooth and efficient threaded user interface, even when processing large data and complex algorithms.
- Simultaneous comparisons of different techniques.
What we have developed is a novel research prototype for flow visualization. However, unlike most prototypes, it interfaces directly with commercial software. Thus, it combines the best of both worlds: state-of-the-art flow visualization with commercial-grade datasets. The visualizations are novel for flow and also offer fast performance. The flow visualization techniques are more current then previous systems such as the VTK or Para-view [2]. What we present here are the design and implementation considerations for our software. The information necessary to implement these features is missing from our previous papers [3,4] because of the strict focus on visualization and space limitations. Furthermore, to see performance details, for example how our software performs compared to previous systems, we refer the reader to Edmunds et al. [3,4].
2. System Overview
In this section we start by discussing some design and implementation related work. We then provide an overview of our application framework and related subsystems. Laramee et al. [5] describe the design and implementation of a flow visualization subsystem which utilizes the geometric and texture-based flow visualization techniques.
In order to guarantee the quick responsiveness for user interaction, even when dealing with large data, Piringer et al. [6] present a generic multi-threading architecture, which enables early cancellation of the visualization thread due to user interaction without the common pitfalls of multi-threading. They also present an interactive visualization toolkit, HyperMoVal [7], as an implementation of this architecture in practice.
McLoughlin and Laramee [8] describe a flow visualization software framework that offers a rich set of features. Their application also serves as a basis for the implementation and evaluation of new algorithms. The application is easily extendable and provides a clean interface for the addition of new modules. Peng et al. [9] present a multi-linked framework that provides customized visualization techniques for engineers to gain a fast overview and intuitive insight into the flow past the marine turbine.
Our software application system is divided into three main subsystems; the GUI, the Logic and the Services. See Figure 2. We divide the system into smaller, easier to maintain subsystems using logical groupings of similar functionality. The GUI subsystem is responsible for capturing the user input for computing a visualization, displaying the resultant visualization and supporting user interaction with the visualization. The Logic subsystem encapsulates the algorithms used to compute the visualizations. This subsystem processes the input data as specified by the user and computes the visualization based on the given user input parameters and selected algorithm. Providing a central point of storage for input and derived data is the service subsystem.
Figure 2.
This top level overview of the system shows three main subsections of the software application framework. The GUI subsystem provides the user interface and all associated user interaction and feedback. The logic subsystem encapsulates the processing aspects of the framework. The services subsystem provides system-wide services for use by the other subsystems.

Another feature of our framework is the Visualization Object (VO). The VO is an encapsulating aggregate of all the elements of an individual feature or individual algorithm. Some examples of features are: interaction VOs, which encapsulate the interaction with the visualization, e.g., panning, zooming and rotating; color map VOs, encapsulating color map functionality; stream surface VOs, which encapsulate the stream surface generation algorithms [10].
For each VO within our framework, there is an associated frame object (FO); an interface for encapsulating the I/O with the VO. This design approach creates a simple interface for adding new functionality quickly and easily. We further discuss VOs and FOs within our application, along with the detailed description of the structure of our framework in Section 3, Section 4 and Section 5.
3. GUI Subsystem Design
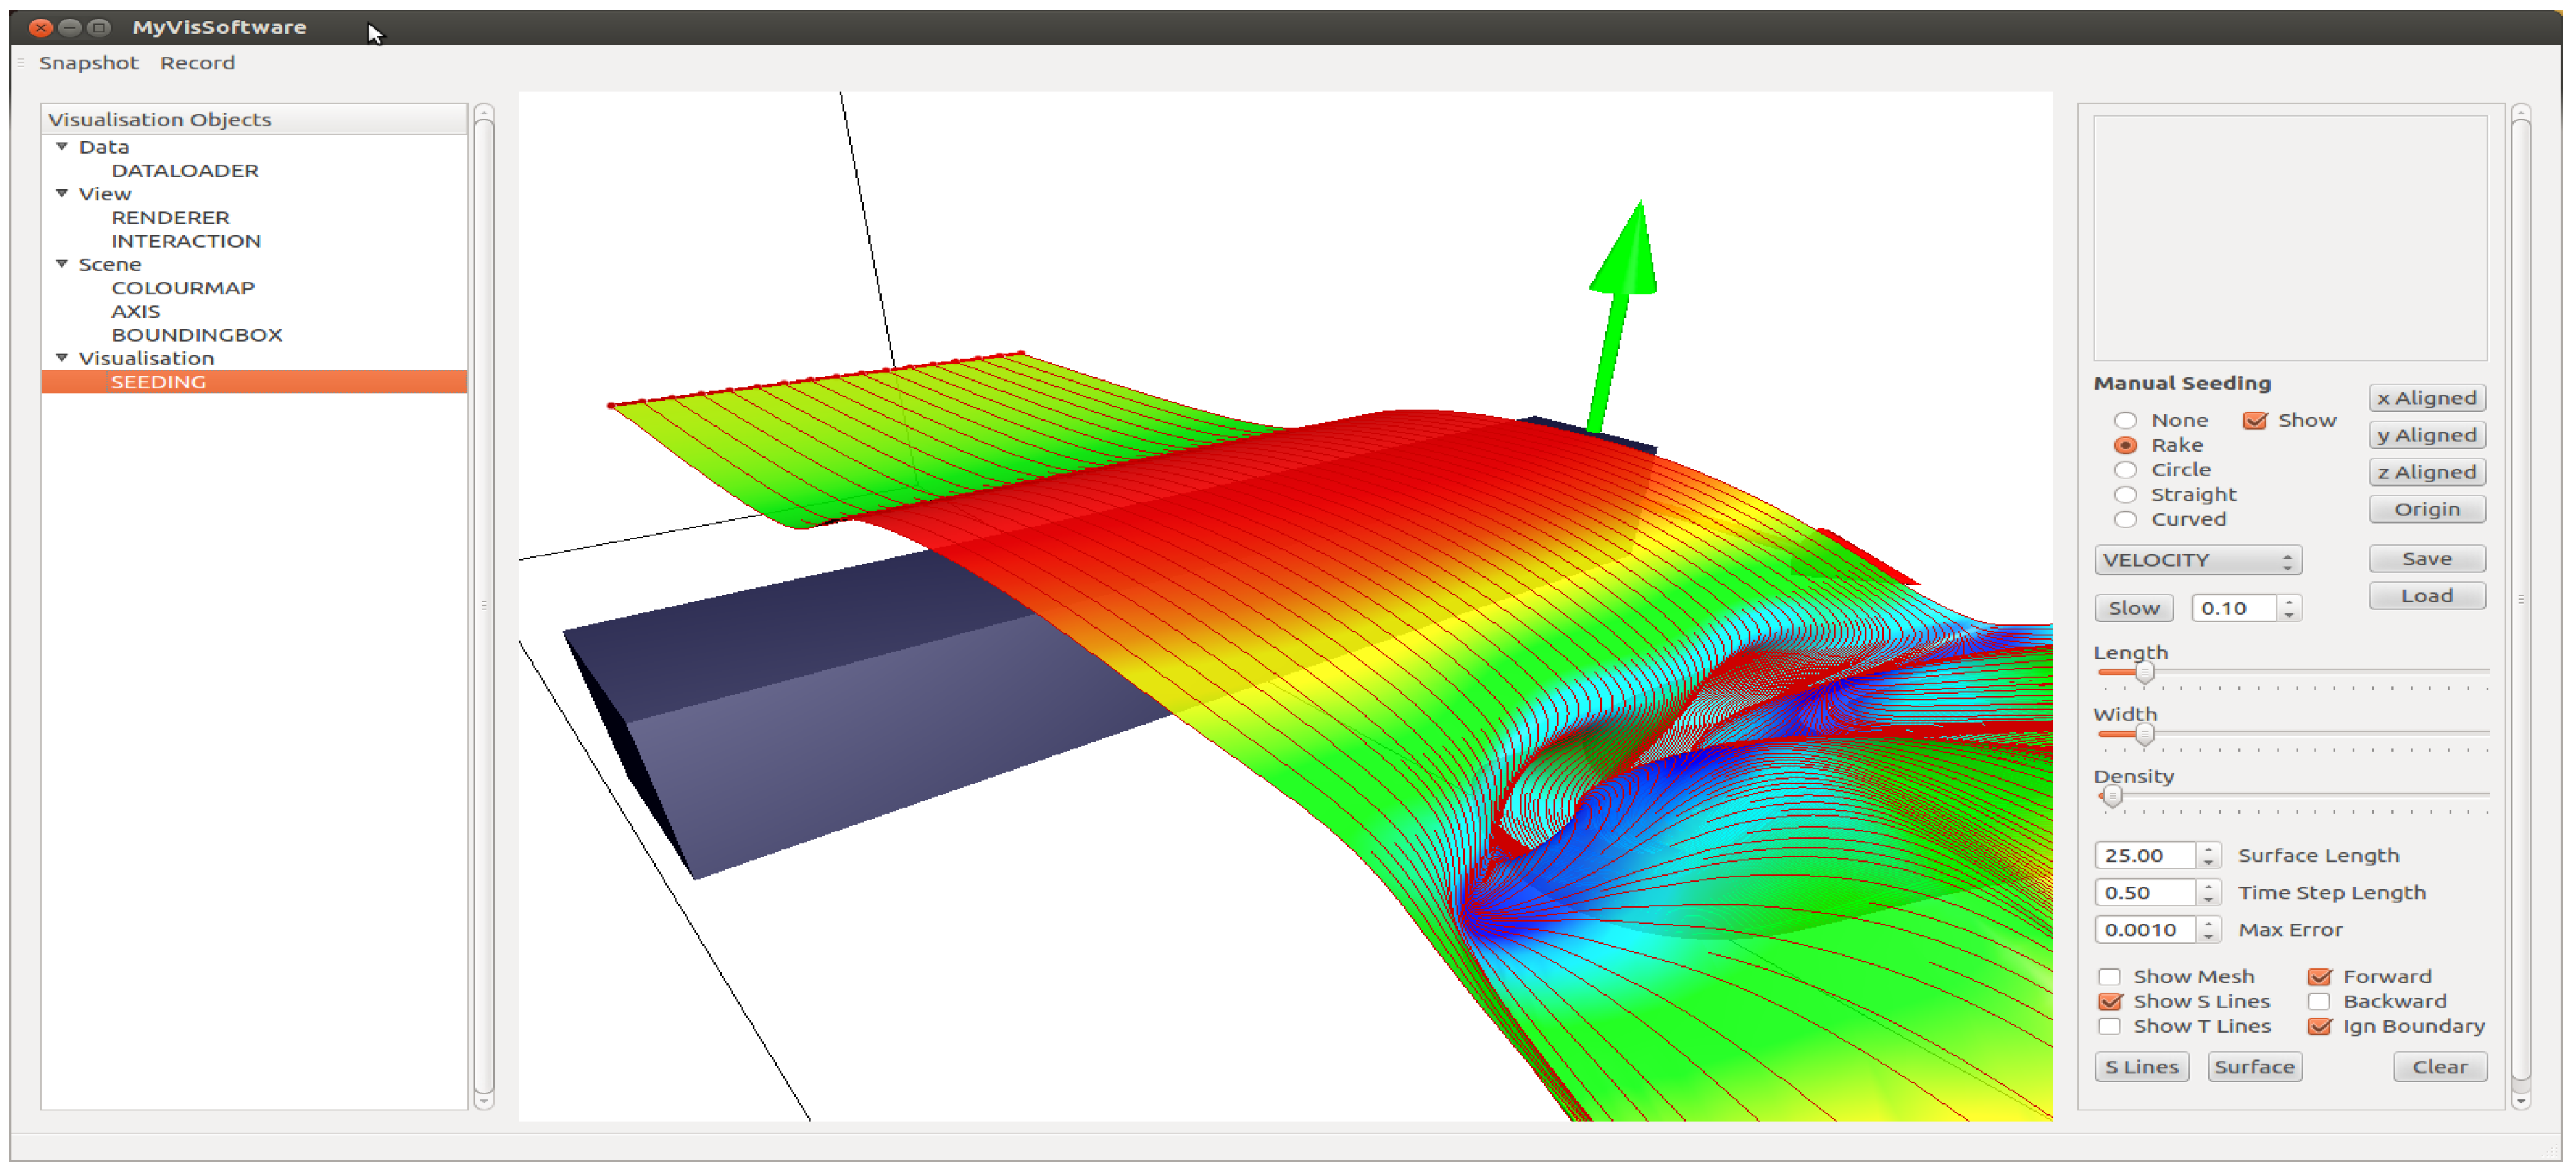
The GUI, shown in Figure 3, is divided into three main frames. The centre frame for rendering the current list of VOs, the left frame for listing the current VOs and the right frame area, which displays the FO for the currently selected VO and lists the VO’s currently available options; refer to Figure 3.
VOs are added by right mouse clicking the parent VO category and selecting the required VO from the drop-down menu. The VO categories (data, view, scene, visualization) can be seen in the left frame of Figure 3. Right mouse clicking a VO in the list enables the user to delete it. Left mouse click the listed VO and its associated FO is displayed in the right frame area. The FO lists the attributes of the VO that can be manipulated. In Figure 3, the selected VO is a seeding object. The right frame displays the the options available to the seeding object. At the top of this FO, a track pad is available for seeding curve manipulation; under this, we can specify type and size. We can save and load previously specified seeding curves. At the bottom of this FO, we have options for the generation of stream surfaces.
Figure 3.
This illustration shows the layout of the user interface.

Once we add the required VOs and set FO options, we can see the results rendered in the centre frame. Interaction with the visualization is achieved using the mouse. For example: to pan, press, hold and drag the right mouse button; to zoom, press, hold and drag the left mouse button; to rotate the view, press, hold and drag the left and right mouse buttons together.
Each of the three frames within the interface run their actions in separate threads. This allows continued interaction with the interface (such as panning and rotation of the visualization), while waiting for lengthy processes and computations (such as loading large datasets) to finish. As a result of our design approach, the application of thread locks to specific VOs is trivial [11].
4. Services Subsystem Design
Some objects in an application can end up communicating with almost all other objects within the code base. It is difficult to find a component of our application that does not need access to objects which encapsulate either input or derived data at some point. Other examples are objects which encapsulate color maps or OpenGL rendering. A method of accessing these objects via interfaces is also desirable. The interface can allow swapping of a given object for an alternative or allow intermediate objects to be installed, which can perform additional tasks, such as logging. Systems like these can be thought of as services that need to be available to the entire application.
The service locator design pattern [12,13,14] is used to meet these requirements in our application. The service locator pattern decouples code that needs a service from both who it is (the concrete implementation type) and where it is (how we get to the instance of it). The service subsystem utilizes the service locator design pattern to provide a robust, type safe, central location for accessing system services.
In our services subsystem, we focus on data storage and accessibility. The services we implement include raw data storage, derived data storage, model data storage, render object storage, colour map storage, interaction matrix storage and a VO factory.
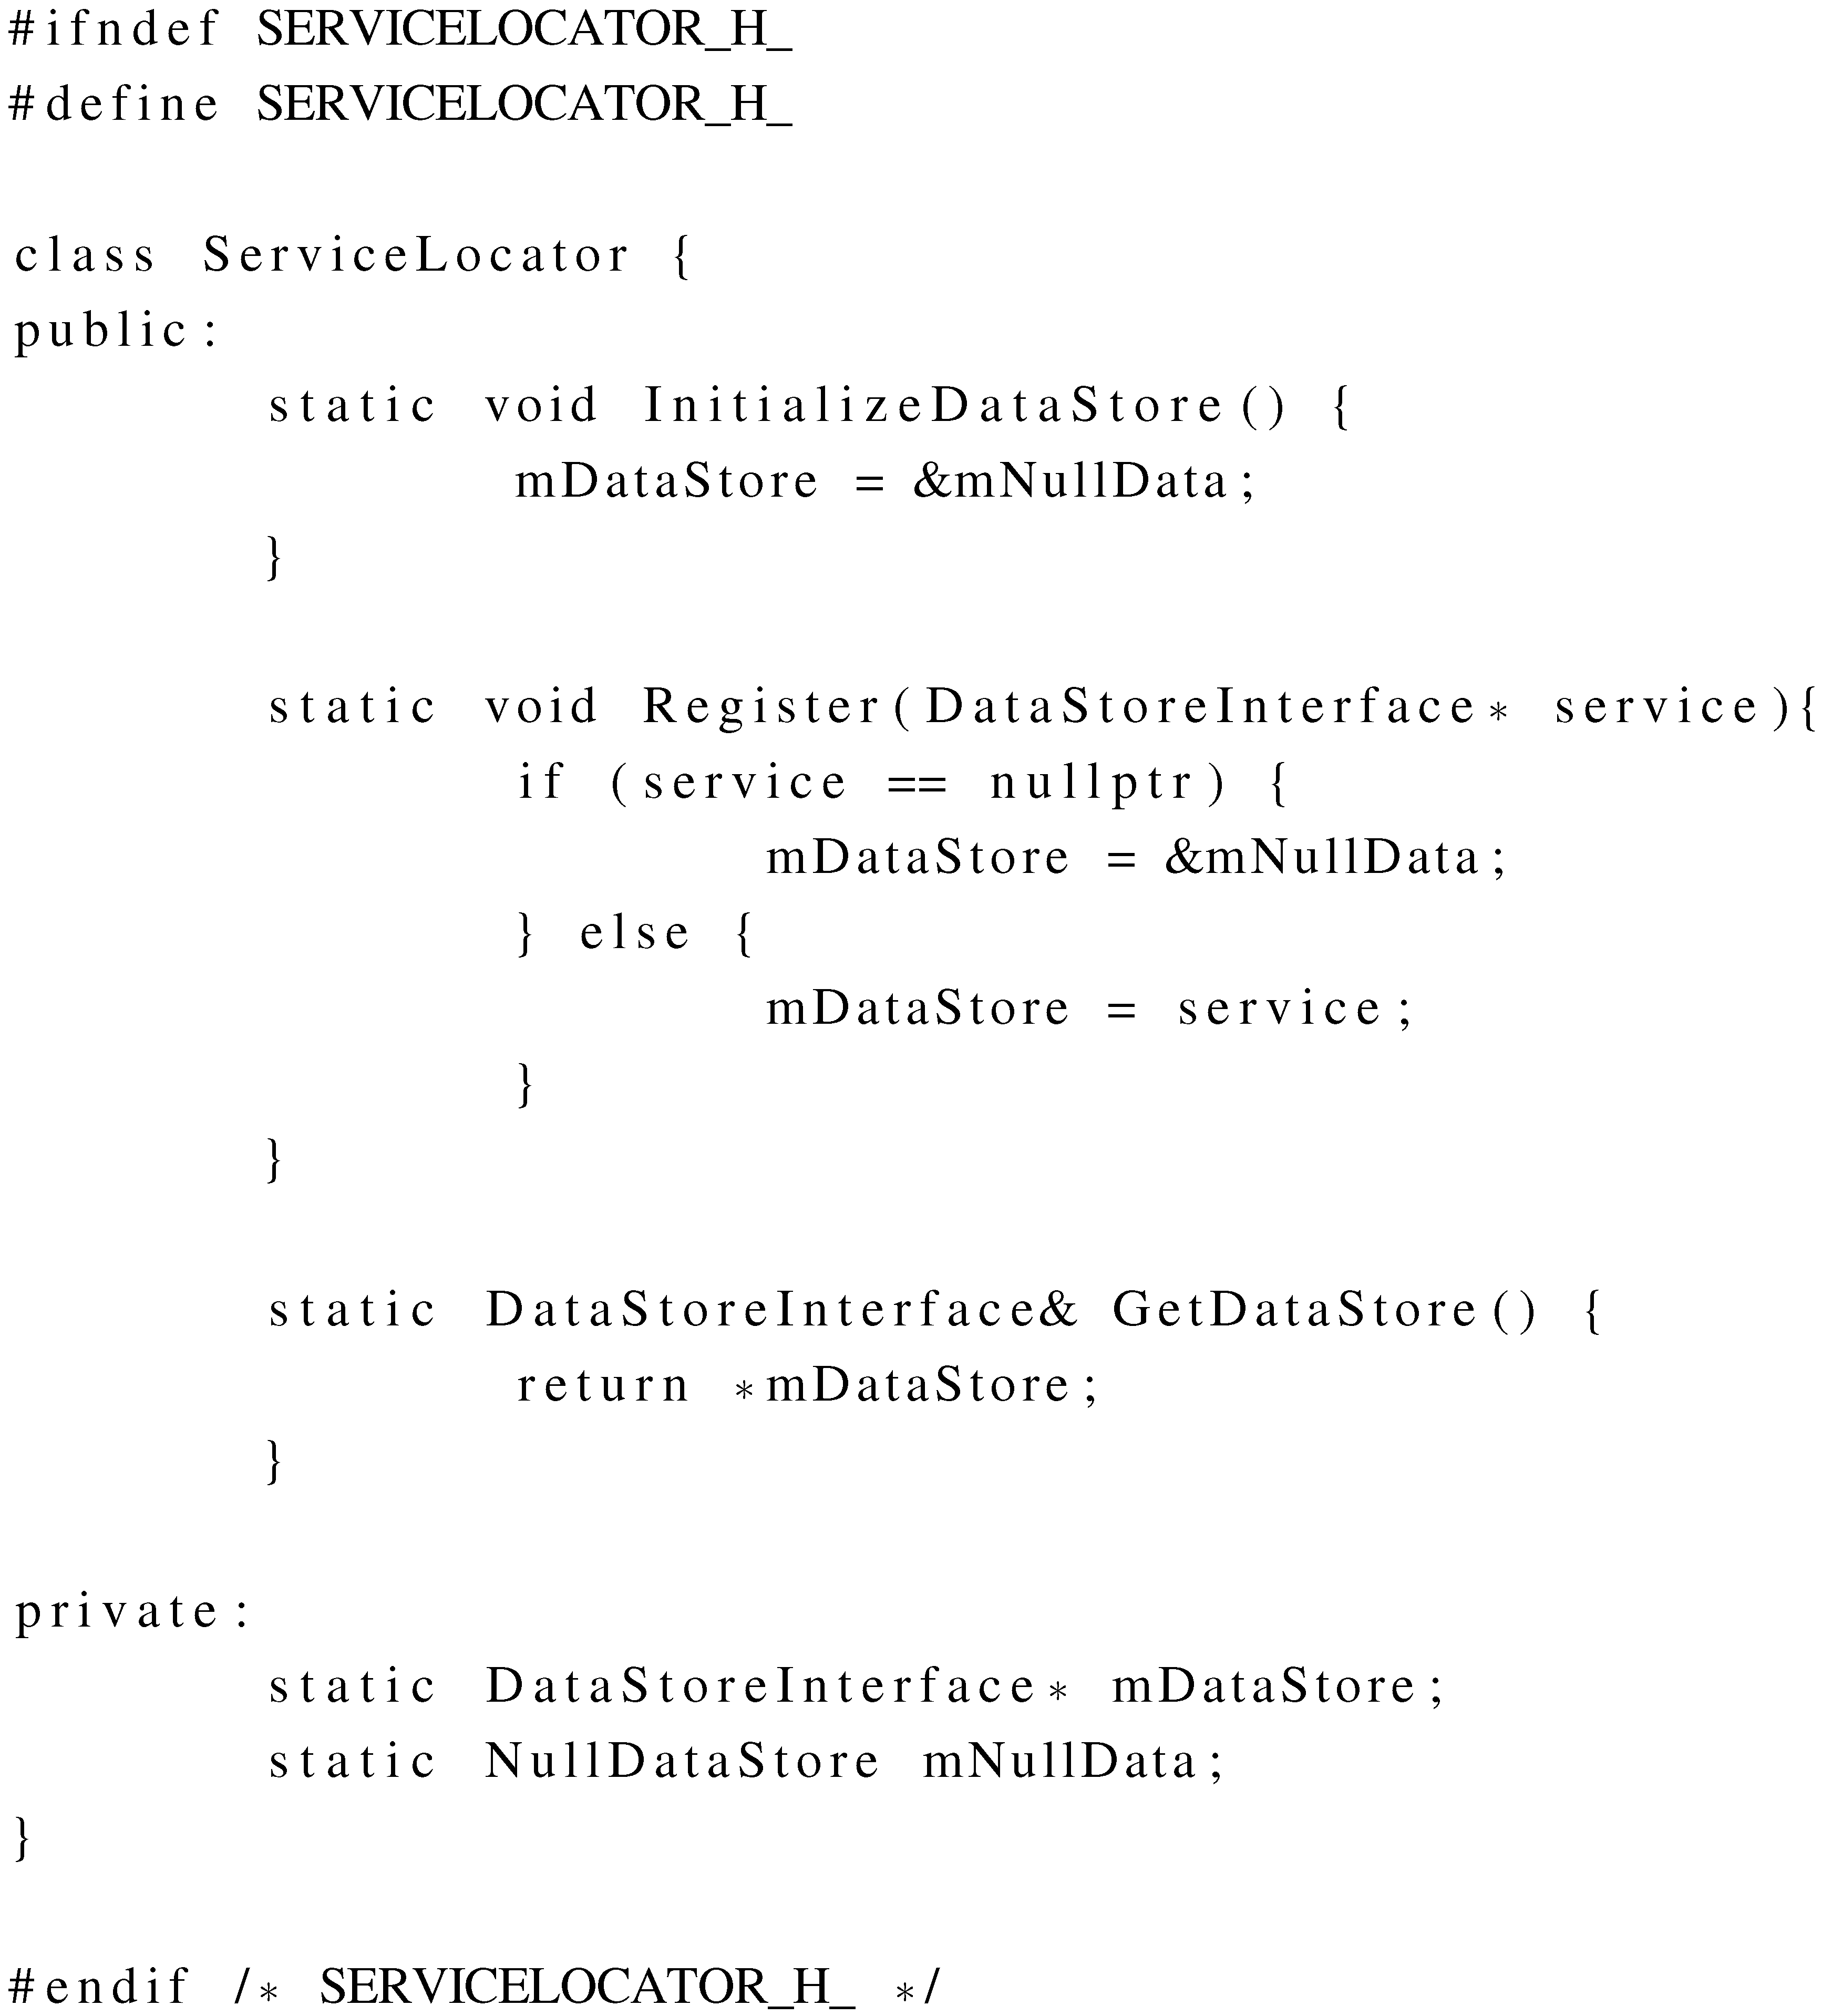
In Listing 1, we see the basic layout of the service locator class. The listing shows an initialization function, a register function and a get function. The service locator is reliant on a service being registered with it before any other objects try to use the service. One challenge here is that a null pointer may be returned if not initialized or a service is registered. It is also important to note that the service is not aware of the concrete service class, just the service interface. The only object in the code that knows about the concrete class is the function that registers the service.
Listing 1: Service Locator Pattern.

If we try to use the service before a provider has been registered, it returns a null pointer. If the calling code does not check this, we will crash the application. To address the null pointer, we implement the null object design pattern [15] or, in our case, a null service. A null service inherits the same service interface, but its implementation does nothing. This allows code that receives the object to safely continue on. The calling code will never know that the service is not available, and we do not have to handle a null pointer. We are guaranteed a valid object.
Our service locator is initialized within the main function prior to any other calls. The initialization function registers the null objects. We can then register any additional services as required. Registering a replacement service is a simple case of just registering the service. We do not delete any services within the service locator class, which provides us the flexibility of swapping services back and forth if required. An example of this is two interaction services storing different view matrices; whichever service is currently registered dictates from which viewpoint the visualization is viewed in the centre frame.
Another important feature of this design pattern is the logging or debugging capabilities. Using a decorator design pattern [16] we can easily add an intermediate object which can output either logging or debugging information. Accessing the services is a simple matter of calling the accessor function. This returns a reference to the currently registered service object. Unregistering a service can be achieved by registering a null pointer. The service locator will then register the default null service.
5. Logic Subsystem Design
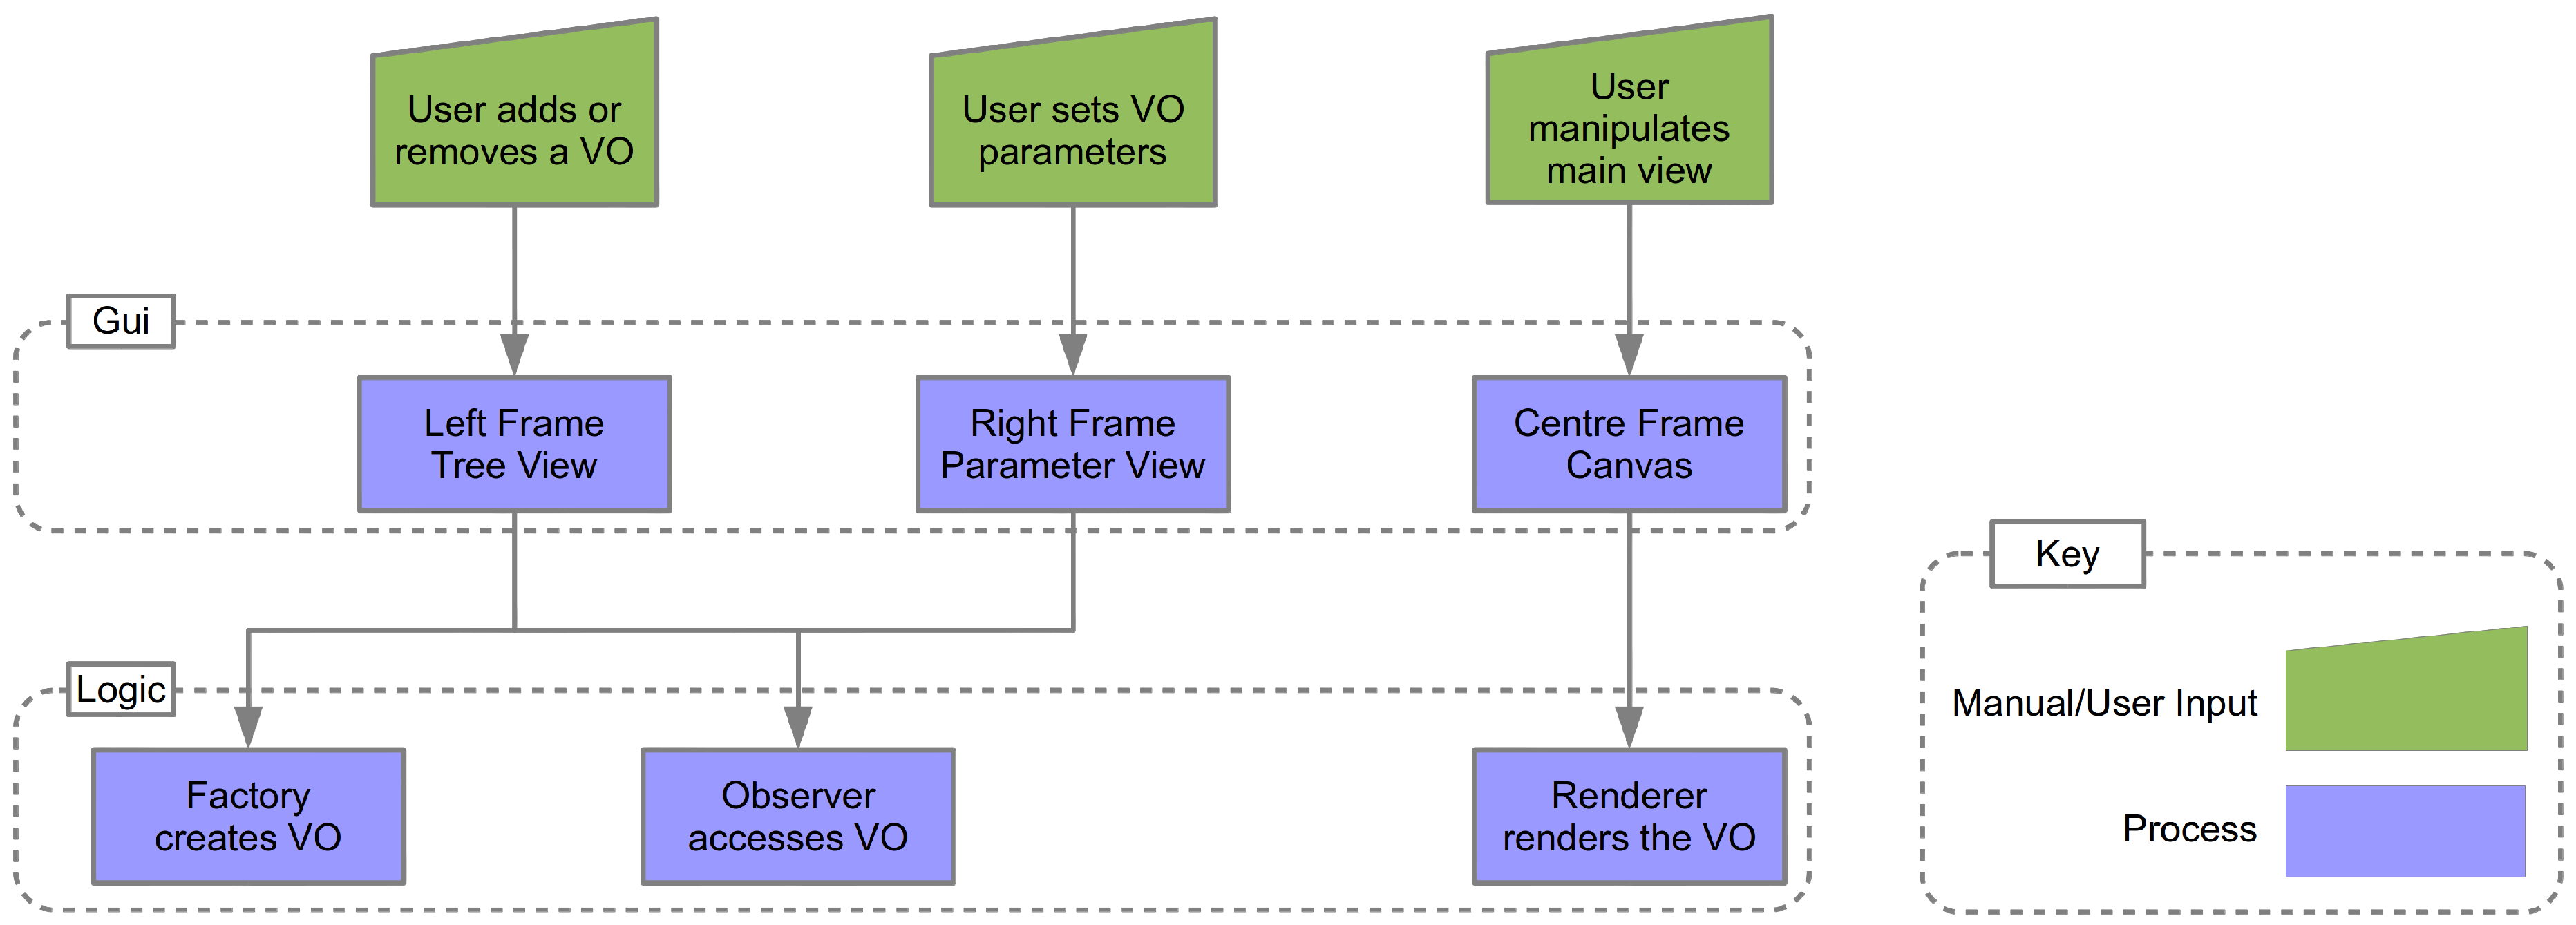
The Logic subsystem encapsulates the algorithms used to compute the visualizations. This subsystem processes the input parameters selected by the user and computes the visualization based on the selected algorithm. Figure 4 shows the communication route from user interaction with the GUI to the selected VO generating the visualization data. There are three main subsets of the logic subsystem responsible for manipulation of the VO. These are the factory class, the observer class and the renderer class. In this section, a discussion of the factory and observer design patterns takes place. This is followed by a discussion of the render loop and finishes with an examination of the aggregate VO and its life cycle.
Figure 4.
Communication routes from the user to the logic subsystem. User interaction with the GUI is communicated to the visualization object (VO) responsible for the selected visualization algorithm via dedicated subsets of the logic subsystem.
Figure 4.
Communication routes from the user to the logic subsystem. User interaction with the GUI is communicated to the visualization object (VO) responsible for the selected visualization algorithm via dedicated subsets of the logic subsystem.

5.1. The Factory
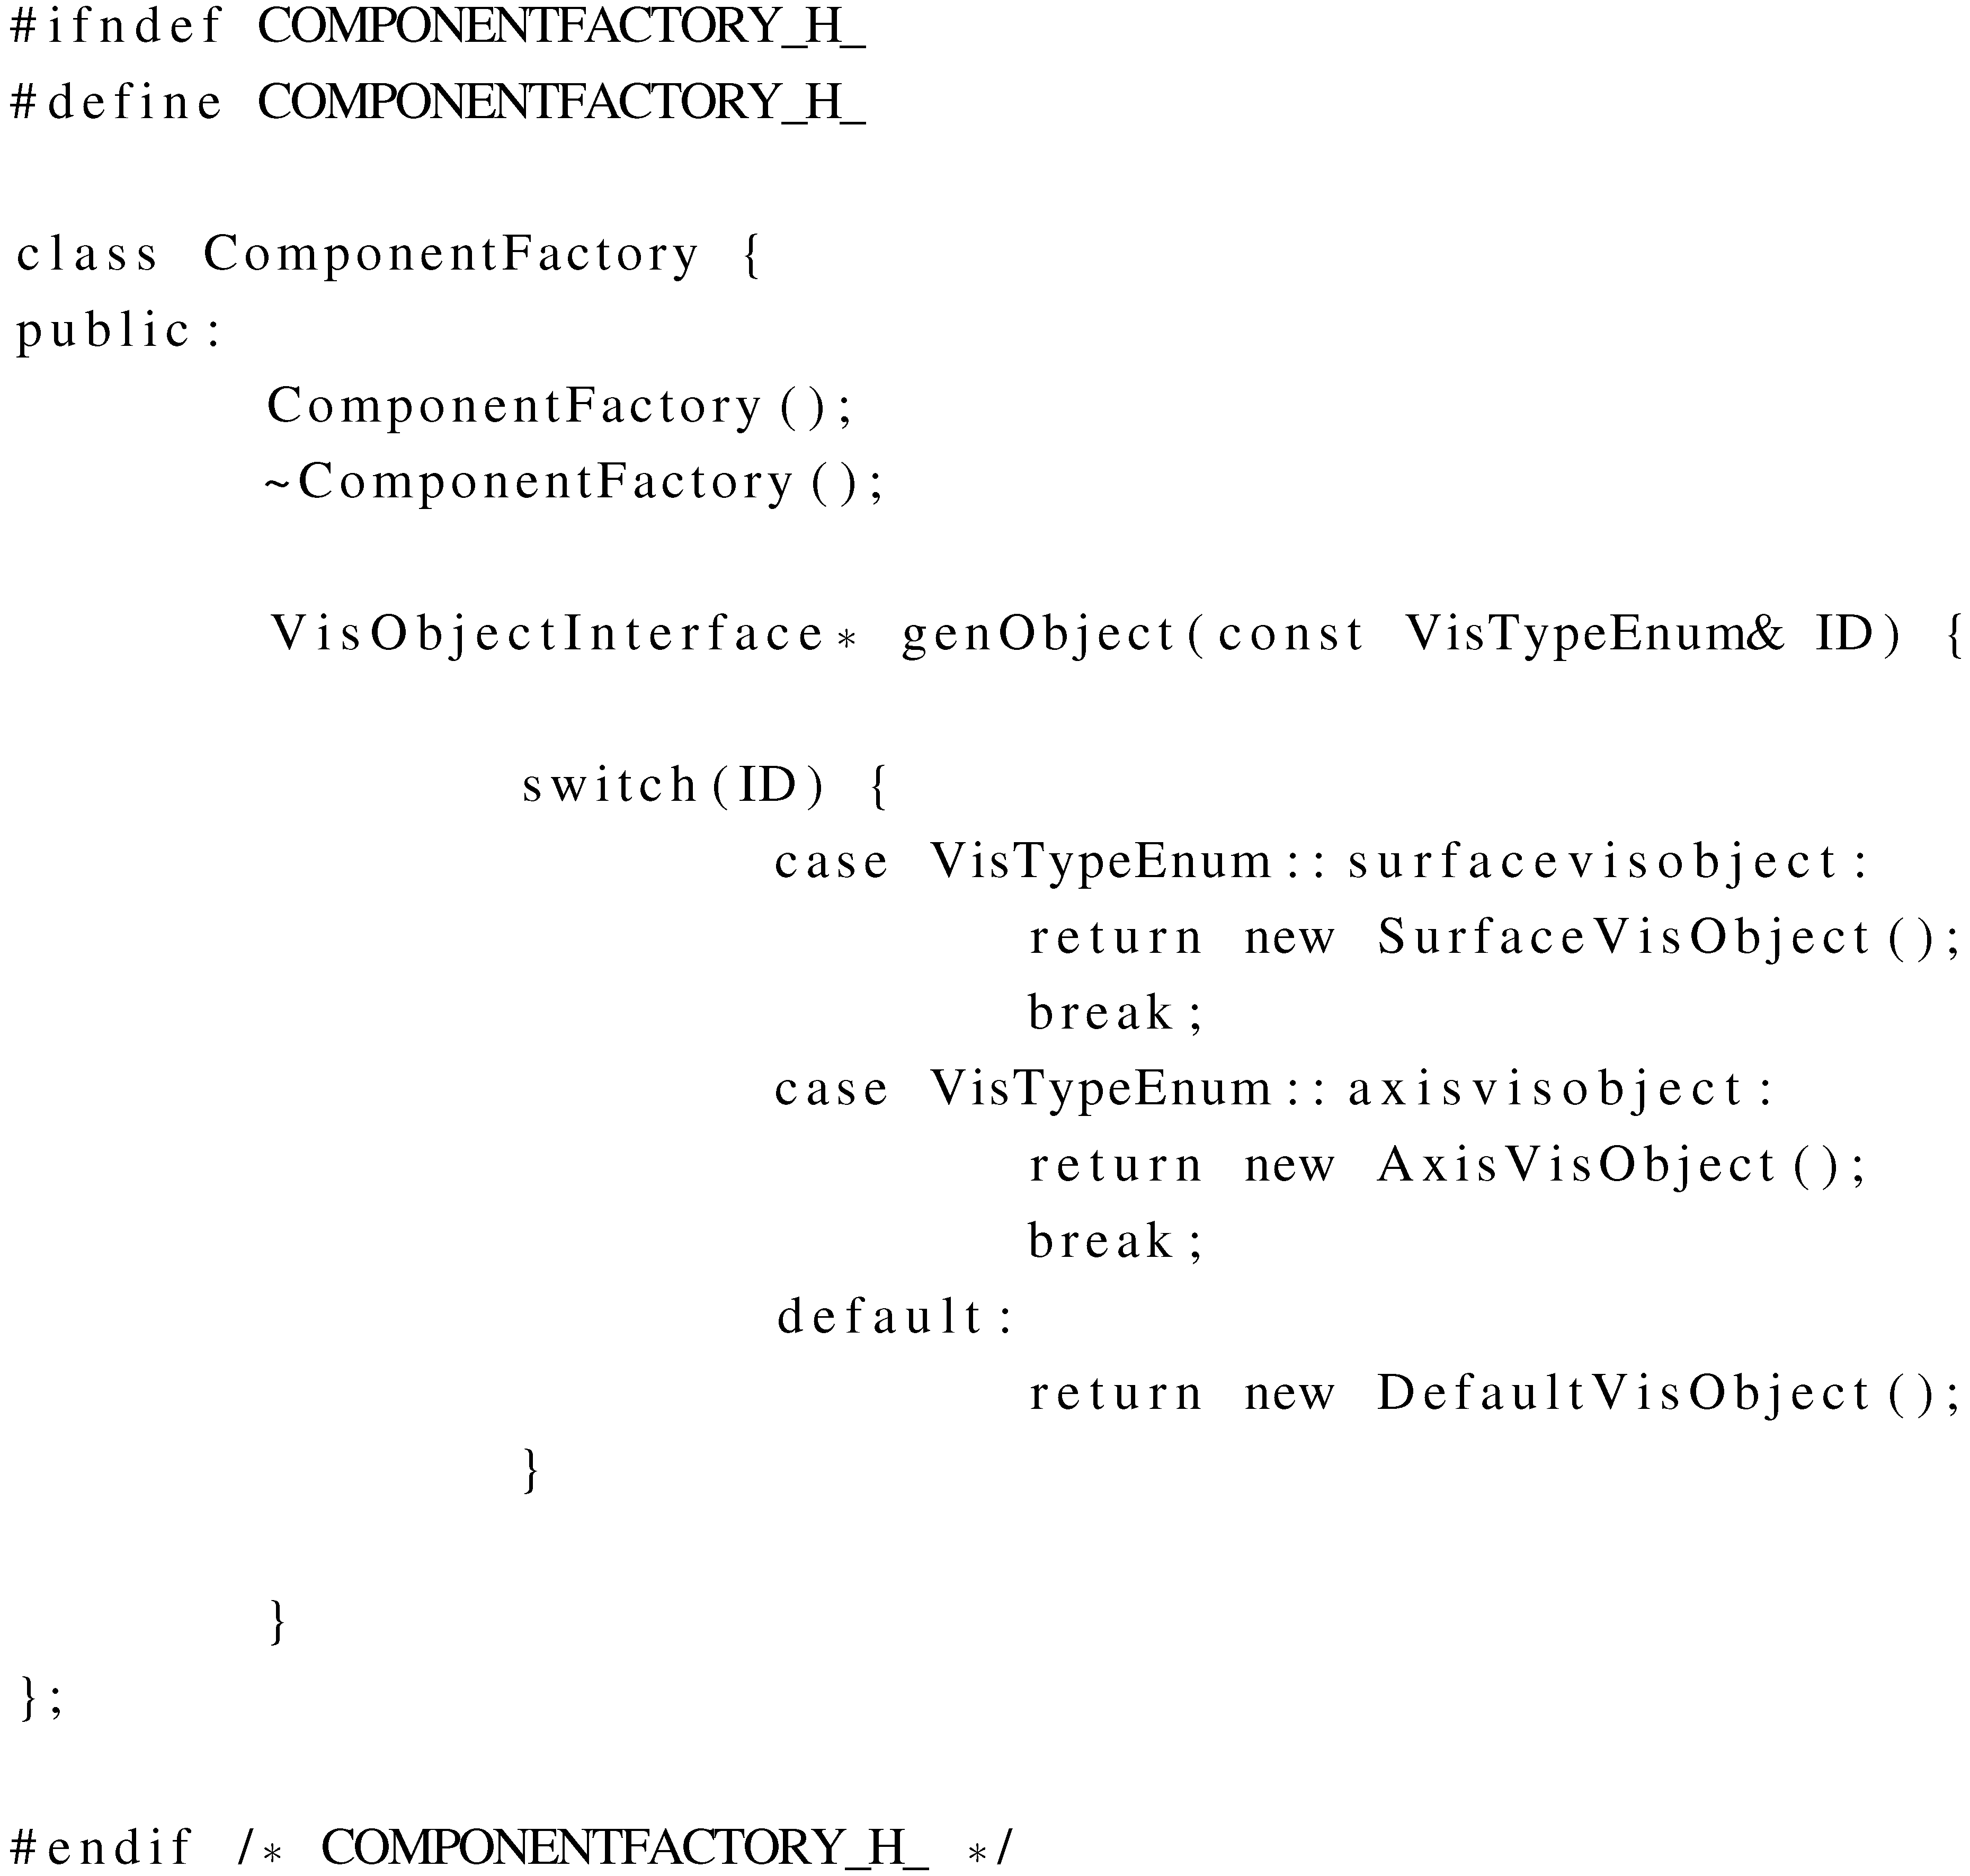
There are many cases when a class needs to create several types of object. This class can have this responsibility, but it has to know about each and every object type. The possibility that the class cannot anticipate all the required objects in advance is clear. The idea of the factory pattern is to encapsulate the creation of a multitude of different classes utilizing a common interface. A factory is the location of a class in the code where multiple types of object are constructed. The purpose of utilizing this pattern is to isolate the creation of objects from their usage and to create groups of similar objects without the need to depend on their concrete classes. This has the advantage of introducing new derived types with no change to the code that leverage the base class type. Using this pattern also introduces the possibility of interchanging the concrete implementations without code modification. An example of the factory pattern can be seen in Listing 2. If the user chooses to add a new VO in the treeview (on the left of GUOI), the GUI instructs the factory to create a new VO of a type indicated by a type ID. A reference to the factory is stored in and accessed from the service locator.
Listing 2: Factory Pattern.

5.2. The Observer
The observer design pattern is used to communicate an object change of state to all dependent objects. These dependent objects are then automatically updated. This pattern controls the communication between classes. An object known as the subject is able to publish a change of state. A set of observer objects that depend on the subject are registered with the subject, such that they can then be automatically notified when the state of the subject changes. This design pattern provides a loose coupling between the subject and its observers. The subject has access to a set of observers that are registered at runtime. The observers must inherit an observer interface; thus, the base class and its functionality is not known to or required by the subject.
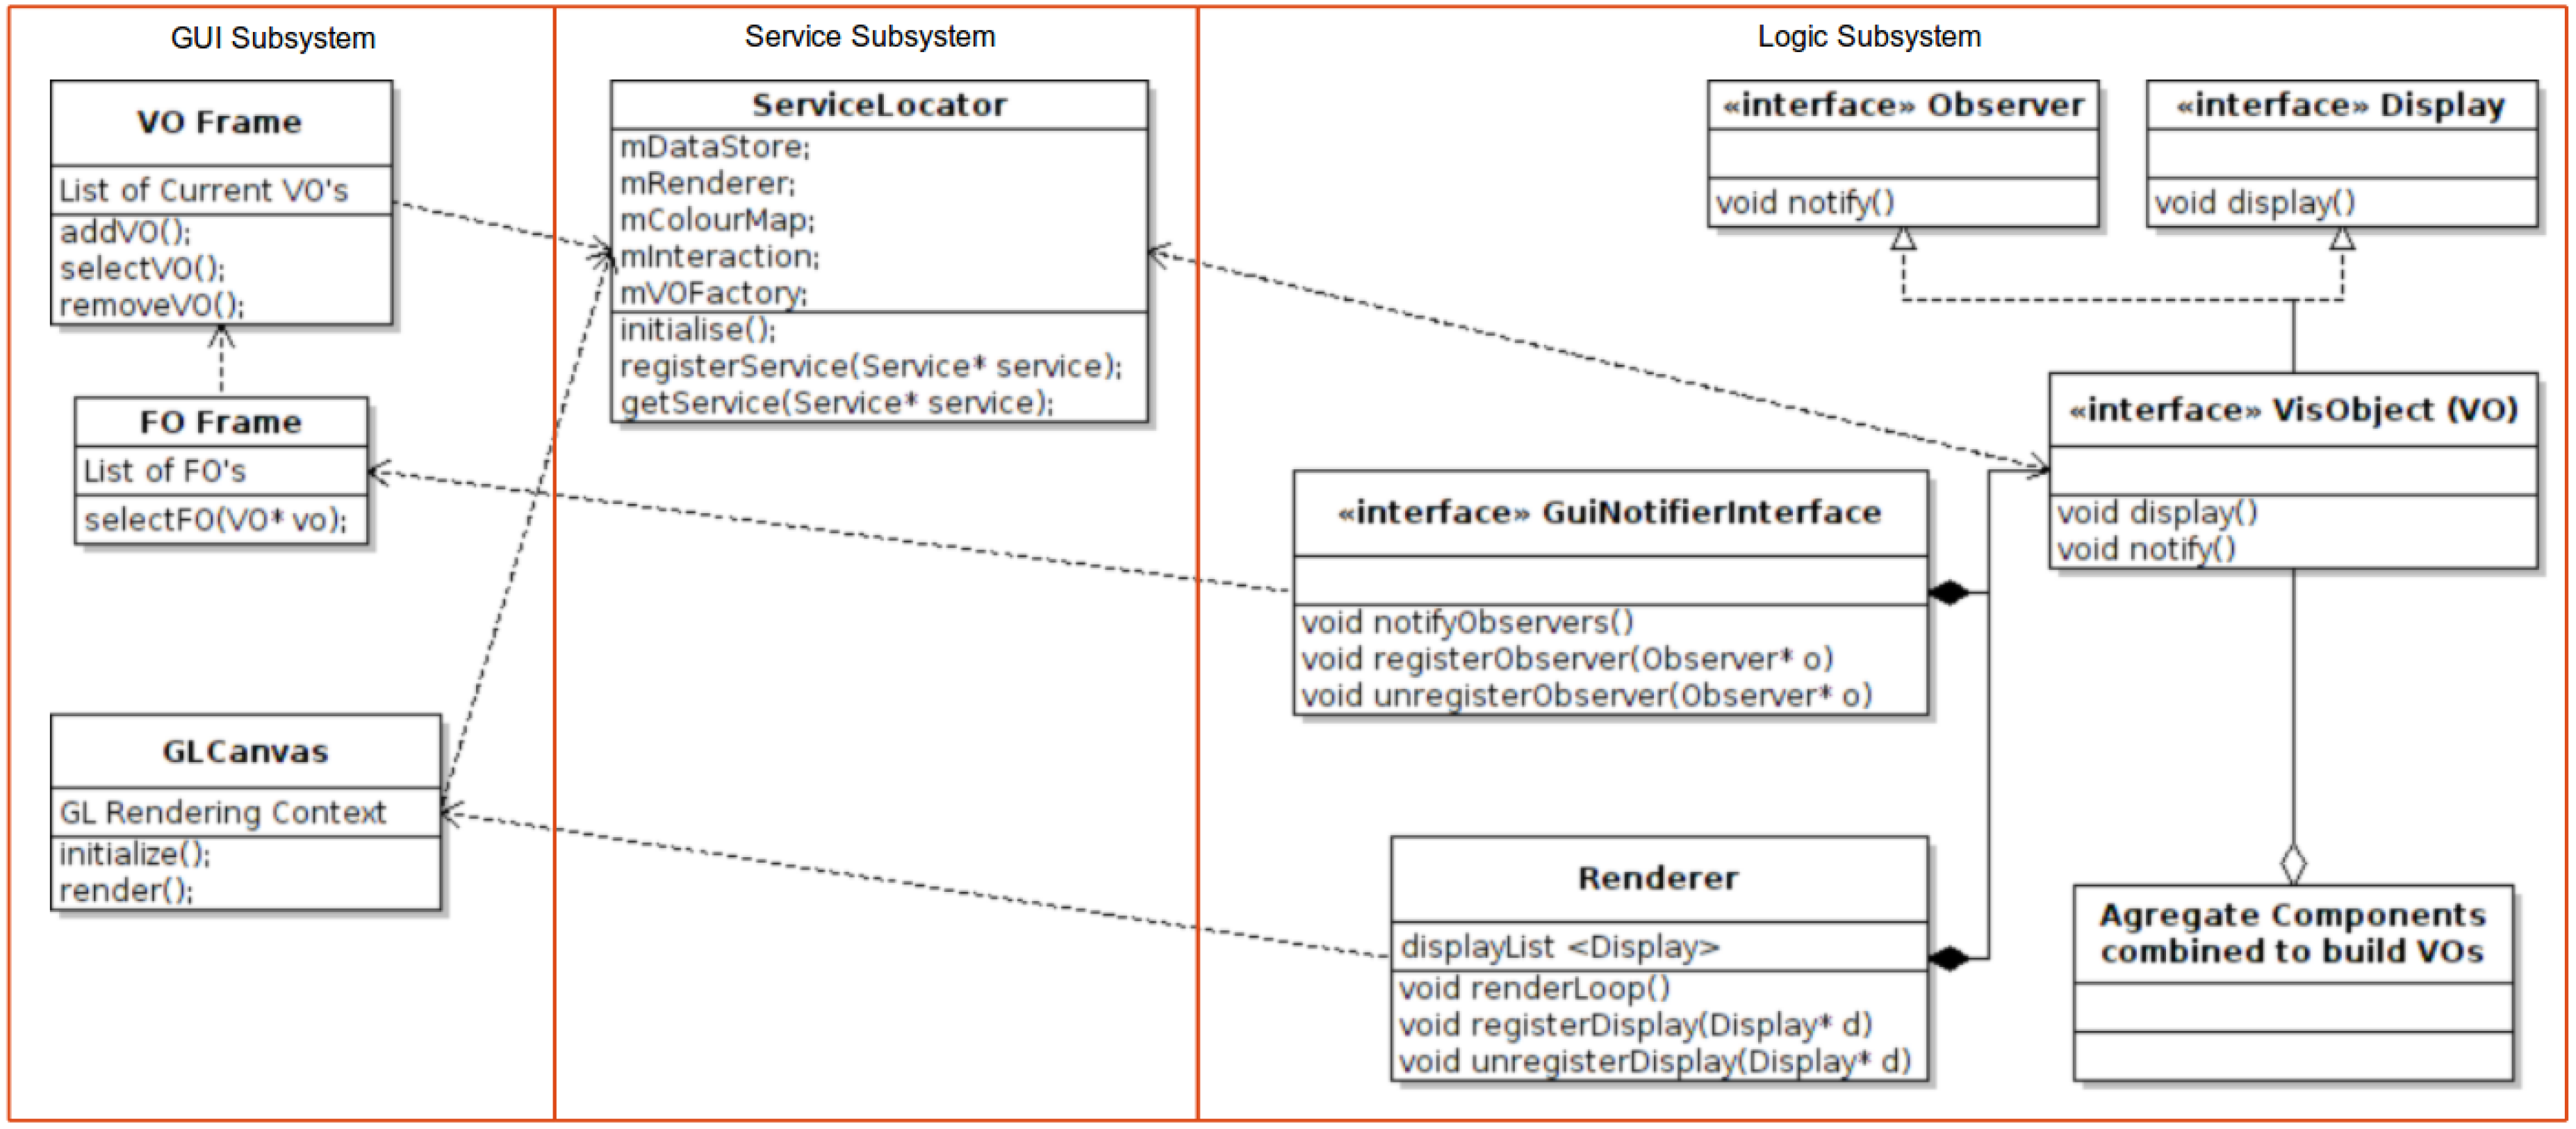
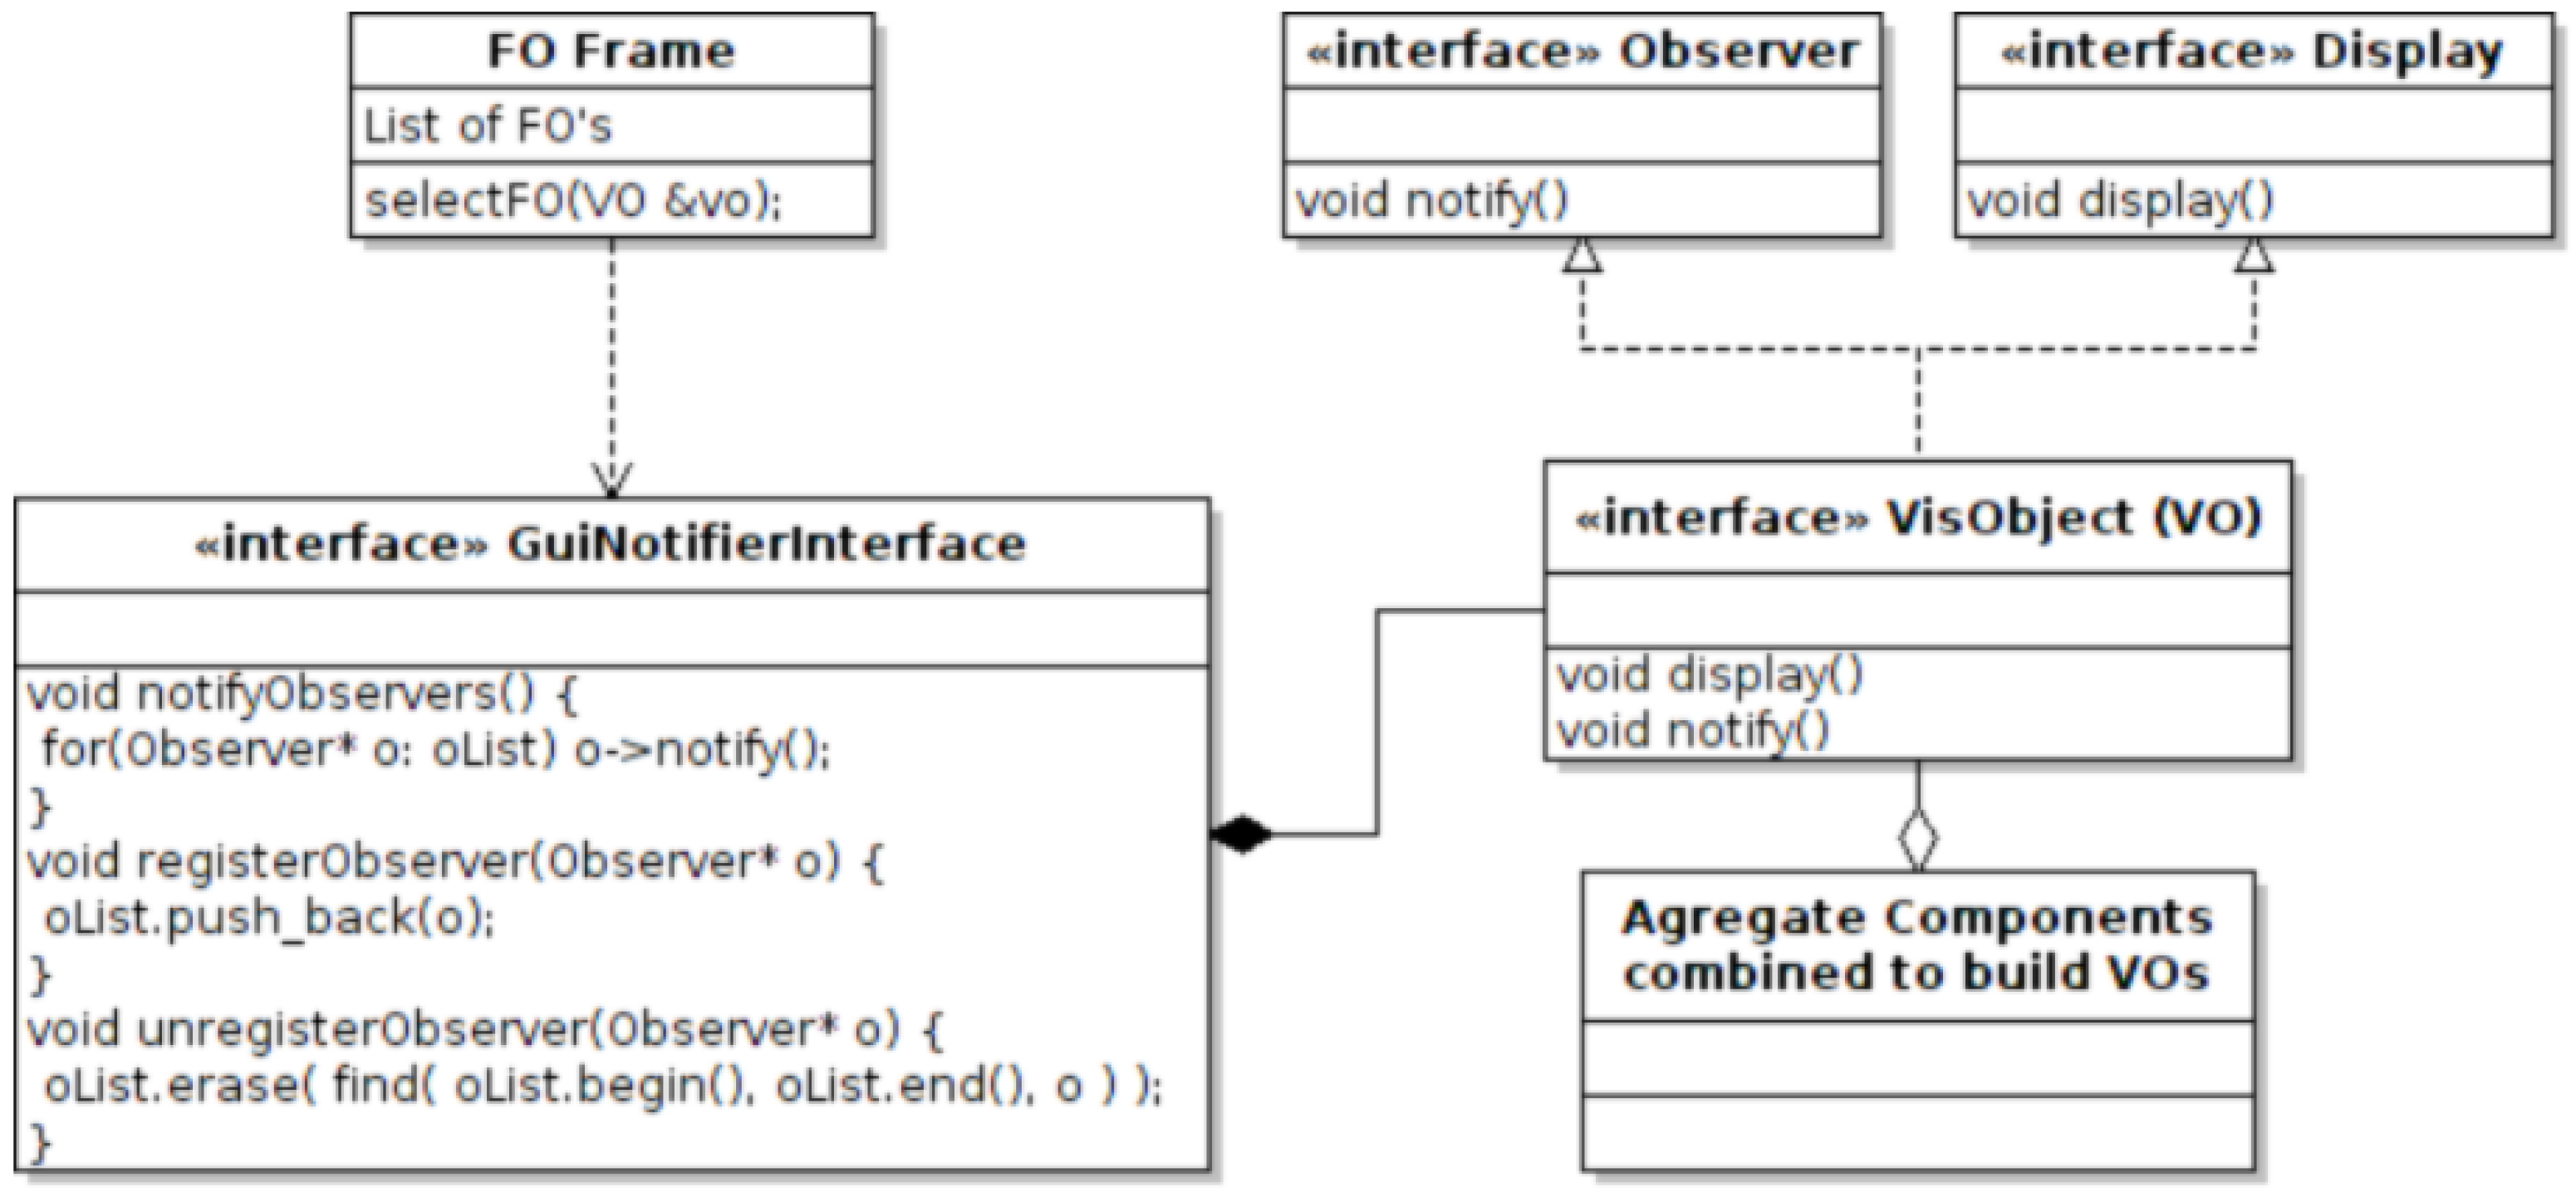
Figure 5 shows the the use case in our software framework. The VOs inherit the observer interface, which includes the notify function, which must be appropriately overridden in the base class. The VO is registered with the subject, which, in our case, is the GuiNotifier class. When a frame object (FO) state changes, it calls the notifyObservers function, which notifies all registered VOs that the state has changed. The base class implementation overriding the notify function then checks for changes and updates itself accordingly where applicable.
Figure 5.
This UML (Unified Modeling Language) diagram shows the layout of the observer design pattern utilized for communication between the GUI frame objects (FOs) and the visualization objects (VOs).
Figure 5.
This UML (Unified Modeling Language) diagram shows the layout of the observer design pattern utilized for communication between the GUI frame objects (FOs) and the visualization objects (VOs).

5.3. The Rendering Loop
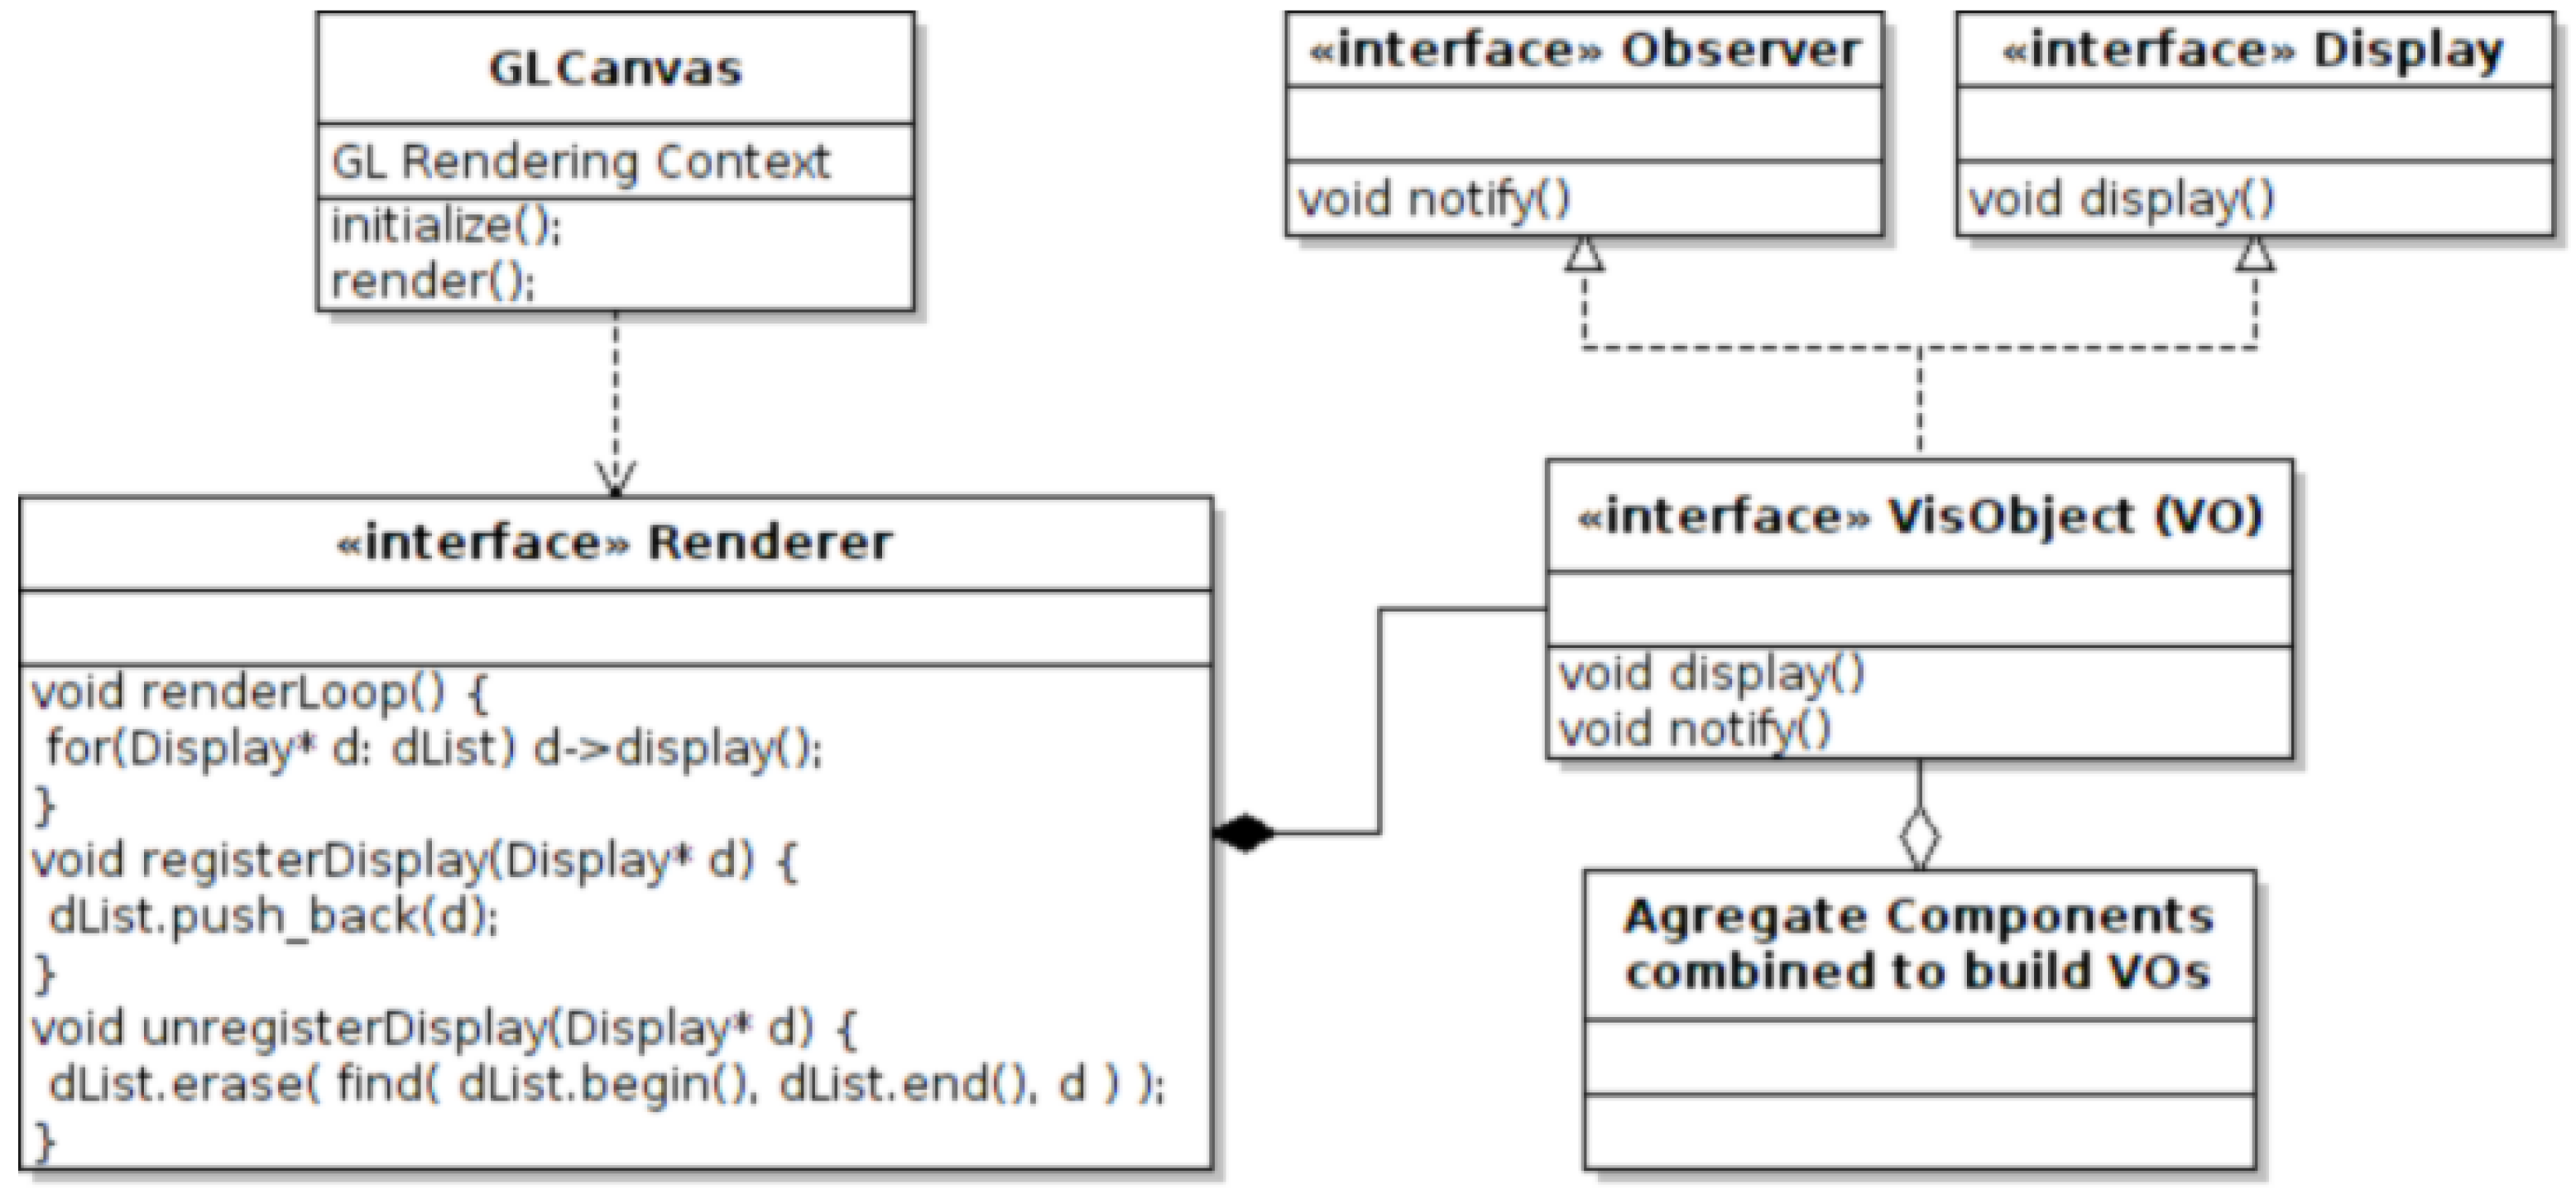
The GUI centre frame renders the current OpenGL rendering context to its canvas for viewing by the user; Section 3. An example of this can be seen in the following illustration; Figure 3. In Figure 6, the centre frame encapsulates the GLCanvas class. When the GLCanvas class render event is triggered, it calls the renderLoop function from the Renderer class.
The Renderer class is designed to encapsulate the collection of OpenGL calls required to set the state of the OpenGL state machine. This class also has functionality based on the observer design pattern. VO objects are registered with the renderer, and when the renderLoop function is called by the GLCanvas class, the overridden display function called on the list of registered VOs. The detail of this is shown in the UML (Unified Modeling Language) diagram of Figure 6.
Figure 6.
This UML diagram shows the relationship between the renderer and the visualization objects (VOs). Note the similarity with the observer design pattern shown in Figure 5.
Figure 6.
This UML diagram shows the relationship between the renderer and the visualization objects (VOs). Note the similarity with the observer design pattern shown in Figure 5.

The general state of the scene is set from the renderer’s associated frame object (FO). This includes features, such as perspective parameters, light source locations and lighting intensitys, e.g., ambient, diffuse and specular. The type of OpenGL Shader is also selected from this frame object. The renderer class defines how to render the scene data, whereas the VO defines what data are to be rendered.
The Renderer interface is used to provide a general interface for the specific OpenGL implementation. There are differing versions of OpenGL available, supported by different specifications of hardware. The advantage of our system is the ability to interchange the Renderer class depending on the hardware support for a particular version of OpenGL. The required version of the Renderer class is registered with the service locator. This is also useful for testing revised OpenGL or Graphics Library Shading Language (GLSL) [17] implementations.
- What is GLSL: GLSL or Graphics Library Shading Language is a high level shading language, which uses a syntax close to that of the C programming language. It was created for the purpose of providing developers with more precise control over the built-in graphics pipeline. Previously, developers would be required to use OpenGL assembly or graphics card-specific programming languages to implement modifications to the fixed functionality pipeline.
In our implementation, we use a combination of per pixel Phong lighting, edge highlighting using a Gaussian filter to detect sudden changes in depth, and depth peeling for order-independent transparency. These algorithms are discussed in more detail in [3,4,10] and in the work by Born et al. [18] and Hummel et al. [19].
5.4. The Visualization Object (VO)
The visualization object (VO) is a key element in the functionality of this software framework. The entire framework is built around the idea of a single object interface type used for all implemented features within the application. In this subsection we describe the lifecycle of a typical VO. We then describe the aggregate style implementation of the VOs and discuss some advantages of this approach over more traditional methods in the context of a robust visualization framework for prototyping, testing and comparing new techniques.
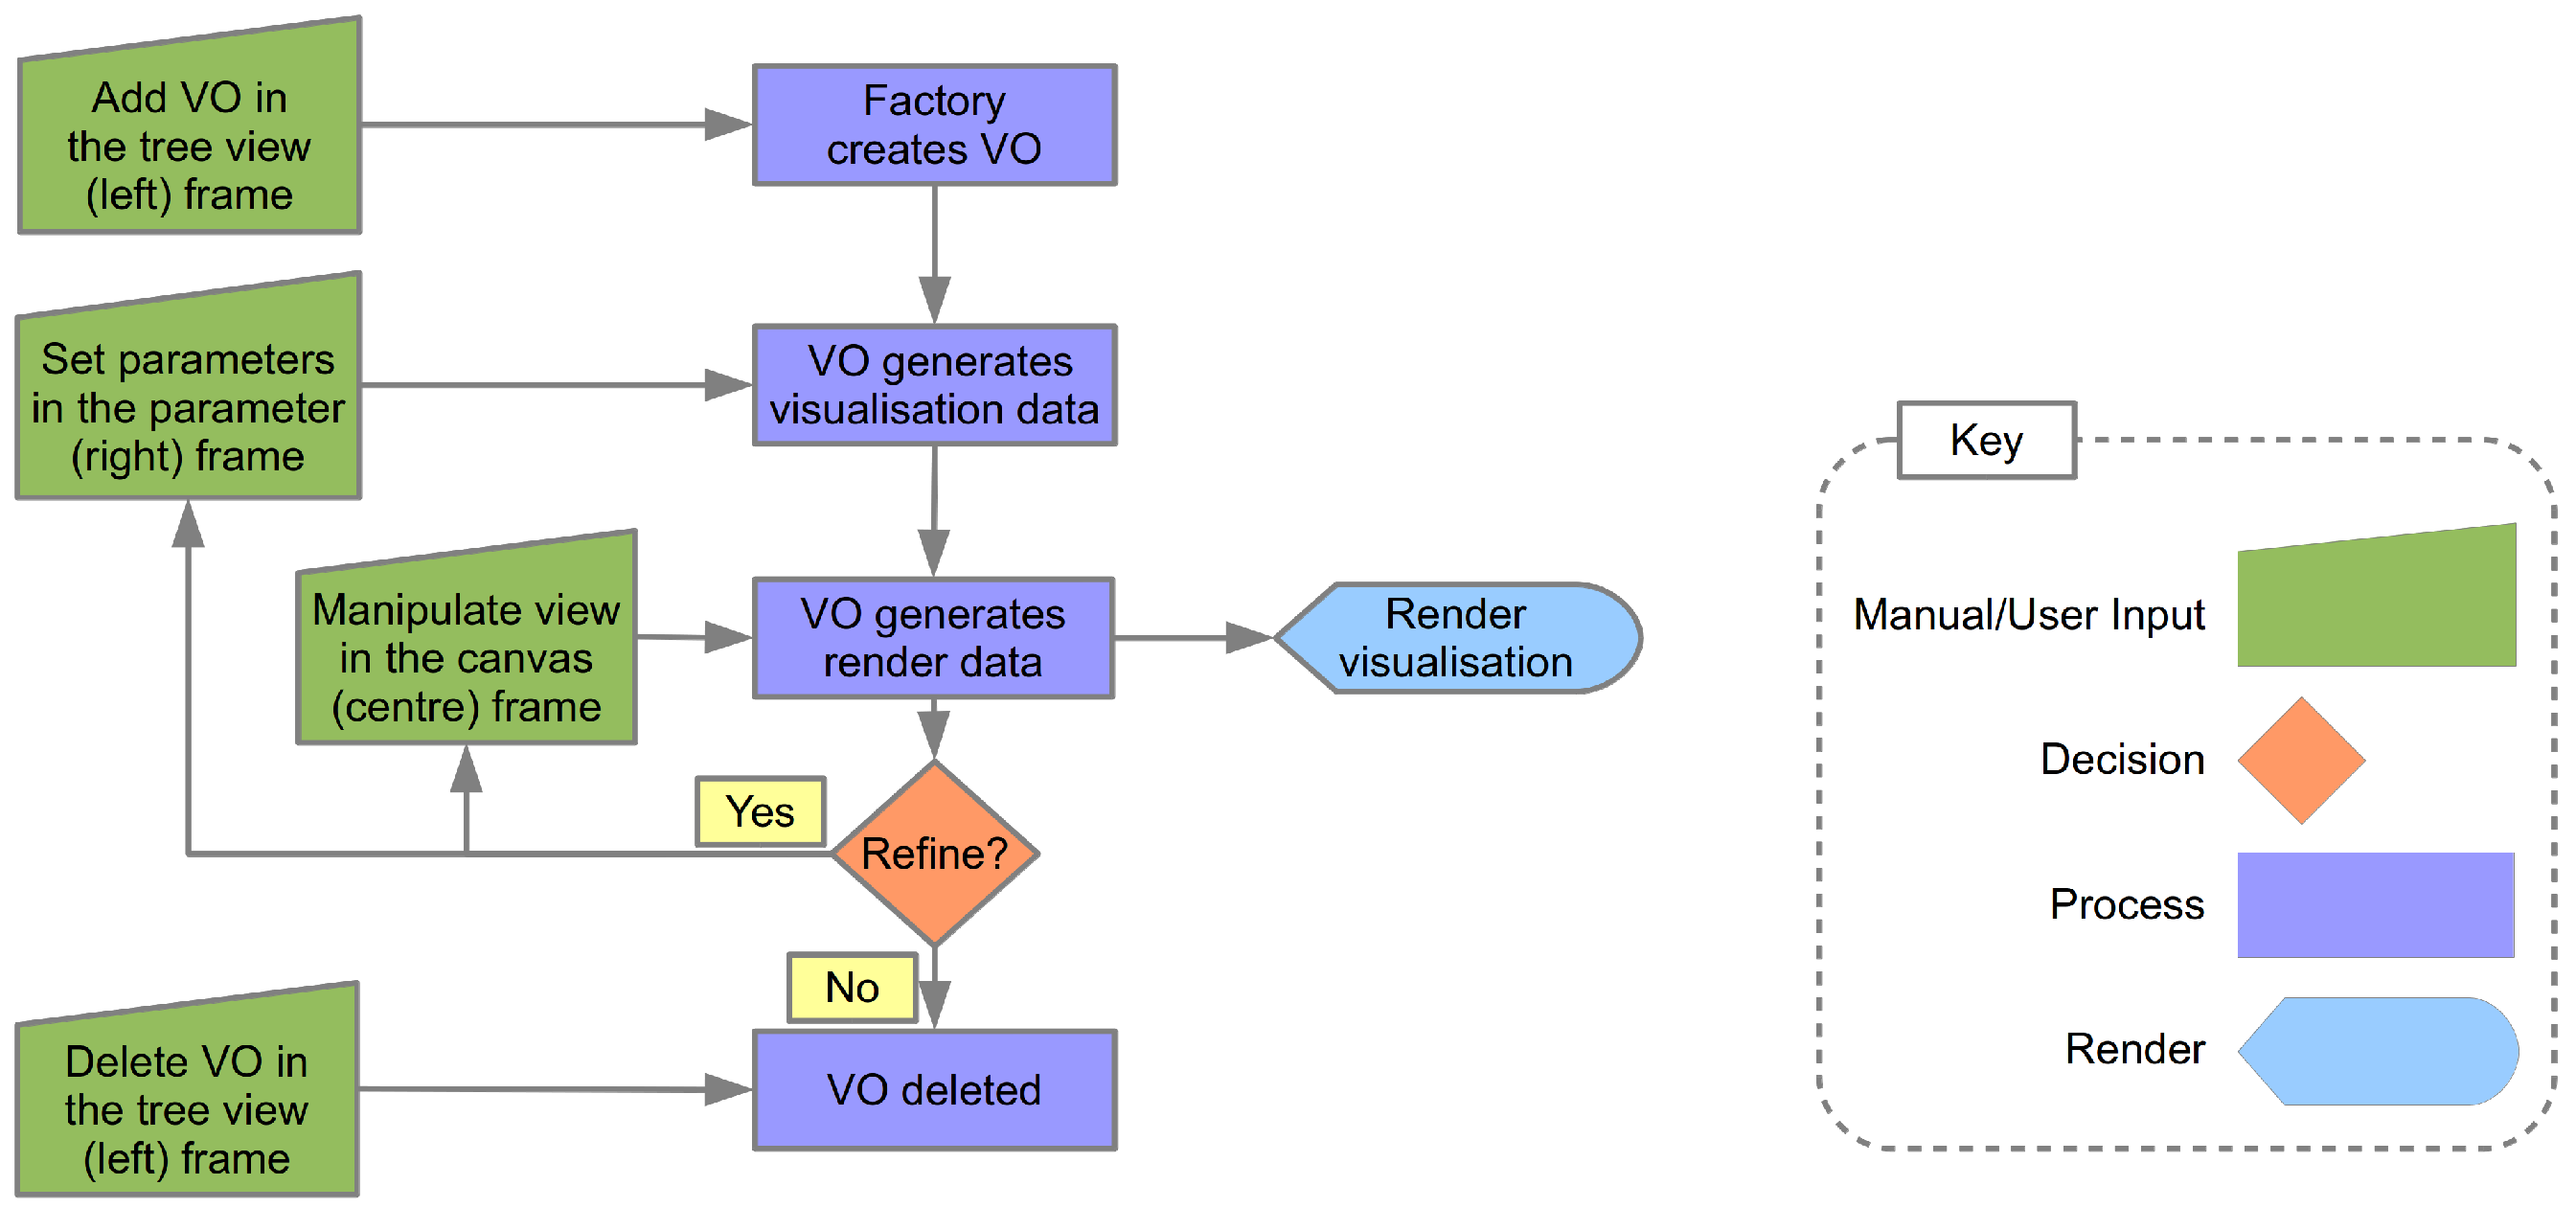
The life cycle of a VO is illustrated in Figure 7. The life cycle of the VO starts with its creation as the result of user input. The factory is responsible for the generation of VOs, which are then passed to the GuiNotifierInterface detailed in Figure 5. Communication with the VO can then take place. The next step is setting the parameters of the VO required as input to the particular algorithm the VO encapsulates. Once these parameters are set, the visualization data are then generated.
Figure 7.
The Visualization Object (VO) lifecycle.

During the visualization generation process, data external to the VO may be required. An example of this is the vector and scalar data made available by another VO (the data storage VO) registered with the service locator. This data can be accessed via the service locator interface, along with other data such as colour maps etc.
Once the visualization data is generated, in the form of a triangulated mesh, the next step is to generate the render data. The mesh data is usually generated in dual arrays, one representing the vertex, normal, colour data and one representing the node indices. This data is sent directly to the VBO (Vertex Buffer Object) class encapsulating the OpenGL Vertex Buffer Object. This class registers the pointers to the data, then specifies the required rendering parameters needed by the OpenGL state machine to correctly render the mesh.
Once the visualization algorithm is rendered to the centre frame, the user is able to interact with the visualization. The user can directly pan, zoom and rotate the rendered scene by dragging the mouse over the scene in combination with the mouse buttons. The right mouse button is pressed to pan the scene; the left mouse button is pressed to zoom the scene; and both mouse buttons are used to rotate the scene. While interacting with the visualization, the user can also set new parameters for the visualization and generate a modified visualization, which is then rendered to screen; see Figure 7.
The final part of the process is deletion of the VO. If the user removes the VO from the left frame 3 by selecting delete from the VO context menu, the VO is then passed back to the factory for deletion ending this VO’s lifecycle. All VO objects are created and deleted by the factory. This centralized approach makes for easy debugging of erroneous VO’s during the VO lifecycle.
The VOs are constructed by aggregating the set of sub classes needed to compute the required algorithm. The more traditional method of class hierarchies implement features available in a set of classes by extending them and therefore maximizing code reuse. The design of the class hierarchy is made in advance with anticipation of possible additions to the code at a later date. This approach is tried and tested and generally works well.
However, a more recent approach is being more commonly utilized, particularly within the games industries: the aggregate design pattern [20,21]. With the more traditional hierarchical inheritance approach, problems can arise in a number of ways. If the insight into the type of additions to the inheritance hierarchy were not well predicted, the code base can easily end up struggling to cope with the required changes leading to major refactoring of the code base. Furthermore, with more and more features being added, the interwoven complexity of the inheritance hierarchical tree can quickly become unwieldy and difficult to maintain. These scenarios do not lend themselves to quick and simple implementations of new features.
The aggregate design pattern provides an alternative approach which is more applicable to the type of framework discussed in this paper. We need to be able to add new algorithms quickly and easily, but without the issues and complexity associated with large inheritance hierarchies. Another advantage of this approach is the ability to minimize the inherited overhead of unrequired features when extending a class of which only some of the functionality is required.
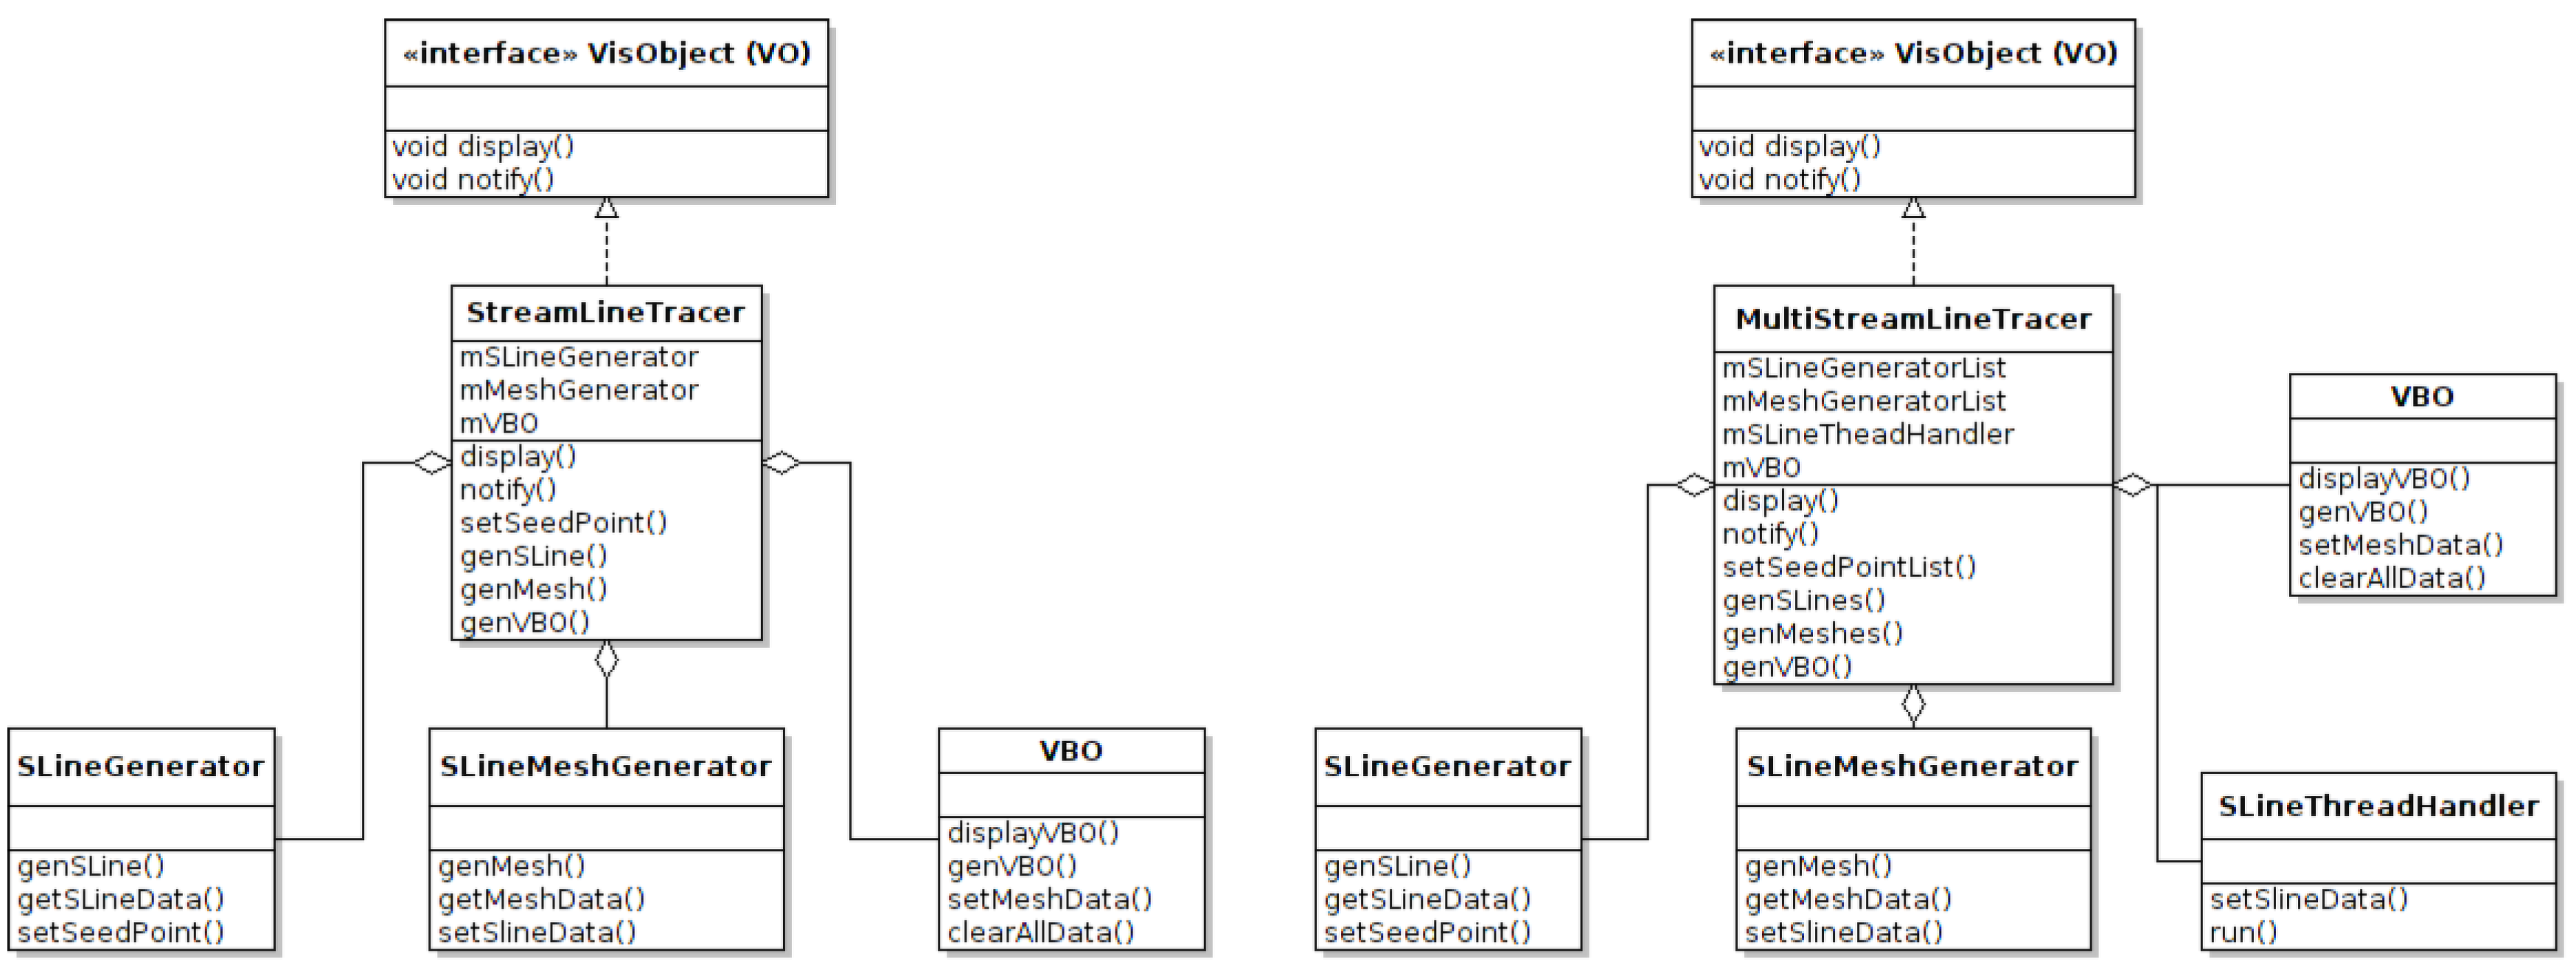
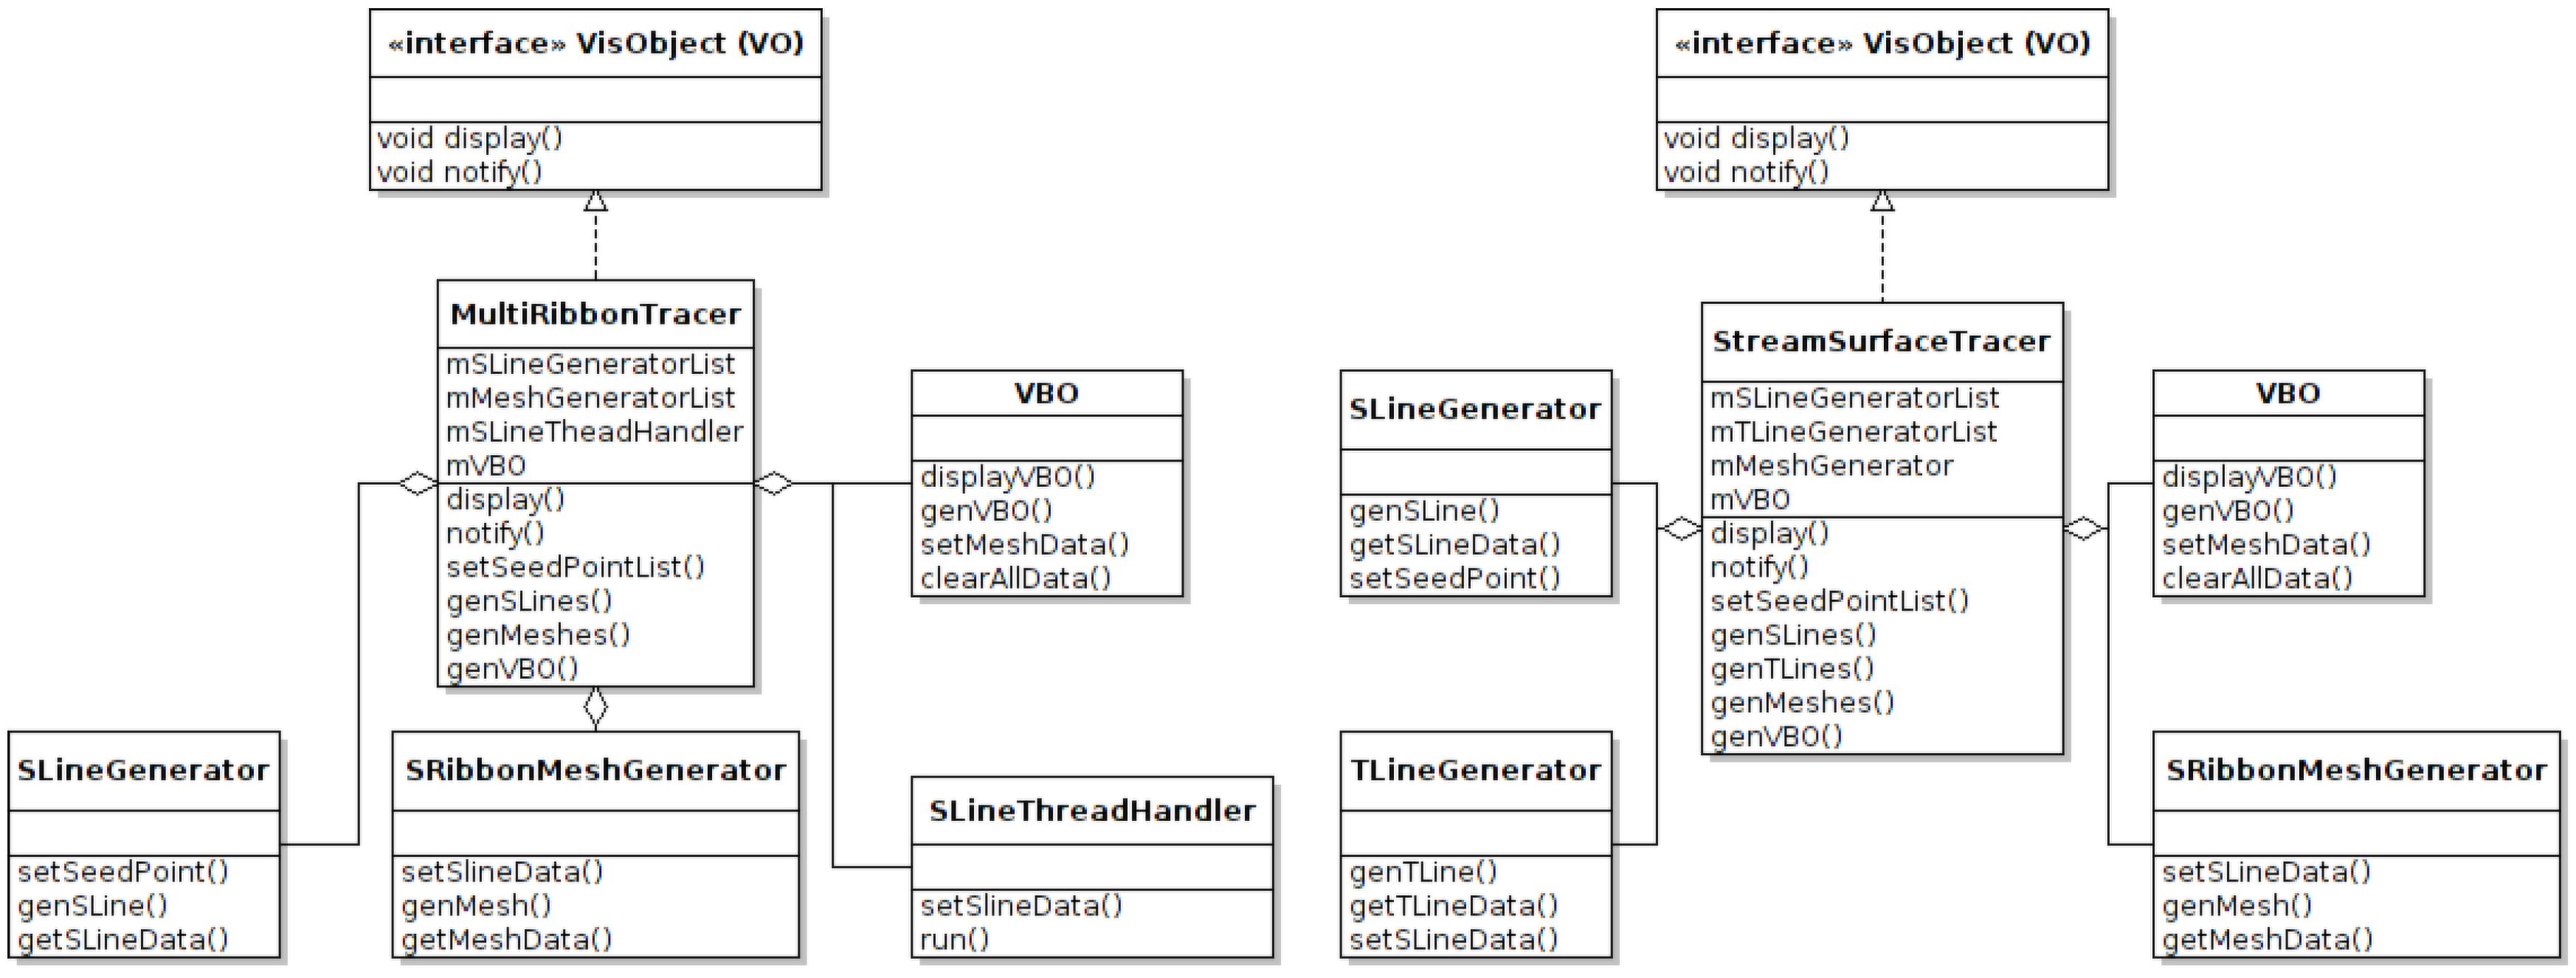
The parent class is constructed from an aggregation (collection) of a set of components classes. The component classes separate all the functionality required by the system into individual components, which are independent of each other. The parent class becomes a wrapper for communication between each of the individual components i.e., the parent class performs no computation or stores any data with the exception of the aggregated component classes; see Figure 8 and Figure 9. Distinct new functionality is implemented in the system by creating a new component. New combinations of component classes are aggregated together to form new base classes providing the required system functionality.
Figure 8.
This UML diagram illustrates a simplified version of a streamline tracer class and a multi threaded streamline tracer class. Rather than inherit the original streamline class and adding the multi threading implementation into the new class, we instead assemble a new class from the original components plus a new thread-handling component. If threading was an original intention, then the hierarchical inheritance could be designed more efficiently, but now, we must refactor the code. With the component-based approach, foresight into how the software will involve in the future is not required. This is particularly useful in a system which is subject to adding a lot of new functionality.

Figure 9.
This UML diagram illustrates a simplified version of a multi-threaded stream ribbon tracer class and a stream surface tracer class. Some components are reused, and new components are added to provide the required functionality. In these illustrations, the thread handler used in the stream ribbon tracer class is dropped from the stream surface tracer class, while the time line generator class is added for timeline refinement.

6. Conclusions
This paper presents a comprehensive and versatile cross platform state-of-the-art flow visualization toolkit. This framework has the flexibility to add new algorithms fast and efficiently for testing, evaluation, comparing results and for study by the domain experts. We focus on describing the design and implementation of a generic visualization framework, which provides scientists and engineers with effective solutions for the visualization of CFD simulation data.
The simple and intuitive layout of the GUI is effective for reducing the software-related learning curve by the domain experts. The subdivision of the GUI, service locater and logic into logical subsystems not only greatly simplifies the system, but also simplifies the communication between the different subsystems and provides greater flexibility when accessing the raw data. The use of aggregation with the VOs proved very successful and flexible when adding new algorithms and features to the software stack.
Future work for this system includes further abstraction of the VOs and FOs to a plugin-based system, where new features and algorithms can by added via a plugin interface. This would further simplify implementation and remove the need to modify the main code base. Another area of further work is extending the aggregate pattern of composite components to an XML based approach for constructing the VOs. This combined with a plugin interface for the components would produce a very flexible way to add new features and algorithms to the software.
Acknowledgments
The Authors would like to thank the Department of Computer Science at Swansea University, UK.
Author Contributions
Matthew Edmunds wrote the software framework and contributed to the writing of this paper. Chao Tong contributed to the writing of this paper. Robert S. Laramee contributed to the design and implementation of the software as well as authorship of the paper. All authors have read and approved the final manuscript.
Conflict of Interest
The authors declare no conflict of interest.
References
- ANSYS UK. Fluent Engineering Simulation. Available online: http://www.fluent.co.uk/ (accessed on 11 March 2015).
- Laramee, R.S. Comparing and evaluating computer graphics and visualization software. Softw. Pract. Exp. (SP&E) 2008, 38, 735–760. [Google Scholar]
- Edmunds, M.; Laramee, R.; Chen, G.; Zhang, E.; Max, N. Advanced, Automatic Stream Surface Seeding and Filtering. In Proceedings of Theory and Practice of Computer Graphics 2012, Didcot, UK, 13–14 September 2012; pp. 53–60.
- Edmunds, M.; Laramee, R.S.; Evans, B.; Chen, G. Stream Surface Placement for a Land Speed Record Vehicle; Technical Report; The Visual and Interactive Computing Group, Computer Science Department, Swansea University: Wales, UK, 2013. [Google Scholar]
- Laramee, R.S.; Hadwiger, M.; Hauser, H. Design and Implementation of Geometric and Texture-Based Flow Visualization Techniques. In Proceedings of the 21st Spring Conference on Computer Graphics, Budmerice, Slovakia, 12–14 May 2005; pp. 67–74.
- Piringer, H.; Tominski, C.; Muigg, P.; Berger, W. A Multi-threading Architecture to Support Interactive Visual Exploration. IEEE Trans. Vis. Comput. Graph. 2009, 15, 1113–1120. [Google Scholar] [CrossRef]
- Piringer, H.; Berger, W.; Krasser, J. HyperMoVal: Interactive Visual Validation of Regression Models for Real-Time Simulation. In Computer Graphics Forum; Blackwell Publishing Ltd.: Hoboken, NJ, USA, 2010; Volume 29, pp. 983–992. [Google Scholar]
- McLoughlin, T.; Laramee, R.S. Design and Implementation of Interactive Flow Visualization Techniques; INTECH Open Access Publisher: Rijkka, Croatia, 2012; Chapter 6; pp. 87–110. [Google Scholar]
- Peng, Z.; Geng, Z.; Laramee, R.S. Design and Implementation of a System for Interactive, High-Dimensional Vector Field Visualization. In Horizons in Computer Science Research; Nova Science Publishers: Hauppauge, NY, USA, 2013; Volume 8, pp. 175–200. [Google Scholar]
- Edmunds, M.; Laramee, R.; Malki, R.; Masters, I.; Croft, T.; Chen, G.; Zhang, E. Automatic Stream Surface Seeding: A Feature Centered Approach. Comput. Graph. Forum 2012, 31, 1095–1104. [Google Scholar] [CrossRef]
- Cppreference.com. Std::lock. Available online: http://en.cppreference.com/w/cpp/thread/lock (accessed on 11 March 2015).
- BlackWasp. Service Locator Design Pattern. Available online: http://www.blackwasp.co.uk/ServiceLocator.aspx (accessed on 11 March 2015).
- Code Project. A Basic Introduction On Service Locator Pattern. Available online: http://www.codeproject.com/Articles/18464/A-Basic-Introduction-On-Service-Locator-Pattern (accessed on 11 March 2015).
- Martin Fowler. Inversion of Control Containers and the Dependency Injection pattern. Available online: http://martinfowler.com/articles/injection.html (accessed on 11 March 2015).
- BlackWasp. Null Object Design Pattern. Available online: http://www.blackwasp.co.uk/NullObject.aspx (accessed on 11 March 2015).
- BlackWasp. Decorator Design Pattern. Available online: http://www.blackwasp.co.uk/Decorator.aspx (accessed on 11 March 2015).
- OpenGL.org. OpenGL GLSL. Available online: http://www.opengl.org/wiki/OpenGL_Shading_Language (accessed on 11 March 2015).
- Born, S.; Wiebel, A.; Friedrich, J.; Scheuermann, G.; Bartz, D. Illustrative Stream Surfaces. IEEE Trans. Vis. Comput. Graph. 2010, 16, 1329–1338. [Google Scholar] [CrossRef]
- Hummel, M.; Garth, C.; Hamann, B.; Hagen, H.; Joy, K. IRIS: Illustrative Rendering for Integral Surfaces. IEEE Trans. Vis. Comput. Graph. 2010, 16, 1319–1328. [Google Scholar] [CrossRef] [PubMed]
- Nystrom, R. Game Programming Patterns. Available online: http://gameprogrammingpatterns.com/component.html (accessed on 11 March 2015).
- West, M. Refactoring Game Entities with Components. Available online: http://cowboyprogramming.com/2007/01/05/evolve-your-heirachy (accessed on 11 March 2015).
© 2015 by the authors; licensee MDPI, Basel, Switzerland. This article is an open access article distributed under the terms and conditions of the Creative Commons Attribution license (http://creativecommons.org/licenses/by/4.0/).
Share and Cite
MDPI and ACS Style
Edmunds, M.; Tong, C.; Laramee, R.S. Design of a Flow Visualisation Framework. Computers 2015, 4, 24-38. https://doi.org/10.3390/computers4010024
AMA Style
Edmunds M, Tong C, Laramee RS. Design of a Flow Visualisation Framework. Computers. 2015; 4(1):24-38. https://doi.org/10.3390/computers4010024
Chicago/Turabian StyleEdmunds, Matthew, Chao Tong, and Robert S. Laramee. 2015. "Design of a Flow Visualisation Framework" Computers 4, no. 1: 24-38. https://doi.org/10.3390/computers4010024