
Global Forest Types Based on Climatic and Vegetation Data


1
College of Landscape Architecture and Tourism, Hebei Agricultural University, Baoding 071001, China
2
College of Forestry, Hebei Agricultural University, Baoding 071001, China
3
Department of Geography, Swansea University, Singleton Park, Swansea SA2 8PP, UK
4
Department of Environmental Systems Science, Institute of Integrative Biology, D-USYS, ETH-Zürich, 8006 Zurich, Switzerland
*
Author to whom correspondence should be addressed.
Sustainability 2022, 14(2), 634; https://doi.org/10.3390/su14020634
Submission received: 27 November 2021
/
Revised: 2 January 2022
/
Accepted: 4 January 2022
/
Published: 7 January 2022
(This article belongs to the Special Issue Sustainability with Changing Climate and Extremes)
Abstract
:Forest types are generally identified using vegetation or land-use types. However, vegetation classifications less frequently consider the actual forest attributes within each type. To address this in an objective way across different regions and to link forest attributes with their climate, we aimed to improve the distribution of forest types to be more realistic and useful for biodiversity preservation, forest management, and ecological and forestry research. The forest types were classified using an unsupervised cluster analysis method by combining climate variables with normalized difference vegetation index (NDVI) data. Unforested regions were masked out to constrict our study to forest type distributions, using a 20% tree cover threshold. Descriptive names were given to the defined forest types based on annual temperature, precipitation, and NDVI values. Forest types had distinct climate and vegetation characteristics. Regions with similar NDVI values, but with different climate characteristics, which would be merged in previous classifications, could be clearly distinguished. However, small-range forest types, such as montane forests, were challenging to differentiate. At macroscale, the resulting forest types are largely consistent with land-cover types or vegetation types defined in previous studies. However, considering both potential and current vegetation data allowed us to create a more realistic type distribution that differentiates actual vegetation types and thus can be more informative for forest managers, conservationists, and forest ecologists. The newly generated forest type distribution is freely available to download and use for non-commercial purposes as a GeoTIFF file via doi: 10.13140/RG.2.2.19197.90082).
1. Introduction
Forests vary in structure and function across the world. The broad-scale vegetation units with common formation characteristics, due to similar climates, are known as vegetation types [1]. Generally, forest types are derived from vegetation or land use types. In fact, the first way to define forest types was based on a vegetation classification. Vegetation types were originally developed based on the idea that similar climates select for similar plant forms [2], and therefore the resulting types were mostly climate-based. The first formal climate classification system was defined by Köppen and was also used to predict the global vegetation distribution [3]. Other systems for delineating types based on climate variables include Holdridge life zones [4,5], Box models [6,7] and Whittaker’s biome types, though in the case of Whittaker’s biomes, predefined vegetation unites were mapped onto a climate space [8,9]. The predicted vegetation produced by biogeographical models (e.g., BIOME3 [10], dynamic global vegetation models, and bioclimatic maps [11]), is also mainly derived from an assumed relationship between functional types and climate variables. The ecoregions defined by Olson et al. [12] relied on climate data, expert judgment, and species assemblages to differentiate certain forest types. By mainly considering climate data, these methods define forest types that better describe the potential vegetation of an area. They may, however, fail to correspond with the actual vegetation, since this is defined by the interaction between the potential vegetation and multiple factors, such as human influence, species interactions, and biogeographical history.
Forest types were also defined in land-cover classifications. Land-cover classifications delineate vegetation types based on satellite imagery [13,14,15,16,17,18]. Functional biomes have also been defined using vegetation information [19]. Climatic vegetation types, on the other hand, try to reflect the regional vegetation characteristics in terms of climate by merging climate and NDVI data, and reveal the actual vegetation distribution, taking advantage of the positive aspects of both approaches [20]. Although this method showed great promise in Zhang et al. [20], the coarse resolution of the data, and the limited number of vegetation types used, resulted in a forest type distribution with relatively low accuracy. The forest attributes and their linkage to climate were also not well investigated in that study. A reanalysis and improved definition of the method in Zhang et al. [20] is timely, and it can provide a useful global forest type cartography that can more accurately represent actual vegetation distributions.
Different vegetation classifications are useful for different purposes. For example, climate-based vegetation classifications emphasize the distribution of vegetation types, while land use classifications highlight the role of land cover and human activity. It is important, consequently, to clarify the intent of new classifications. Our classification focuses on forest types, as they have been shown to be reliably characterized using satellite data [14,16]. An accurate definition of forest types is fundamental for preserving biodiversity [11] and forest ecological research (e.g., for studies that compare and explore the drivers of large-scale forest productivity [21]). To this end, forest types should reflect the actual main forest types present in different regions, but this is not guaranteed when using forest type classification based only on climate. For instance, the main forest type in the Northeast China Plain is temperate sub-humid broadleaf forest, and it is generally classified as cropland in land use and vegetation classifications [22], which does not properly capture the actual characteristics of the forested ecosystem. Classifications based only on normalized difference vegetation index (NDVI) values, on the other hand, would not separate different forest types with similar NDVI values but very different functional compositions [20]. We argue that forest types delineated to reflect the actual forest distribution using both vegetation and climate data will be more useful for multiple uses, from management to research [23].
We aim to create regionally and locally coherent maps of the global forest types that emphasize the forest role in every region, that could be useful for research and applied forest studies, and flexible enough to be easily updated as climate change or human actions alter the characteristics or distribution of forest types. To this end, we combined vegetation and climate data to refine the definition of forest types. Then, we compared NDVI values between different forest types to investigate how well these forest types were separated in our method.
2. Materials and Methods
2.1. Vegetation Data
NDVI is the most commonly used vegetation index to represent vegetation greenness. Monthly NDVI data at 8 km resolution were retrieved from the Advanced Very High Resolution Radiometer-based Global Inventory Modelling and Mapping Studies (AVHRR-GIMMS) dataset (https://ecocast.arc.nasa.gov/data/pub/gimms/3g.v1/, accessed on 1 July 2021) for 1982–2013 [24]. The data have been processed to reduce effects of navigation errors, major volcanic eruptions, and orbital drift of older satellites [25]. AVHRR-GIMMS NDVI product was found to be useful for studying linkage between land surface phenology and climate over wide range of vegetation [24]. NDVI values range from −1 to 1, where negative values represent an absence of vegetation and positive values indicate vegetated land. The average monthly NDVI values from 1982 to 2013 were used to reflect the mean state of vegetation dynamics.
Enhanced vegetation index (EVI) enhances the vegetation signal with improved sensitivity in high biomass regions. Monthly EVI data at 8 km resolution were retrieved from the website (https://www.usgs.gov/land-resources/nli/landsat/, accessed on 1 July 2021). EVI data were tested as a replacement for NDVI data.
2.2. Climate Data
We used a global gridded climate dataset with a spatial resolution of 1–18 km2 [26]. We used the average monthly values of mean temperature and total precipitation for 1970–2000 at a resolution of 8 km2, to match the resolution of NDVI data [26] (http://worldclim.org/version2, accessed on 1 July 2021).
Although the timespan of the climate data (1970–2000) slightly differs from that of the NDVI data (1983–2013), this climate dataset has been widely used as a reliable high-resolution climate dataset in bioclimatic studies [27,28]. In addition, the main purpose of this climate data is to reflect the long-term mean state of the climate for a comparable period to that of the forest type classification, and thus we do not expect time coverage differences between NDVI and climate data to affect our results.
2.3. Forest Type Classification
K-means method [29] had been proven to be an effective method in defining climate types, climatic vegetation types, and different forest types (e.g., [30,31,32,33,34]). The K-means method is an unsupervised clustering method that separates multivariable data into a given number of clusters according to their distances to the center of the clusters. Four steps are involved in implementing the algorithm. First, k centroids are randomly selected as initial centroids if the data are supposed to be classified into k groups. Second, each point is allocated to its nearest centroid. Third, the k centroids are recalculated and assigned as new centroids. Finally, steps two and three are iterated until the centroids are stable. Supervised classification methods, such as random forest, require training data to classify the forest types. However, the outcome of classification was not prior known before classification. Therefore, K-means method is more suitable to be used in forest type classification than supervised methods because it performs without training data.
NDVI is widely used to define vegetation types and land use types (e.g., [14,15,16,17]). Forest types with similar NDVI values were inspected using climate data to check climate differences in vegetation with similar NDVI. Consequently, our final forest type classification is based on monthly mean temperature, total precipitation, and NDVI data. The main advantage of this combinative approach is that types with similar NDVI values under different climate conditions can be separated.
Monthly mean temperatures in all the grid cells were listed in one row and arranged by 12 months to be an n × 12 matrix, as well as monthly total precipitation and NDVI. The precipitation was log-transformed to reduce the influence of unit as precipitation ranges from 0 to over 8000 cm. Hence, monthly mean temperature, total precipitation, and NDVI values were combined in an n × 36 matrix, X:
where T is monthly mean temperature, P is monthly mean precipitation after being log-transformed, NDVI is monthly NDVI value, m corresponds to the month number, and n is the number of all the grid cells in the global land area, except Antarctica. As the seasonal cycle of climate and vegetation in the Southern Hemisphere is opposite to that in the Northern Hemisphere, T, P, and NDVI in the Southern Hemisphere were adjusted to their corresponding months in the Northern Hemisphere, to make them comparable (see [20]). Then, the n columns were classified into k clusters based on the monthly multivariable attributes. The classification was implemented using stats package in R software [35].
Climate variables were rescaled to eliminate the potential influence of combining multiple units, using the following formula:
where Zi is the standard index, with a scale from 0 to 1, X is a variable, xi is every value in X, and max(X) and min(X) are the maximum and minimum X values, respectively.
A shortcoming of the K-means method is that the number of clusters should be defined beforehand. In our case, we chose to follow the number of forest types used by the GlobCover land-cover classification, created by the European Space Agency, which identified 12 different types related to forest. The resulting forest types were given descriptive names based on their annual temperature, precipitation, and NDVI values, trying to reflect the forest attribute and corresponding climatic conditions in each of them. The climatic modifiers in the names were designated following the criteria described in Table 1. Whether the tree cover was evergreen or deciduous was determined by the variation in monthly NDVI values and the related references [14,36,37]. The NDVI was low in winter if the type is dominated by deciduous trees.
We masked out ‘no forest’ regions to constrict our forest type distributions, using forest cover data [38]. Regions with lower than 20% tree cover were considered ‘no forest’. This matches the forest definition of the National Forest Inventory for forest inventory [39] and had been used previously in nearby studies [40,41]. The FAO forest definitions entail some flexibility regarding the tree cover threshold between 10% and 30%, creating a non-uniform definition for forest types [42]. While the 10% canopy-cover threshold in FAO’s definition has been used in some studies [43,44], it has also been criticized for including wooded grassland ecosystems [45], which have markedly different ecosystem dynamics. We decided to use a 20% minimum tree cover threshold, as it has been used for defining forest regions before [43,44]. It is important to note that the threshold used for defining forests will likely influence the definition and classification of forest types [42]. Thus, the research or management goal should be considered carefully when using a type classification, paying particular attention to the forest definition used.
The sensitivity of the global forest classification to the selected variables and the spatial resolution of selected variables were tested by changing the selected variable and changing the spatial resolution of selected variables.
We compared the resulting type distribution with the GlobCover land use maps (http://due.esrin.esa.int/, accessed on 1 July 2021). We also classified the forest type based on climate and EVI data to test whether EVI was a better vegetation indication than NDVI.
2.4. Climate Conditions in Every Forest Type
After classifying the forest types, we calculated the annual mean temperature, total annual precipitation, and mean NDVI value for every forest type to highlight their differences.
3. Results
3.1. Distribution of Forest Types
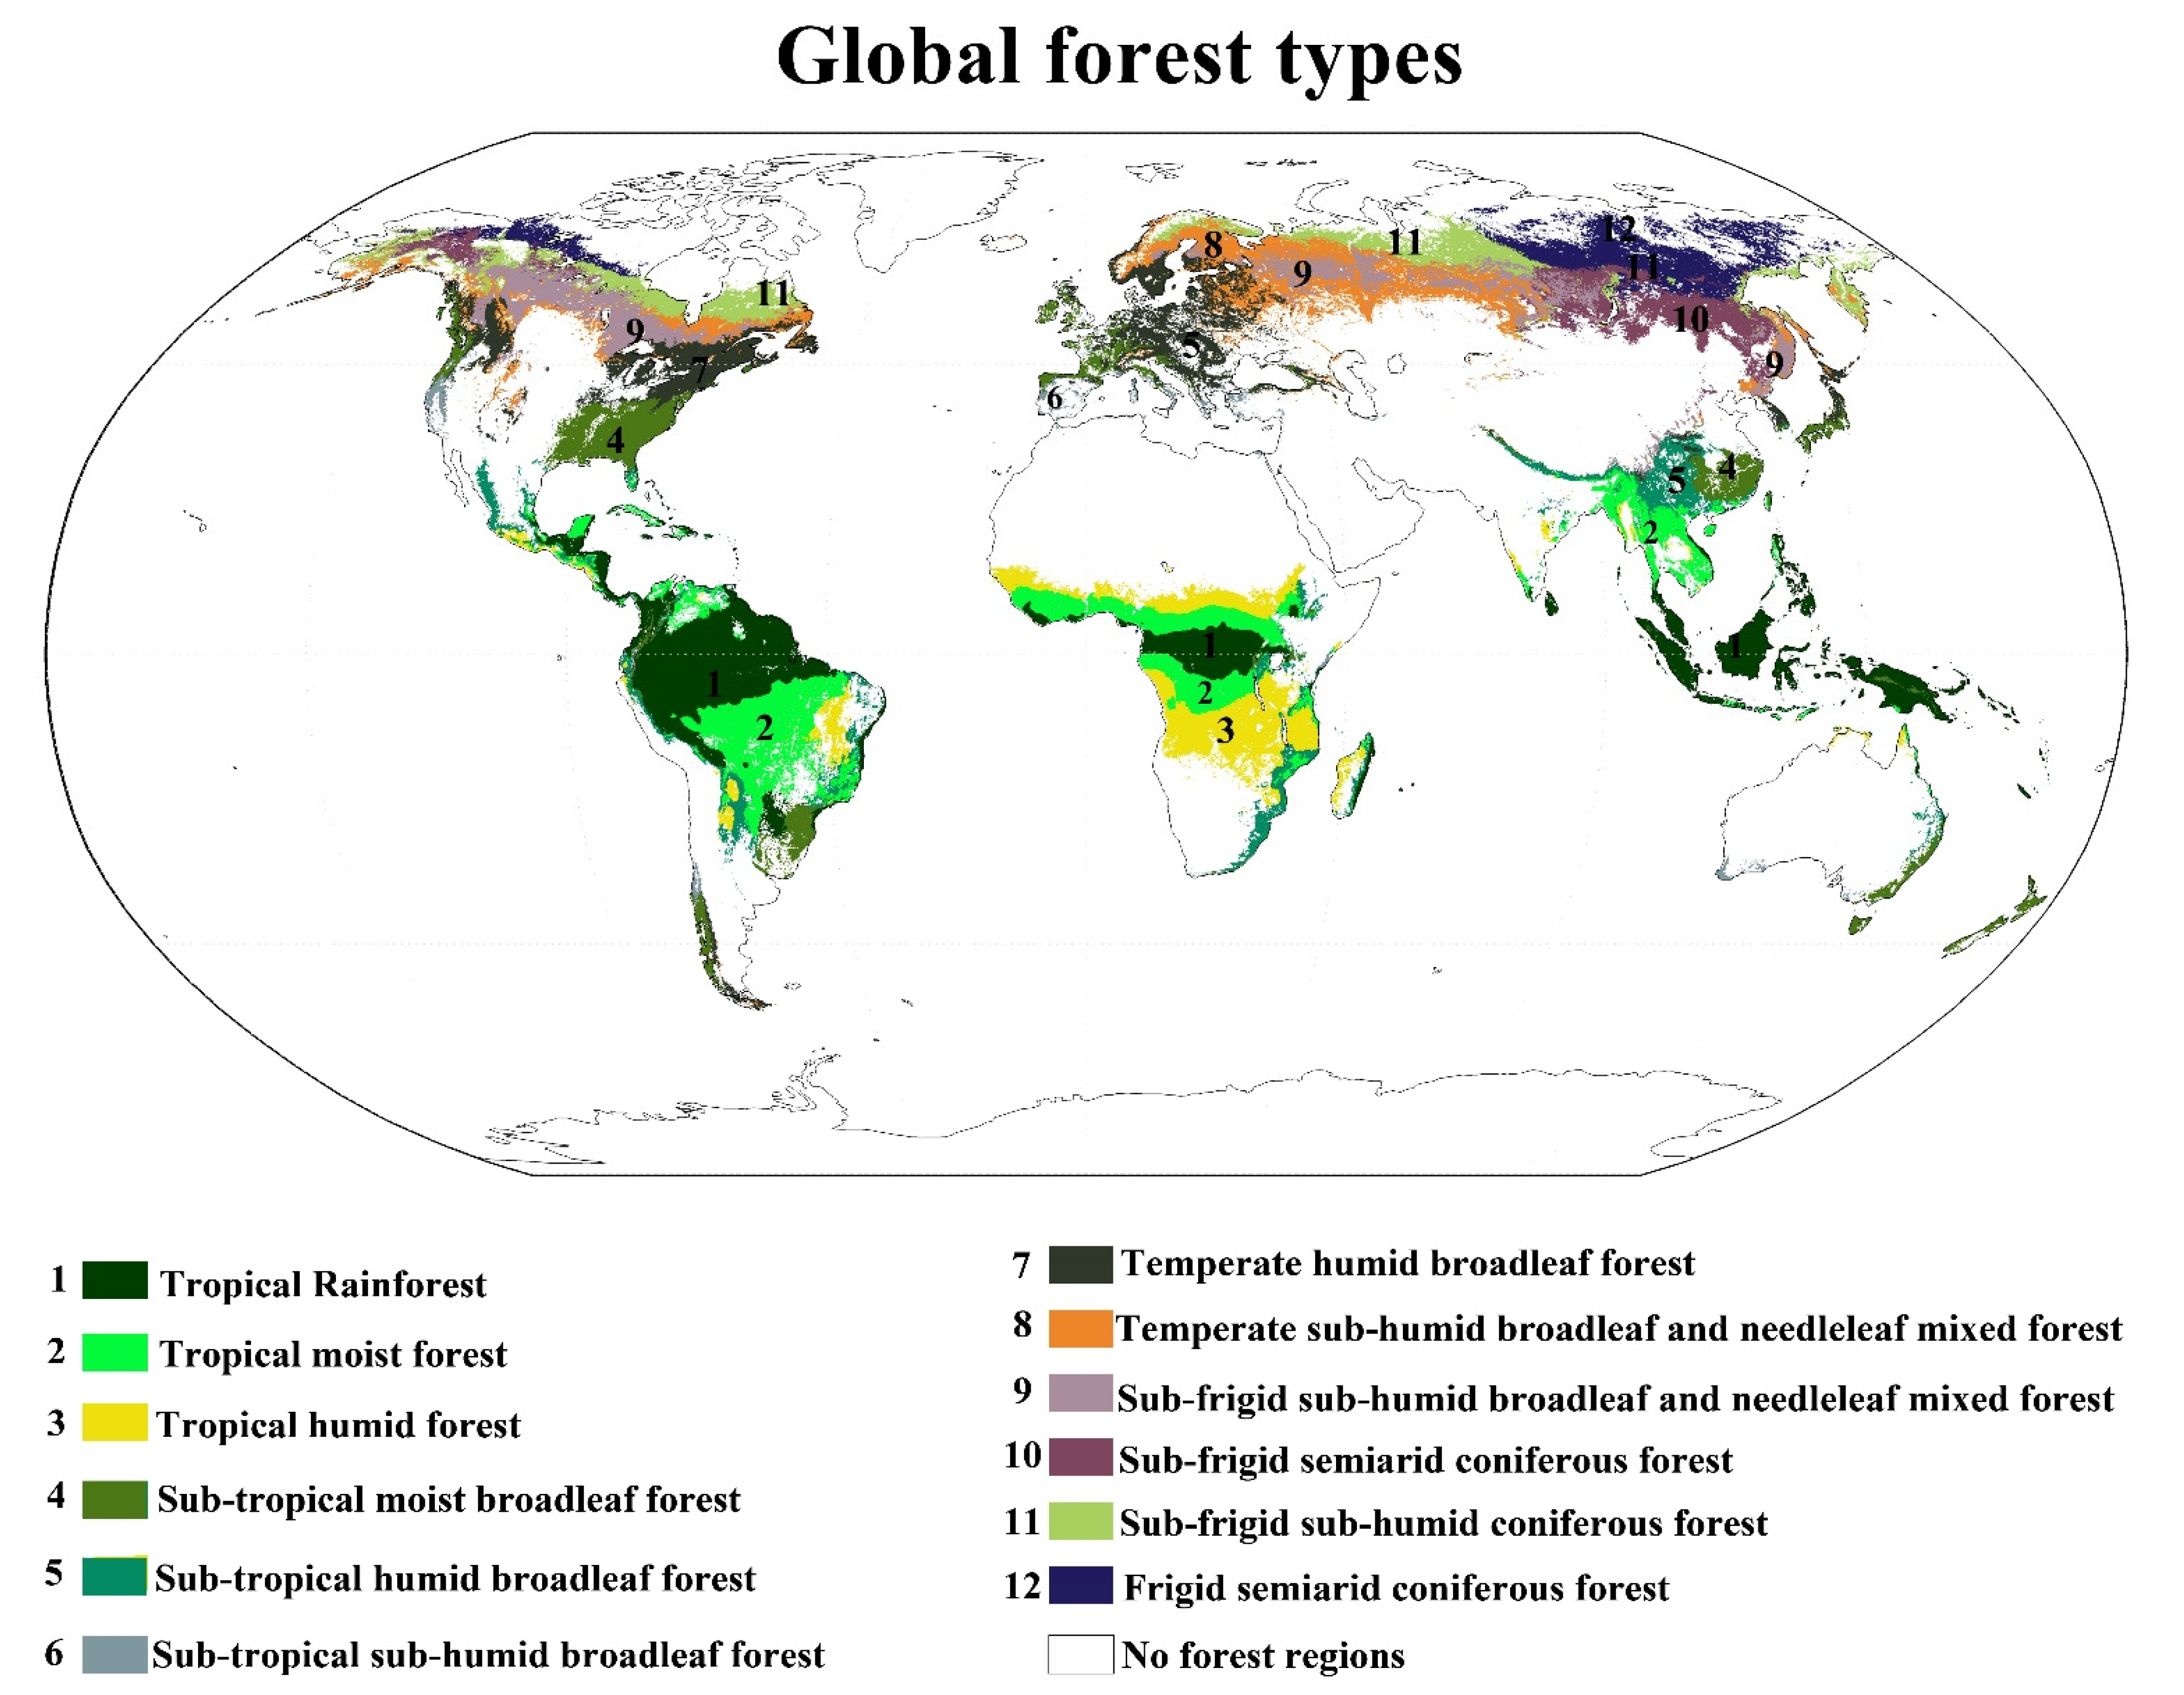
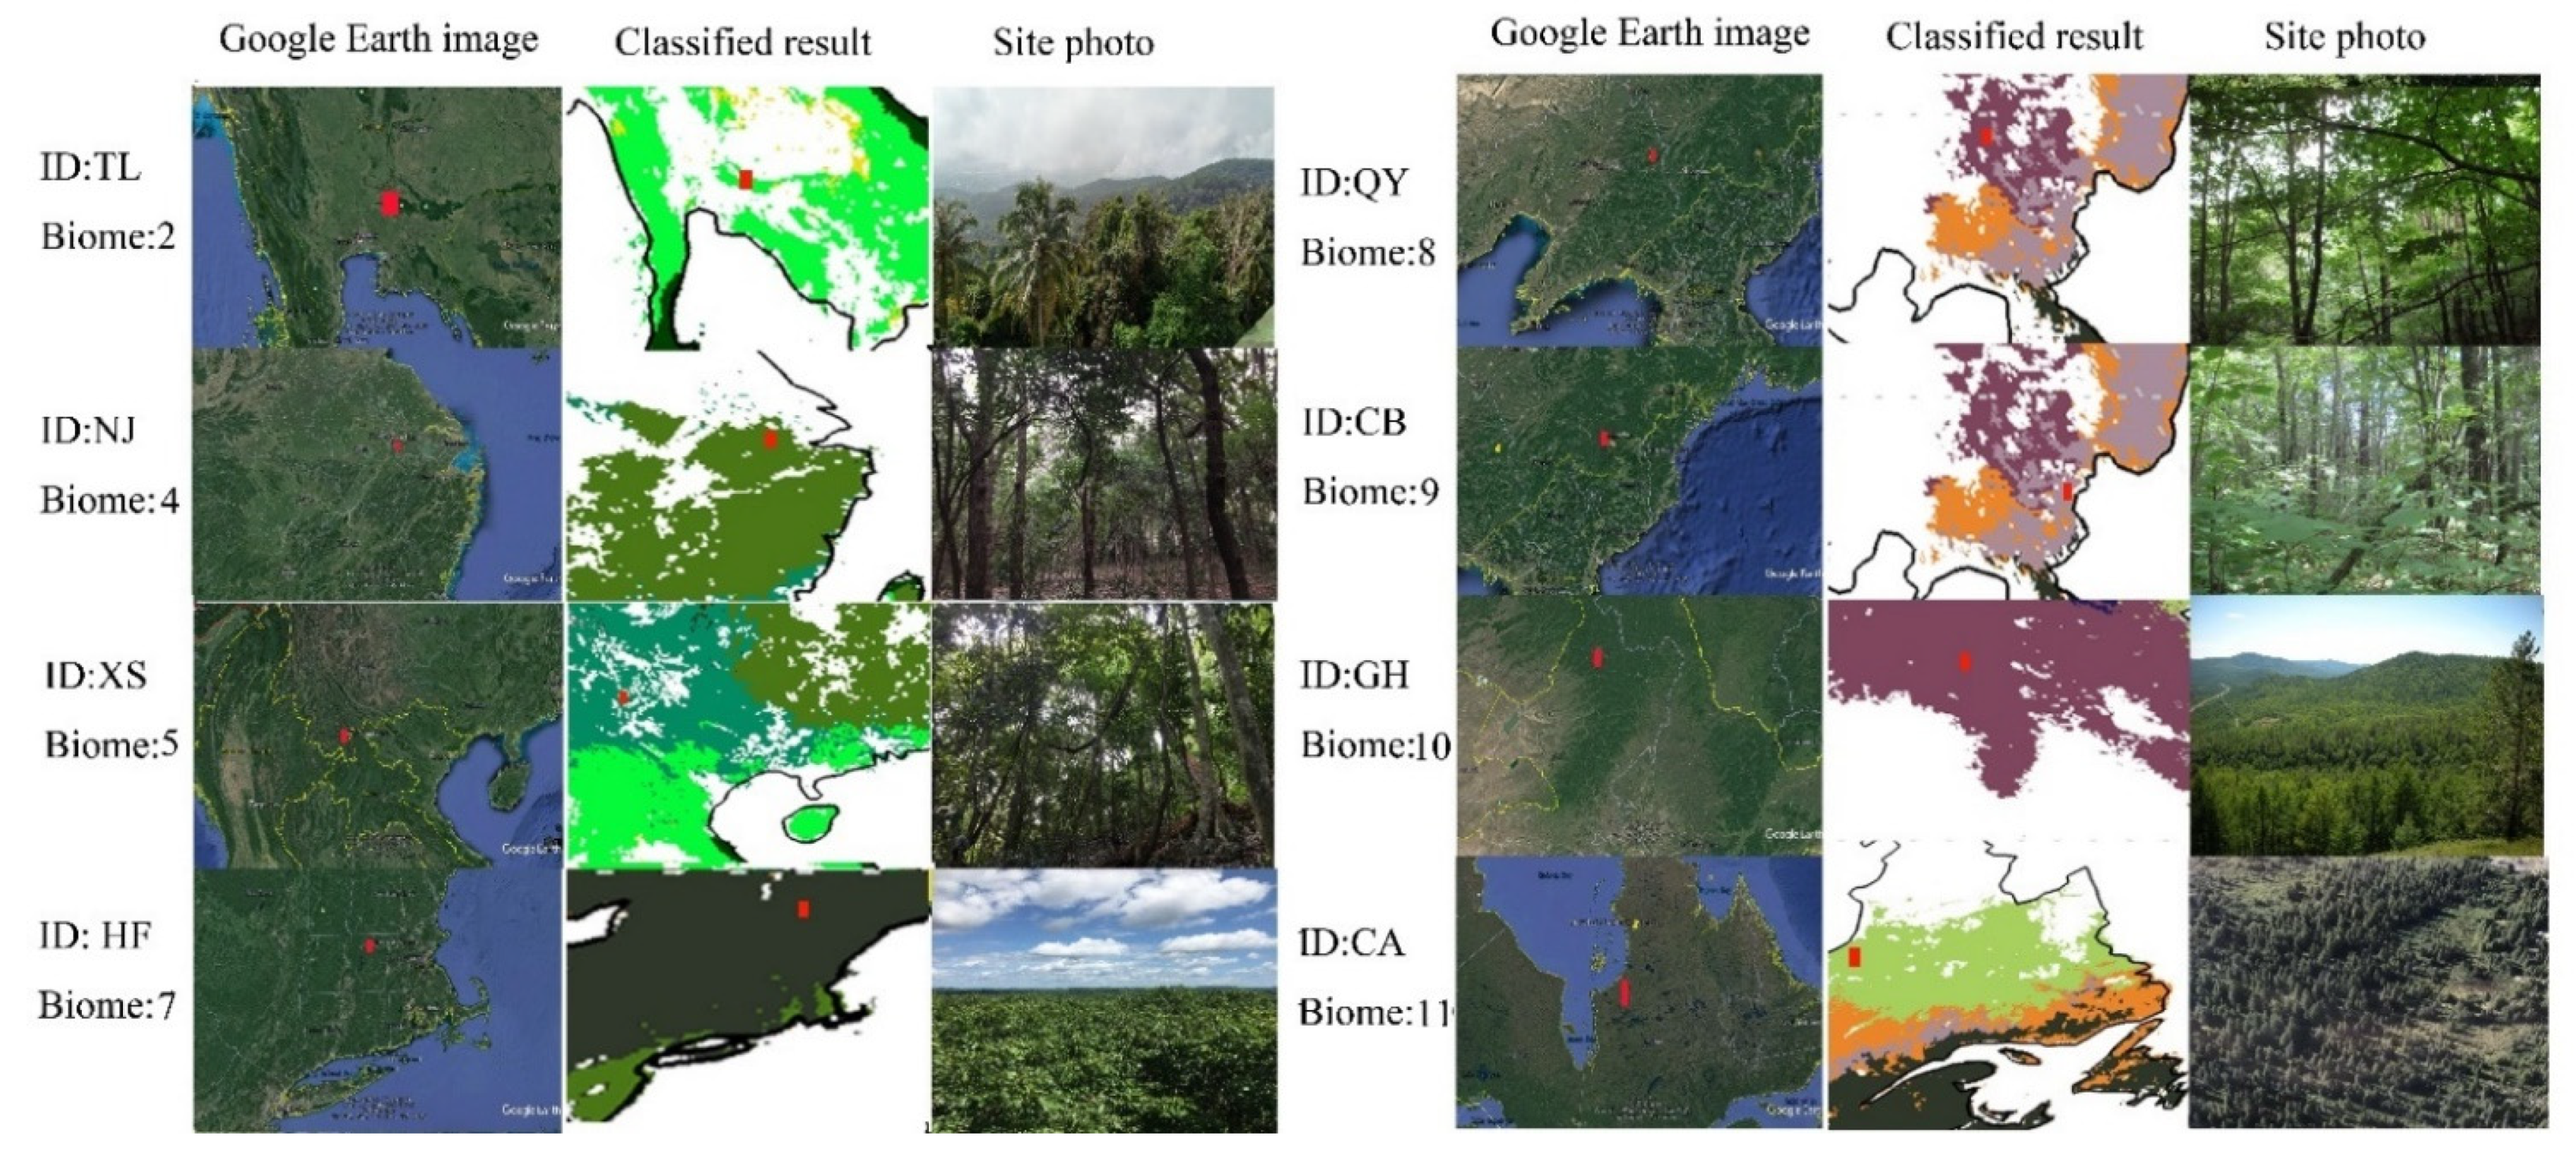
Twelve forest types were classified based on 8 km monthly NDVI, temperature, and precipitation data using the K-means method (Figure 1). Both vegetation and climate characteristics differed between different forest types (Table 2). The forest types were named based on their annual temperature, precipitation, and NDVI values (Table 2). We derived eight satellite images from Google Earth to compare our defined forest types in eight sites (Figure 2). The site pictures reflected the forest conditions in their defined forest types well. The other four types were not shown for the lack of photos.
3.1.1. Tropical Forests
Forest types 1 to 3 are tropical forests. Type 1 is along the equator. The local vegetation is rainforest; therefore, it is designated as a tropical rainforest. Type 2 is generally adjacent to type 1; however, the precipitation has stronger seasonal variations (Figure 3). The precipitation in type 2 is lower than that in type 1, so we designated it as a tropical moist forest. The vegetation in type 3 is sparse forest, and it is a tropical humid forest.
3.1.2. Subtropical Forests
Forest types 4 to 6 are subtropical forests. Broadleaf forests are the main landscapes. Type 4 includes mainly broadleaf forests in southeastern China and southeastern America and is termed a subtropical moist broadleaf forest. Type 5 includes broadleaf forests in southwestern China and it is a subtropical humid broadleaf forest. Type 6 is referred to as a subtropical sub-humid broadleaf forest and is located in the Mediterranean and western North America.
3.1.3. Temperate Forests
Forest types 7 to 8 are temperate forests. The types include a broadleaf forest and mixed forest. Type 7 includes a temperate forest in northeastern America and western Europe, termed a temperate humid broadleaf forest. Type 8 is a temperate sub-humid broadleaf and needleleaf mixed forest and is located in central Europe and Canada.
3.1.4. Sub-Frigid Forests
Forest types 9 to 11 are sub-frigid forests. Type 9 is mixed with Type 8, but had a lower temperature than type 8, and it is designated as a sub-frigid sub-humid broadleaf and needleleaf mixed forest. Type 10, a sub-frigid semiarid coniferous forest, includes the coniferous forest in southern Russia and northwestern Canada. Type 11, a sub-frigid sub-humid coniferous forest, is located in northern Eurasia and northern Canada.
3.1.5. Frigid Forests
Forest type 12 is a frigid forest with coniferous trees. A deciduous coniferous forest is the typical vegetation in northern Russia, so type 12 is a denominated frigid semiarid coniferous forest.
3.2. Robust of Forest Type Classification
Global forest classifications based on bioclimatic variables, including annual mean temperature, mean diurnal range, isothermality, temperature seasonality, max temperature of the warmest month, min temperature of the coldest month, the temperature’s annual range, mean temperature of the wettest quarter, mean temperature of the driest quarter, mean temperature of the warmest quarter, mean temperature of the coldest quarter, annual precipitation, precipitation of the wettest month, precipitation of the driest month, precipitation seasonality, precipitation of the wettest quarter, precipitation of the driest quarter, precipitation of the warmest quarter, and precipitation of the coldest quarter, produced forest types that had distinct climate and NDVI characteristics with above classification (Figure S1). Global forest types, classified based on maximum and minimum temperatures, total precipitation, and NDVI, are similar to those classified based on mean temperature, total precipitation and NDVI. Global forest types based on a 0.17 × 0.17° resolution mean temperature, total precipitation, and NDVI had similar results with those based on a 0.08 × 0.08° resolution dataset. However, global forest classification could not be well conducted based on a 0.5 × 0.5° resolution dataset. Therefore, our classification produced robust results on global forest classification.
3.3. Climatic Control on Global Distribution of Forest Types
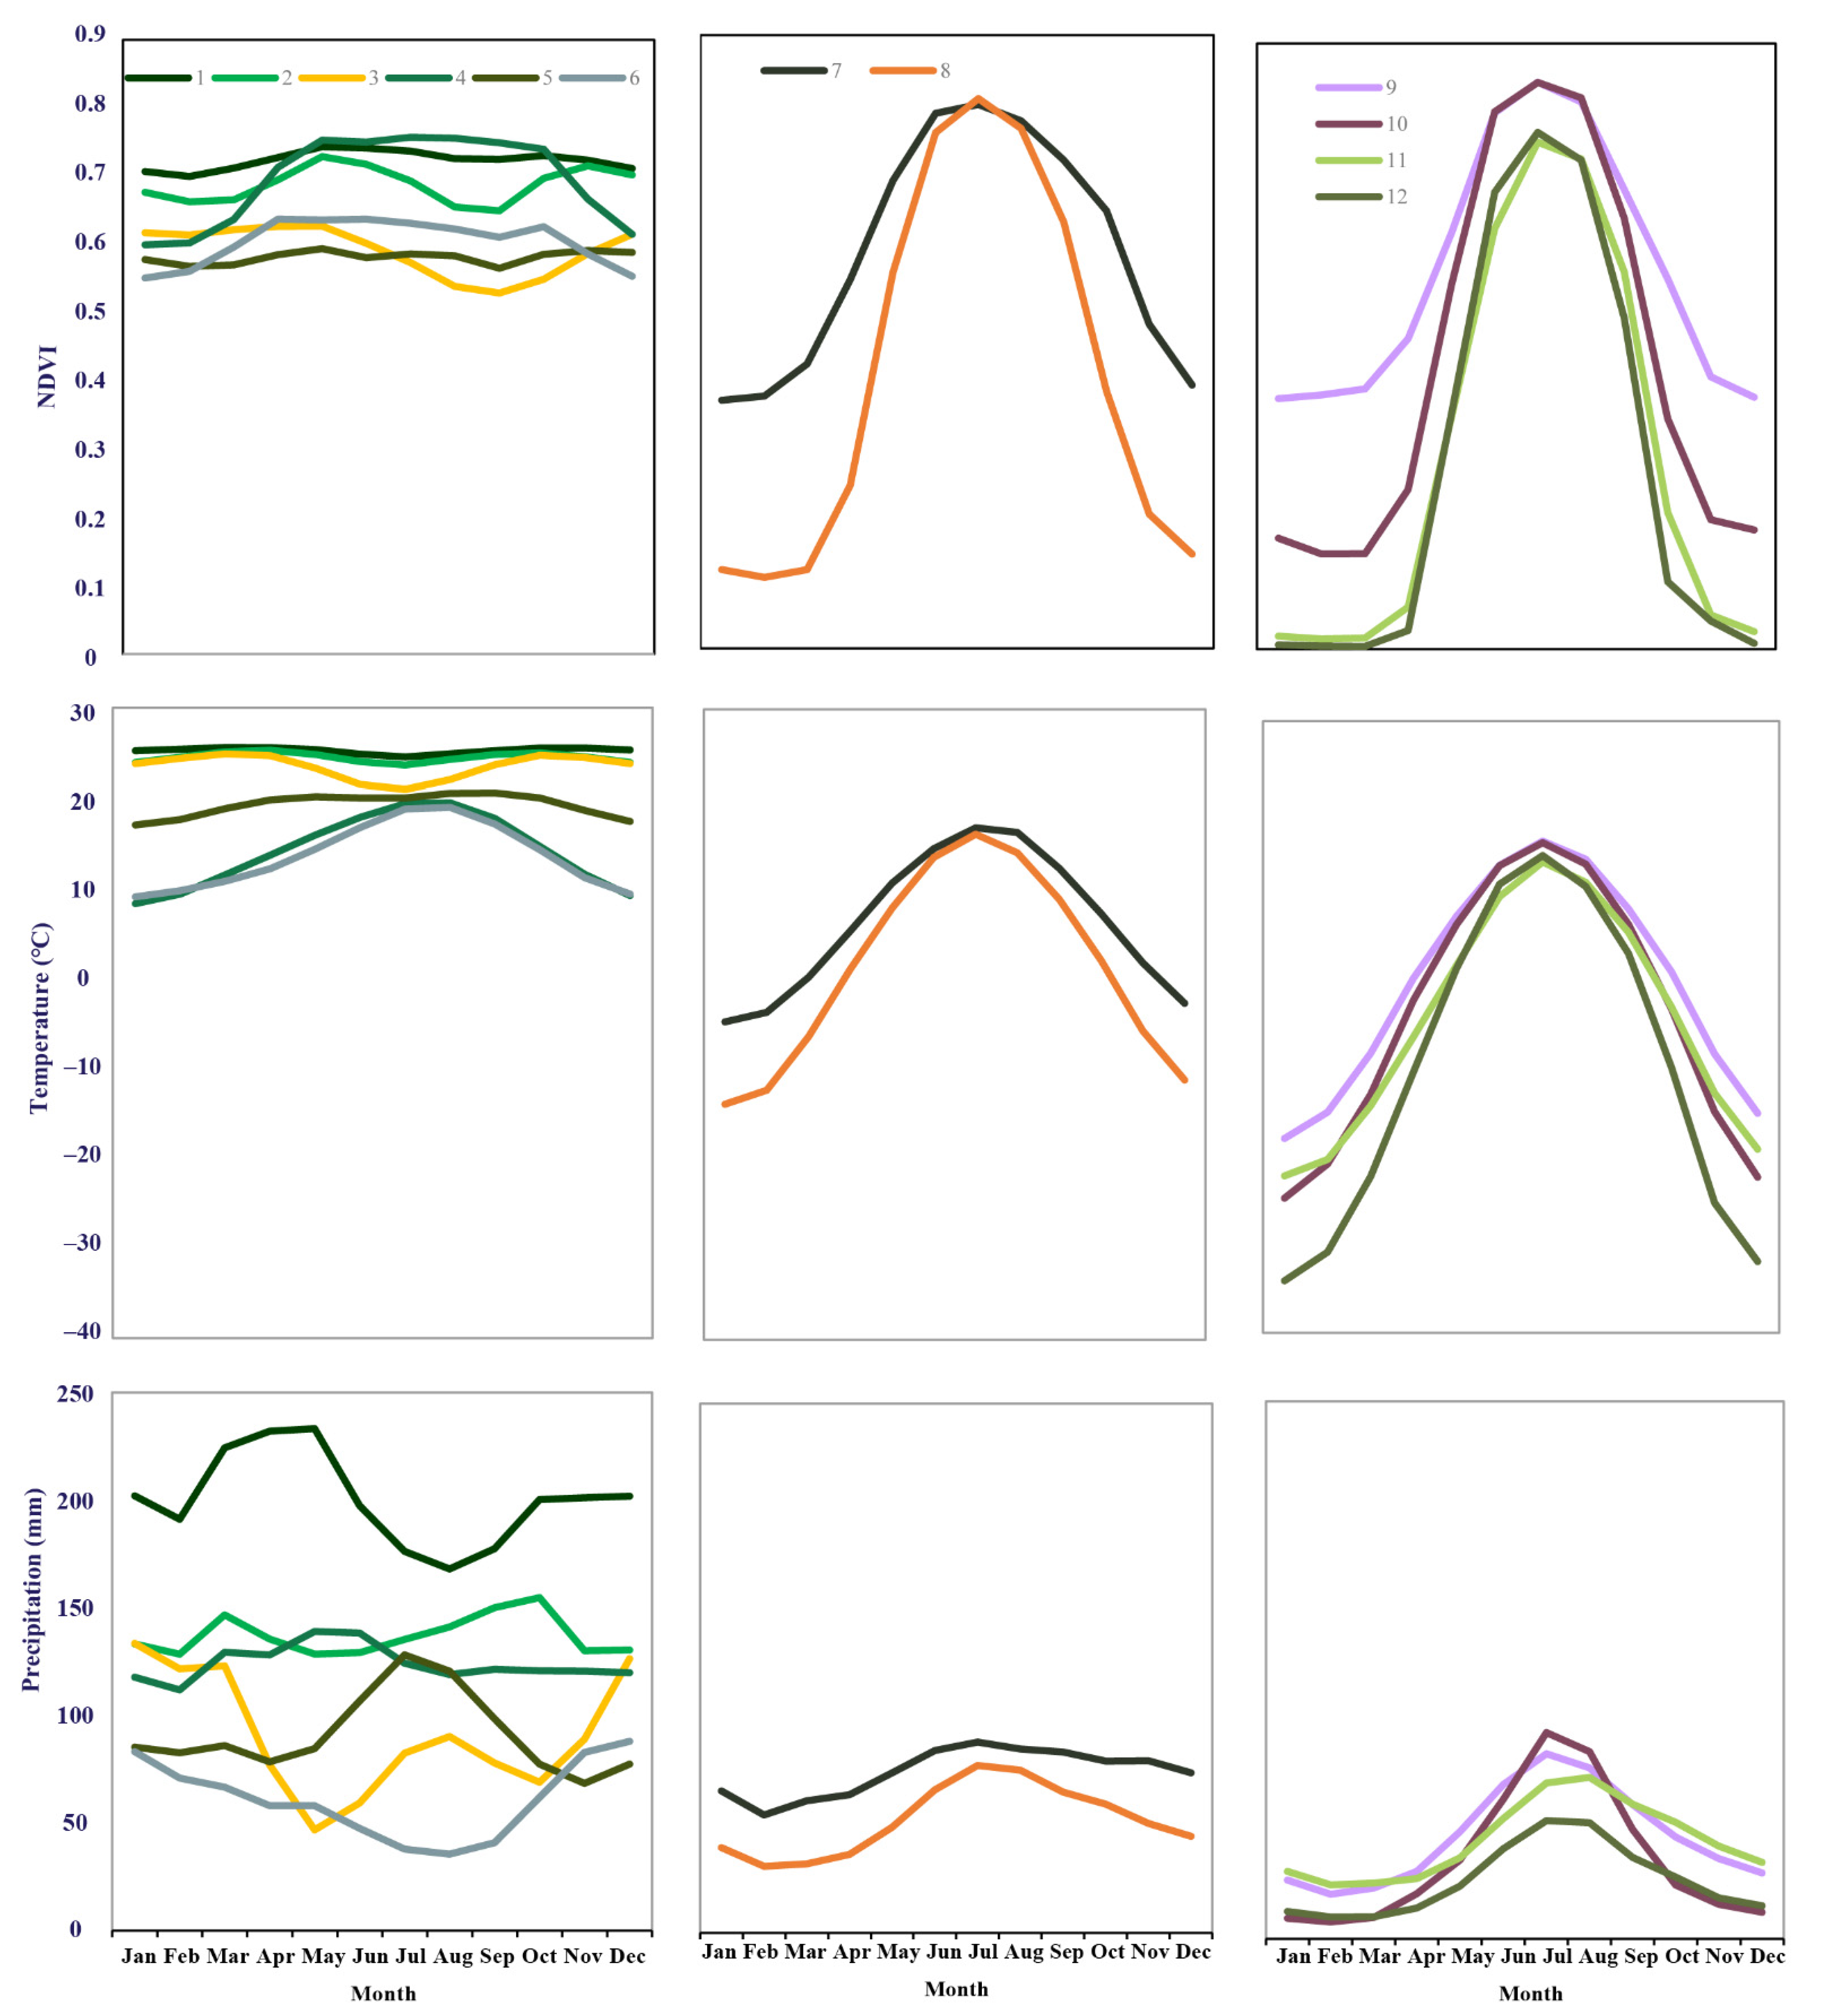
Forest types sharply differed in their monthly NDVI signatures (Figure 3). Rainforests and moist forests had high NDVI values throughout the year. Evergreen broadleaf forests had NDVI values greater than 0.4. Broadleaf forests and mixed broadleaf forests had low NDVI values in winter because of fallen leaves from the broadleaf trees. NDVI values in evergreen broadleaf forests ranged from 0.4 to 0.8. The winter NDVI values were lower than 0.05 in the frigid types, even in evergreen needleleaf forest.
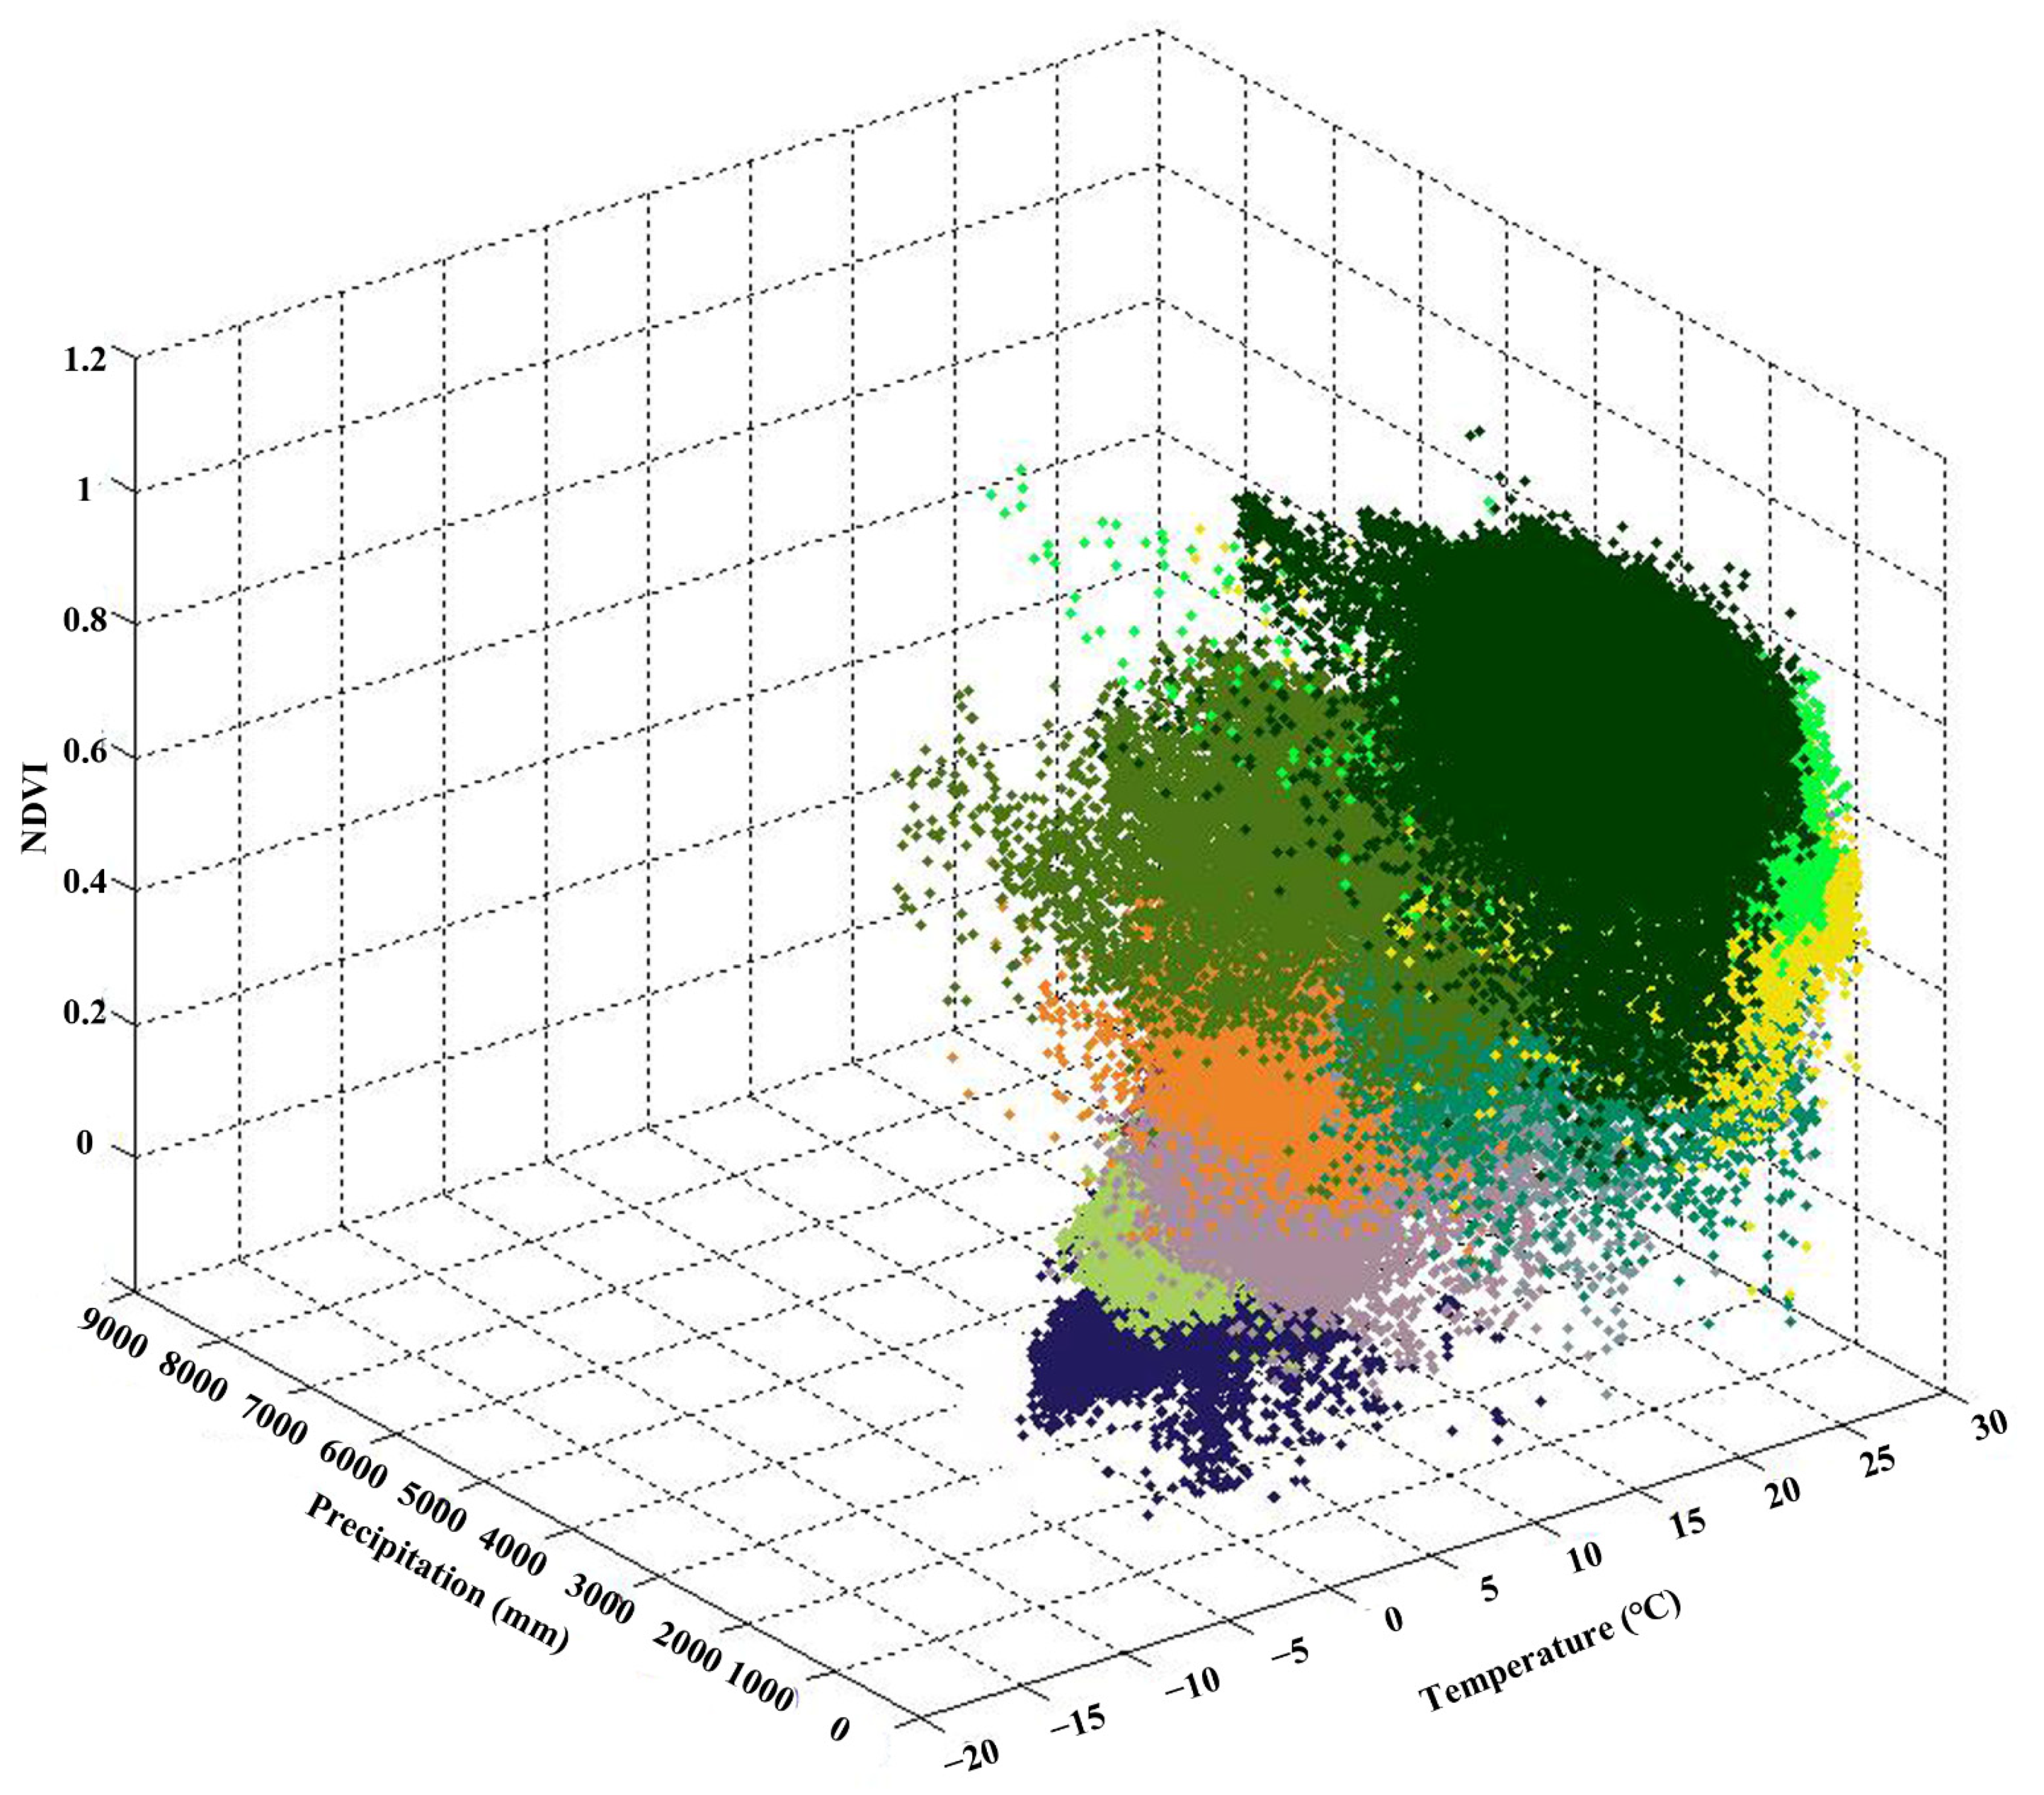
In general, forest types showed good differentiation and clustering in regard to temperature, precipitation, and vegetation parameters (Figure 4). Including the NDVI resulted in tighter and more compact forest type definitions than those of classifications based uniquely in precipitation and temperature, which showed blurred limits between forest types and discontinuous climatic envelopes (Figure 4). The temperature range of every forest type was roughly consistent with the criteria which we defined to describe the name of the forest type, and most forest types corresponded with wide precipitation ranges (Figure 4).
How NDVI values and climate attributes vary between forest types is illustrated using the example of the location of tropical and tropical monsoon rainforests (Figure 5). This example shows that the annual mean NDVI value of the tropical rainforest is much higher than that of the tropical monsoon rainforest (Figure 5B), as well as differing in the distribution patterns of annual mean temperature and total precipitation (Figure 5C,D).
Our method correctly identified both forest types. The comparison of our defined forest types with the GlobCover land-cover maps showed that the corresponding types were roughly distributed in similar regions (Figure S2). However, there are important differences between our classification and previous classifications at fine scales. The forest types defined based on climate and EVI data were not classified well, compared with those defined based on climate and NDVI data (Figure S3). For instance, the tropical rainforest was divided into two different types when compared with other vegetation classifications. Given the less spatially-consistent grouping when using EVI data, we considered this a less suitable option for the classification of forest types than NDVI data.
4. Discussion
We produced a high-resolution global forest type cartography, delineated using the K-means clustering method based on monthly NDVI, temperature, and precipitation data. In previous studies, forest types have been identified as potential vegetation based mainly on climate data (e.g., [3,6,10]), or as actual vegetation based on satellite imagery (e.g., [14,16]). By contrast, here we used a forest type definition that we believe is closer to the modern concept of type (discussed in [23,46]) by considering not only climate variation, but also the patterns of monthly changes in the actual vegetation. There were clear differences in the monthly variations of NDVI values, temperature, and precipitation between forest types. Compared to a climate-based classification, also considering NDVI values has the advantage of reflecting the realized rather than the potential types. The example of Africa in Figure 5 stresses this, showing how two tropical forest types could be well separated when we also consider NDVI as vegetation data. However, overall, our classification is still highly consistent with climate-based forest types and should be seen as a refinement of them, rather than a challenge to previous work.
There are clear differences in interpretation between our forest type classification and other vegetation classifications. Vegetation or land-cover-based classifications highlight the vegetation or land physical attributes, while our forest types emphasize the forest attributes. In addition, land cover classifications include human-transformed vegetation, such as pasture and urban buildings [47], while we masked out human-created types when identifying the forest regions. There is no detailed information on the forest types defined using land-cover and vegetation classification. Our classification improves the detail in forest types and contains more information on forest types than other vegetation classifications.
Our classification seems to accurately identify known forest ecosystems, whose climatic definitions were well separated. This is particularly important for distinct forest types that share similar NDVI values. For instance, we could clearly identify known sub-divisions of the boreal forest that could not be differentiated in an objective way using only climate, i.e., sub-frigid sub-humid deciduous coniferous forests, frigid semiarid coniferous forests, and sub-frigid sub-humid broadleaf and needleleaf mixed forests, clearly distinguishing sub-frigid from frigid coniferous ecosystems. The main difference between sub-frigid semiarid coniferous forests and frigid semiarid coniferous forests is that the main forest ecosystem in the former type is the larch-dominated bright coniferous forest while the sparse larch trees with shrub dominate in the latter forest type.
An important feature of our model is that it includes a dynamic definition of forest types. Since the NDVI is a characteristic of the vegetation and changes every year, the forest types defined by the NDVI can change with time, as the main vegetation evolves, or as a response to changing climate (e.g., [48]). That way, it is possible to regularly update the forest type classification, to keep the forest types accurate and to study the effect that a changing climate has on forested landscapes. However, in the short- and medium-timescale, we expect these forest types to be quite stable due to the rather stable signal of the long-term climate data (compared with a NDVI-only model).
It should be noted that there are some forest types that are not only determined by climate but also by edaphic and/or hydrological conditions, such as dry forests (vs. wooded grassland), riverine forests and swamp forests, which our approach is not able to differentiate. Another main limitation of our classification is that forest types occupying a small region (i.e., with an extension lower than that provided by the macroclimate data products we used), and those not having a distinct NDVI and climate to nearby forest types would be merged into nearby forest types. Tropical and temperate montane forests were not picked up by our clustering analysis, likely due to their limited spatial extension and lack of climate data resolution. Increasing data resolution across the world will alleviate this problem. Alternatively, including a proxy for ‘montane conditions’, such as, perhaps, relative elevation or a combination of solar radiation and exposition, would aid in this goal.
It is not easy to make a one-on-one comparison between forest type classifications because they differ in the number of types they consider, they are based on different datasets, and are designed for different purposes [19]. While there are important differences between our classification and previous classifications on fine scales, on a large scale our forest types tended to largely agree with corresponding land-cover types or vegetation types defined in previous studies [14,16]. GlobCover forest types had a high large scale agreement with ours (Figure S2). However, using better datasets, updating our methods, and including a larger number of types improved our ability to correctly identify the boundaries between different forest types at a finer scale. We also included self-descriptive forest labels, rather than types based on climate notation. These labels are easier and more intuitive to interpret for non-scientists. The result is a more accurate distribution of forest types, which will hopefully be more suitable for forestry and biogeographic studies.
5. Conclusions
We developed here a high-resolution global forest type classification cartography by integrating NDVI, temperature, and precipitation data. These forest types are largely consistent with previous type definitions, but also take explicitly into account the actual vegetation and their growth patterns. The distribution of forest types is freely available in (doi: 10.13140/RG.2.2.19197.90082, currently available in Figure S4).
Supplementary Materials
The following are available online at https://www.mdpi.com/article/10.3390/su14020634/s1, Figure S1: Global forest classifications with changing selected variables and the spatial resolution of selected variables. Global forest classification based on NDVI and bioclimatic variables (annual mean temperature, mean diurnal range, isothermality, temperature seasonality, max temperature of the warmest month, min temperature of the coldest month, temperature annual range, mean temperature of the wettest quarter, mean temperature of the driest quarter, mean temperature of the warmest quarter, mean temperature of the coldest quarter, annual precipitation, precipitation of the wettest month, precipitation of the driest month, precipitation seasonality, precipitation of the wettest quarter, precipitation of the driest quarter, precipitation of the warmest quarter and precipitation of the coldest quarter) (A), and classification based on maximum and minimum temperatures, precipitation, water vapor pressure, and NDVI data (B), and global forest classifications based on mean temperature, total precipitation, and the NDVI from 0.17 × 0.17° (C) and 0.5 × 0.5° (D) resolution dataset. Figure S2: Comparison between our forest types with the GlobCover land-cover map. Figure S3: Forest types defined based on climate and EVI data. The type colors are the same as those in Figure 1, but some types do not overlap with those in Figure 1, and they are marked with different colors. Figure S4: The GeoTIFF file for our forest types.
Author Contributions
C.X. and X.Z. processed the data, analyzed the results and wrote the majority of the manuscript. X.Z., R.D.M. designed the experiment and methodology. R.D.M., R.H.-C. participated in the manuscript writing, and reviewed and edited the earlier version. C.X., and W.L. participated in data processing and data collection. All authors have read and agreed to the published version of the manuscript.
Funding
This work was funded by the Education Department of Hebei Province (BJ2020025), the National Natural Science Foundation of China (41601045), and talents introduction program in Hebei Agricultural University (YJ201918). R.D.M. is supported by the Swiss National Science Foundation, through the Post.Doc Mobility program.
Institutional Review Board Statement
Not applicable.
Informed Consent Statement
Not applicable.
Data Availability Statement
The datasets used during the current study are available from the websites in the paper.
Conflicts of Interest
The authors declare no conflict of interest.
References
- Schimper, A.F.W.; Fisher, W.R.; Groom, P.; Balfour, I.B. Plant-Geography upon a Physiological Basis. Nature 1960, 70, 573–574. [Google Scholar]
- Schimper, A.F.W. Pflanzengeographie auf Physiologischer Grundlage; Engelmann, H.R., Ed.; Gustav Fischer: Jena, Germany, 1908; pp. 747–749. [Google Scholar]
- Köppen, W.P. Die Klimate der Erde; De Gruyter: Berlin, Germany, 1923. [Google Scholar]
- Holdridge, L.R. Life Zone Ecology; Tropical Science Center: San Jose, Costa Rica, 1967. [Google Scholar]
- Holdridge, L.R. Determination of World Plant Formations from Simple Climatic Data. Science 1947, 105, 367–368. [Google Scholar] [CrossRef] [PubMed]
- Shimwell, D.W.; Box, E.D.; Lieth, H. Macroclimate and Plant Forms: An Introdution to Predictive Modeling in Phytogeography. J. Appl. Ecol. 1982, 19, 993. [Google Scholar] [CrossRef]
- Box, E.O. Plant functional types and climate at the global scale. J. Veg. Sci. 1996, 7, 309–320. [Google Scholar] [CrossRef]
- Whittaker, R.H. Classification of natural communities. Bot. Rev. 1962, 28, 1–239. [Google Scholar] [CrossRef]
- Whittaker, R.H. Communities and Ecosystems; Princeton University Press: Princeton, NJ, USA, 1970; pp. 465–477. [Google Scholar]
- Haxeltine, A.; Prentice, I.C. BIOME3: An equilibrium terrestrial biosphere model based on ecophysiological constraints, resource availability, and competition among plant functional types. Glob. Biogeochem. Cycles 1996, 10, 693–709. [Google Scholar] [CrossRef]
- Metzger, M.J.; Bunce, R.G.H.; Jongman, R.H.G.; Sayre, R.; Trabucco, A.; Zomer, R. A high-resolution bioclimate map of the world: A unifying framework for global biodiversity research and monitoring. Glob. Ecol. Biogeogr. 2013, 22, 630–638. [Google Scholar] [CrossRef] [Green Version]
- Olson, D.M.; Dinerstein, E.; Wikramanayake, E.D.; Burgess, N.D.; Powell, G.V.N.; Underwood, E.C.; D’Amico, J.A.; Itoua, I.; Strand, H.E.; Morrison, J.C. Terrestrial Ecoregions of the World: A New Map of Life on Earth: A new global map of terrestrial ecoregions provides an innovative tool for conserving biodiversity. BioScience 2001, 51, 933–938. [Google Scholar] [CrossRef]
- DeFries, R.S.; Townshend, J.R.G. NDVI-derived land cover classifications at a global scale. Int. J. Remote Sens. 1994, 15, 3567–3586. [Google Scholar] [CrossRef]
- DeFries, R.S.; Hansen, M.C.; Townshend, J.R.G.; Janetos, A.C.; Loveland, T.R. A new global 1-km dataset of percentage tree cover derived from remote sensing. Glob. Change Biol. 2000, 6, 247–254. [Google Scholar] [CrossRef]
- De Fries, R.S.; Hansen, M.; Townshend, J.R.G.; Sohlberg, R. Global land cover classifications at 8 km spatial resolution: The use of training data derived from Landsat imagery in decision tree classifiers. Int. J. Remote Sens. 1998, 19, 3141–3168. [Google Scholar] [CrossRef]
- Loveland, T.R.; Reed, B.C.; Brown, J.F.; Ohlen, D.O.; Zhu, Z.; Yang, L.; Merchant, J.W. Development of a global land cover characteristics database and IGBP DISCover from 1 km AVHRR data. Int. J. Remote Sens. 2000, 21, 1303–1330. [Google Scholar] [CrossRef]
- Friedl, M.A.; McIver, D.K.; Baccini, A.; Gao, F.; Schaaf, C.; Hodges, J.C.F.; Zhang, X.Y.; Muchoney, D.; Strahler, A.H.; Woodcock, C.E.; et al. Global land cover mapping from MODIS: Algorithms and early results. Remote Sens. Environ. 2002, 83, 287–302. [Google Scholar] [CrossRef]
- Bartholomé, E.; Belward, A.S. GLC2000: A new approach to global land cover mapping from Earth observation data. Int. J. Remote Sens. 2005, 26, 1959–1977. [Google Scholar] [CrossRef]
- Higgins, S.I.; Buitenwerf, R.; Moncrieff, G. Defining functional biomes and monitoring their change globally. Glob. Change Biol. 2016, 22, 3583–3593. [Google Scholar] [CrossRef] [PubMed]
- Zhang, X.; Wu, S.; Yan, X.; Chen, Z. A global classification of vegetation based on NDVI, rainfall and temperature. Int. J. Clim. 2017, 37, 2318–2324. [Google Scholar] [CrossRef]
- Beck, P.S.A.; Juday, G.P.; Alix, C.; Barber, V.A.; Winslow, S.E.; Sousa, E.E.; Heiser, P.; Herriges, J.D.; Goetz, S. Changes in forest productivity across Alaska consistent with biome shift. Ecol. Lett. 2011, 14, 373–379. [Google Scholar] [CrossRef] [PubMed]
- Liu, J.; Melillo, J.M.; Tian, H.; Zhuang, D.; Zhang, Z. China’s changing landscape during the 1990s: Large-scale land transformations estimated with satellite data. Geophys. Res. Lett. 2005, 32. [Google Scholar] [CrossRef] [Green Version]
- Moncrieff, G.R.; Bond, W.J.; Higgins, S.I. Revising the biome concept for understanding and predicting global change impacts. J. Biogeogr. 2016, 43, 863–873. [Google Scholar] [CrossRef]
- Araghi, A.; Martinez, C.J.; Adamowski, J.; Olesen, J.E. Associations between large-scale climate oscillations and land surface phenology in Iran. Agric. For. Meteorol. 2019, 278, 107682. [Google Scholar] [CrossRef]
- Pinzon, J.E.; Tucker, C.J. A non-stationary 1981–2012 AVHRR NDVI3g time series. Remote Sens. 2014, 6, 6929–6960. [Google Scholar] [CrossRef] [Green Version]
- Fick, S.E.; Hijmans, R.J. WorldClim 2: New 1-km spatial resolution climate surfaces for global land areas. Int. J. Climatol. 2017, 37, 4302–4315. [Google Scholar] [CrossRef]
- Mammola, S.; Leroy, B. Applying species distribution models to caves and other subterranean habitats. Ecography 2018, 41, 1194–1208. [Google Scholar] [CrossRef] [Green Version]
- Thorne, J.H.; Choe, H.; Stine, P.A.; Chambers, J.C.; Holguin, A.; Kerr, A.C.; Schwartz, M.W. Climate change vulnerability assessment of forests in the Southwest USA. Clim. Change 2018, 148, 387–402. [Google Scholar] [CrossRef] [Green Version]
- Lloyd, S.P. Least squares quantization in PCM. IEEE Trans. Inf. Theory 1982, 28, 129–137. [Google Scholar] [CrossRef]
- Zhang, X.; Yan, X. Temporal change of climate zones in China in the context of climate warming. Arch. Meteorol. Geophys. Bioclimatol. Ser. B 2013, 115, 167–175. [Google Scholar] [CrossRef]
- Zhang, X.; Yan, X. Spatiotemporal change in geographical distribution of global climate types in the context of climate warming. Clim. Dyn. 2014, 43, 595–605. [Google Scholar] [CrossRef]
- Zhang, X.; Yan, X. Deficiencies in the simulation of the geographic distribution of climate types by global climate models. Clim. Dyn. 2015, 46, 2749–2757. [Google Scholar] [CrossRef]
- Zhang, X.; Yan, X.; Chen, Z. Geographic distribution of global climate zones under future scenarios. Int. J. Clim. 2017, 37, 4327–4334. [Google Scholar] [CrossRef]
- Zhang, X.; Huang, X. Human disturbance caused stronger influences on global vegetation change than climate change. PeerJ 2019, 7, e7763. [Google Scholar] [CrossRef]
- R Core Team. R: A Language and Environment for Statistical Computing; R Foundation for Statistical Computing: Vienna, Austria, 2018. Available online: http://www.R-project.org/ (accessed on 1 January 2022).
- Hansen, M.C.; DeFries, R.S.; Townshend, J.R.G.; Carroll, M.; Dimiceli, C.; Sohlberg, R.A. Global percent tree cover at a spatial resolution of 500 meters: First results of the MODIS vegetation continuous fields algorithm. Earth Interact. 2003, 7, 1–15. [Google Scholar] [CrossRef] [Green Version]
- Chen, J.; Chen, J.; Liao, A.; Cao, X.; Chen, L.; Chen, X.; He, C.; Han, G.; Peng, S.; Lu, M.; et al. Global land cover mapping at 30 m resolution: A POK-based operational approach. ISPRS J. Photogramm. Remote Sens. 2015, 103, 7–27. [Google Scholar] [CrossRef] [Green Version]
- Hansen, M.C.; Potapov, P.V.; Moore, R.; Hancher, M.; Turubanova, S.A.; Tyukavina, A.; Thau, D.; Stehman, S.V.; Goetz, S.J.; Loveland, T.R.; et al. High-resolution global maps of 21st-century forest cover change. Science 2013, 342, 850–853. [Google Scholar] [CrossRef] [Green Version]
- Lawrence, M.; McRoberts, R.E.; Tomppo, E.; Gschwantner, T.; Gabler, K. Comparisons of national forest inventories. In National Forest Inventories; Tomppo, E., Gschwantner, T., Lawrence, M., McRoberts, R., Eds.; Springer: Dordrecht, Germany, 2010; pp. 19–32. [Google Scholar]
- Bastin, J.-F.; Berrahmouni, N.; Grainger, A.; Maniatis, D.; Mollicone, D.; Moore, R.; Patriarca, C.; Picard, N.; Sparrow, B.; Abraham, E.M.; et al. The extent of forest in dryland biomes. Science 2017, 356, 635–638. [Google Scholar] [CrossRef] [Green Version]
- Schmitt, C.B. Global tropical forest types as support for the consideration of biodiversity under REDD+. Carbon Manag. 2013, 4, 501–517. [Google Scholar] [CrossRef]
- Schmitt, C.B.; Burgess, N.D.; Coad, L.; Belokurov, A.; Besançon, C.; Boisrobert, L.; Campbell, A.; Fish, L.; Gliddon, D.; Humphries, K.; et al. Global analysis of the protection status of the world’s forests. Biol. Conserv. 2009, 142, 2122–2130. [Google Scholar] [CrossRef]
- Zhang, D.; Wang, H.; Wang, X.; Lü, Z. Accuracy assessment of the global forest watch tree cover 2000 in China. Int. J. Appl. Earth Obs. Geoinf. 2020, 87, 102033. [Google Scholar] [CrossRef]
- Song, D.-X.; Huang, C.; Noojipady, P.; Channan, S.; Townshend, J. Comparison of remote sensing based forest area and change estimation with national forestry inventory between 2000 and 2005 in China. Proceedings of 2014 IEEE Geoscience and Remote Sensing Symposium, Quebec City, QC, Canada, 13–18 July 2014; pp. 4268–4271. [Google Scholar]
- Griffith, D.M.; Lehmann, C.E.R.; Strömberg, C.A.E.; Parr, C.L.; Pennington, R.T.; Sankaran, M.; Ratnam, J.; Still, C.J.; Powell, R.L.; Hanan, N.P.; et al. Comment on “The extent of forest in dryland biomes”. Science 2017, 358, 1309. [Google Scholar] [CrossRef] [PubMed] [Green Version]
- Mucina, L. Biome: Evolution of a crucial ecological and biogeographical concept. New Phytol. 2019, 222, 97–114. [Google Scholar] [CrossRef] [PubMed] [Green Version]
- Ellis, E.; Goldewijk, K.K.; Siebert, S.; Lightman, D.; Ramankutty, N. Anthropogenic transformation of the biomes, 1700 to 2000. Glob. Ecol. Biogeogr. 2010, 19, 589–606. [Google Scholar] [CrossRef]
- Scheffer, M.; Hirota, M.; Holmgren, M.; van Nes, E.; Chapin, F.S. Thresholds for boreal biome transitions. Proc. Natl. Acad. Sci. USA 2012, 109, 21384–21389. [Google Scholar] [CrossRef] [PubMed] [Green Version]
Figure 1.
Geographic distribution of forest types classified based on 8 km resolution monthly vegetation and climate data. Forest was defined as tree cover over 20% threshold value.
Figure 1.
Geographic distribution of forest types classified based on 8 km resolution monthly vegetation and climate data. Forest was defined as tree cover over 20% threshold value.

Figure 2.
Comparison of our forest types with Google Earth images in eight ground-truth points. ID represents the photo site TL (14.5° N, 101.5° E), NJ (31.1° N, 118.8° E), (XS (21.9° N, 101.2° E), HF (42.5° N, 72.15° S), QY (41.8° N, 124.9° E), CB (41.9° N, 127.8° E), GH (50.8° N, 121.5° E), CA (57.8° N, 76.1° S). Type ID was same as that in Table 2. The red color marked the location of photo site. The other four types were not listed due to our lack of photos for them.

Figure 3.
Monthly NDVI, temperature, and precipitation data for each type. See type names in Figure 1. The type colors are same as those in Figure 1.

Figure 4.
The corresponding annual mean temperature, total precipitation and NDVI for every forest type. The type colors are same as those in Figure 1.
Figure 4.
The corresponding annual mean temperature, total precipitation and NDVI for every forest type. The type colors are same as those in Figure 1.

Figure 5.
The boundary between tropical rainforest and tropical monsoon rainforest defined in our study (A), and the distributions of NDVI values (B), annual temperature (°C, C), and annual total precipitation (mm, D) in these regions. The type colors are same as those in Figure 1.
Figure 5.
The boundary between tropical rainforest and tropical monsoon rainforest defined in our study (A), and the distributions of NDVI values (B), annual temperature (°C, C), and annual total precipitation (mm, D) in these regions. The type colors are same as those in Figure 1.


Table 1.
Criteria used to assign forest type names.
| Climate Variables | Label | Criteria |
|---|---|---|
| Annual Temperature (°C) | Tropical | >20 |
| Sub-Tropical | (10, 20] | |
| Temperate | (0, 10] | |
| Sub-frigid | (−5, 0] | |
| Frigid | (−15, −5] | |
| Annual Precipitation (mm) | Rain | >2000 |
| Moist | (1200, 2000] | |
| Humid | (800, 1200] | |
| Sub-humid | (400, 800] | |
| Semiarid | (200, 400] |
Table 2.
Forest types and their annual NDVI values, temperature (°C), and precipitation (mm).
| Code | Type | Mean Annual NDVI | Mean Annual Temperature (°C) | Total Annual Precipitation (mm) |
|---|---|---|---|---|
| 1 | Tropical rainforest | 0.72 ± 0.09 | 25.2 ± 1.9 | 2404.6 ± 677 |
| 2 | Tropical moist forest | 0.69 ± 0.08 | 24.5 ± 2.0 | 1644.5 ± 512 |
| 3 | Tropical humid forest | 0.59 ± 0.07 | 23.5 ± 2.7 | 1096.9 ± 394 |
| 4 | Sub-tropical moist broadleaf forest | 0.70 ± 0.08 | 14.0 ± 3.8 | 1490.9 ± 577 |
| 5 | Sub-tropical humid broadleaf forest | 0.58 ± 0.10 | 19.2 ± 4.3 | 1094.9 ± 390 |
| 6 | Sub-tropical sub-humid broadleaf forest | 0.60 ± 0.12 | 13.5 ± 3.6 | 732.3 ± 296 |
| 7 | Temperate humid broadleaf forest | 0.58 ± 0.07 | 6.3 ± 2.7 | 913.2 ± 402 |
| 8 | Temperate sub-humid broadleaf and needleleaf mixed forest | 0.40 ± 0.05 | 1.2 ± 2.5 | 639.9 ± 234 |
| 9 | Sub-frigid sub-humid broadleaf and needleleaf mixed forest | 0.56 ± 0.04 | −0.1 ± 2.3 | 567.9 ± 144 |
| 10 | Sub-frigid semiarid coniferous forest | 0.42 ± 0.05 | −3.6 ± 2.7 | 437.4 ± 200 |
| 11 | Sub-frigid sub-humid coniferous forest | 0.28 ± 0.06 | −4.4 ± 2.2 | 547.3 ± 145 |
| 12 | Frigid semiarid coniferous forest | 0.27 ± 0.05 | −10.1 ± 2.4 | 323.7 ± 91 |
Publisher’s Note: MDPI stays neutral with regard to jurisdictional claims in published maps and institutional affiliations. |
© 2022 by the authors. Licensee MDPI, Basel, Switzerland. This article is an open access article distributed under the terms and conditions of the Creative Commons Attribution (CC BY) license (https://creativecommons.org/licenses/by/4.0/).
Share and Cite
MDPI and ACS Style
Xu, C.; Zhang, X.; Hernandez-Clemente, R.; Lu, W.; Manzanedo, R.D. Global Forest Types Based on Climatic and Vegetation Data. Sustainability 2022, 14, 634. https://doi.org/10.3390/su14020634
AMA Style
Xu C, Zhang X, Hernandez-Clemente R, Lu W, Manzanedo RD. Global Forest Types Based on Climatic and Vegetation Data. Sustainability. 2022; 14(2):634. https://doi.org/10.3390/su14020634
Chicago/Turabian StyleXu, Chen, Xianliang Zhang, Rocío Hernandez-Clemente, Wei Lu, and Rubén D. Manzanedo. 2022. "Global Forest Types Based on Climatic and Vegetation Data" Sustainability 14, no. 2: 634. https://doi.org/10.3390/su14020634
Note that from the first issue of 2016, this journal uses article numbers instead of page numbers. See further details here.