Article

Model Validation of a Porous Piezoelectric Energy Harvester Using Vibration Test Data

by
Germán Martínez-Ayuso
1,*,
Hamed Haddad Khodaparast
1,
Yan Zhang
2,
Christopher R. Bowen
2,
Michael I. Friswell
1,
Alexander D. Shaw
1 and
Hadi Madinei
1
1
College of Engineering, Bay Campus, Swansea University, Fabian Way, Crymlyn Burrows, Swansea SA1 8EN, UK
2
Department of Mechanical Engineering, University of Bath, Claverton Down, Bath BA2 7AY, UK
*
Author to whom correspondence should be addressed.
Vibration 2018, 1(1), 123-137; https://doi.org/10.3390/vibration1010010
Submission received: 19 June 2018 / Revised: 8 August 2018 / Accepted: 14 August 2018 / Published: 18 August 2018

Abstract

:
In this paper, a finite element model is coupled to an homogenisation theory in order to predict the energy harvesting capabilities of a porous piezoelectric energy harvester. The harvester consists of a porous piezoelectric patch bonded to the root of a cantilever beam. The material properties of the porous piezoelectric material are estimated by the Mori–Tanaka homogenisation method, which is an analytical method that provides the material properties as a function of the porosity of the piezoelectric composite. These material properties are then used in a finite element model of the harvester that predicts the deformation and voltage output for a given base excitation of the cantilever beam, onto which the piezoelectric element is bonded. Experiments are performed to validate the numerical model, based on the fabrication and testing of several demonstrators composed of porous piezoelectric patches with different percentages of porosity bonded to an aluminium cantilever beam. The electrical load is simulated using a resistor and the voltage across the resistor is measured to estimate the energy generated. The beam is excited in a range of frequencies close to the first and second modes using base excitation. The effects of the porosity and the assumptions made for homogenisation are discussed.

1. Introduction

Piezoelectric materials can act as sensors or actuators in engineering structures. Embedded sensors in structures are an important application of piezoelectric materials and are used to track strain and damage in structures such as buildings, aircraft and bridges. Wireless sensor networks are increasingly being used in areas such as the aerospace industry, where control and monitoring of slender and light-weight structures is becoming more important. Furthermore, these sensors can also harvest energy, in addition to measuring the deformation. The energy harvesting capability of these sensors must be optimised by carefully selecting their configuration and appropriate materials selection. Porous piezoelectric materials have shown promise as sensors and energy harvesters due to their beneficial figures of merit when the porosity is increased.
Traditionally, porosity has been considered a defect in the fabrication process or a non-valuable property in many applications, such as concrete fabrication, steelworks industry or polymers manufacture. Recent scientific advances in last decades are changing the perception of porosity by both scientists and engineers [1]. Different authors have suggested possible applications of porosity in different fields, from construction using porous metals [2] to bioengineering using porous titanium in bones implants [3]. The aerospace industry is interested in such materials for their good thermal isolation properties and reduced weight [4]. Porous silicon has been proposed for important electronic applications [5]. Some authors [6,7,8,9] studied porous ceramics from different points of view such as thermal shock isolation, catalyst supports, etc. However, less attention has been given to porous ceramics for energy harvesting. Energy harvesting is the ability of devices to scavenge energy from energy sources in the surrounding environment such as vibrations, light or thermal gradients. Piezoelectric ceramics have been studied recently not only for their energy harvesting capabilities but also for their sensor and actuator capability. These materials have important applications such as ink-jet printers, sonar transducers, heart rate monitors, hydrophones, air bag sensors, etc. When acting as a sensor they can be used for structural health monitoring (SHM) or to power small devices. Sodano et al. [10] presented an extensive review of the applications of piezoelectric materials to energy harvesting. These materials might be organic, such as ZnO or Polyvinylidenefluoride (PVDF) [11], or inorganic such as PZT-5A or BaTiO 3 [12]. Friswell and Adhikari have explored the possibilities of piezoelectric devices to harvest energy from non-linear vibration [13] and from broadband excitation [14]. Erturk and Inman [15] studied the broadband high-energy orbits in a bistable piezomagnetoelastic energy harvester over a wide range of excitation frequencies. They illustrated that the axial static load can be used to tune the system over a wide range of frequencies. Madinei et al. [16] investigated an adaptive tuned piezoelectric vibration energy harvesting system based on the use of electrostatic forces. They showed that the resonance frequency of the piezoelectric harvester can be controlled by applying direct current (DC) to the electrostatic system. Neiss et al. [17] investigated the influence of soft and hard piezoceramic materials on bandwidth and power output for a nonlinear energy harvesting device. They concluded soft ceramics have stronger piezoelectric coefficients but a lower mechanical quality compared to hard ceramics. Cammarano et al. [18] studied the impact of the resistive load on the energy harvesters with a stiffening nonlinearity. They found that nonlinear energy harvesters with stiffening nonlinearities have similar optimal resistance loads, allowing to reach levels of voltage output to the linear counterpart on a wider range of frequencies. Other authors focused on optimising the geometry of the harvesters such as Zhou et al. [19] who developed a zigzag structure to enhance the power output or Masana and Daqaq [20] who developed an electromechanical nonlinear model of an axially loaded energy harvester. In [21], the effect of the pore shape on the electrical properties is studied experimentally. The authors highlight that elongated pores have lower permittivity and higher g 33 (electric field per stress ratio) coefficient with respect to spheres inclusions or non-porous samples. Bowen et al. [22] studied how the porosity affects the piezoelectric and dielectric coefficients. Roscow [23] reviewed the manufacturing process of porous piezoelectric materials. In Reference [24], the authors analysed the possibility of harvesting energy from porous piezoelectric materials using impact as a source of vibration. To the best of the authors’ knowledge, there are no studies that treat porous piezoelectric ceramics for energy harvesting comparing simulation results and experimental testing for this new composite.
An experimental study was performed over a novel material such as the porous piezoelectric ceramics in order to validate the applicability of homogenisation theories and finite element approaches for energy harvesting applications of these material. The capability of porous piezoelectric material for harvest energy was assessed by comparing the predictions from an homogenised numerical model with those obtained experimentally. Due to the variability of results in the experimental tests available in the literature [22,23], it is desirable to use an analytical method which allows us to obtain estimates prior to the fabrication of the demonstrators. The composite material is homogenised using analytical theories such as Mori–Tanaka and included in a numerical model based on the finite element method which includes the geometry of the energy harvester. The porous piezoelectric patches used for experimental demonstrators were fabricated using two different methods, Burnt polymer spheres (BURPS) and freeze-casting. These patches were bonded to an aluminium beam and tested with a shaker which provides harmonic base excitation over a wide range of frequencies. The spectrum of the voltage outputs were measured and compared with those obtained by numerical model predictions. The objective of this research is validation and verification of numerical models for porous piezoelectric materials. Porous piezoelectric materials are generally more efficient when exploiting the piezoelectric d 33 coefficient since it is higher than the coefficient d 31 [22]. However, to harvest energy using d 33 , the structure often has to be excited at very high frequencies (10 kHz) or transducer designs such as the Macro Fibre Composite (MFC) have to be used. Therefore, for validation purposes of the material model, it was decided to build an energy harvester which uses d 31 .
The structure of this paper is summarised as follows. The porous material manufacture process is detailed in Section 2. An analytical homogenisation method known as Mori–Tanaka method is presented in Section 4. The obtained properties are used in the next section to create a finite element model of the cantilever beam demonstrator. The demonstrator fabrication and the testing parameters are presented in the next section. Finally, the results and discussion are presented in Section 6 followed by the conclusions of the present study in Section 8.

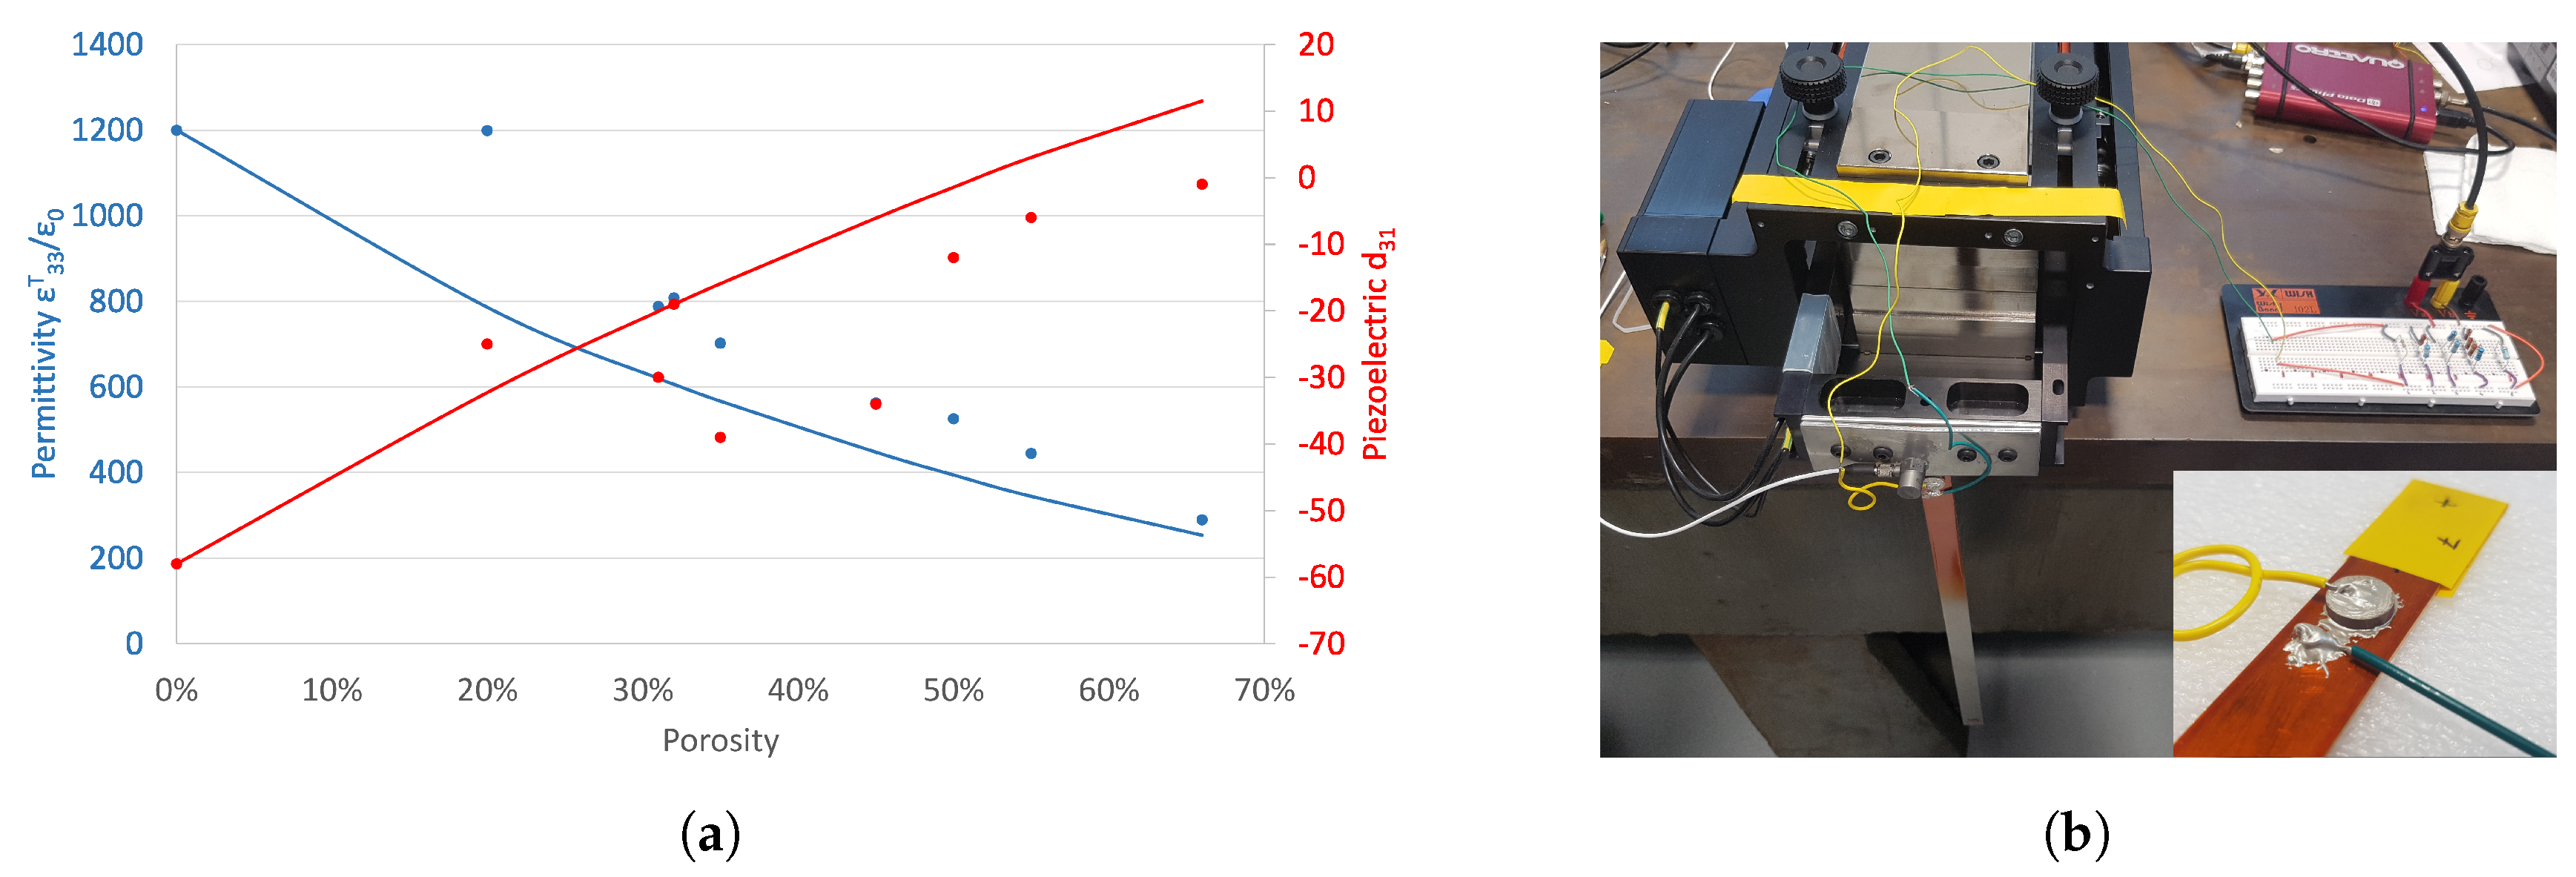
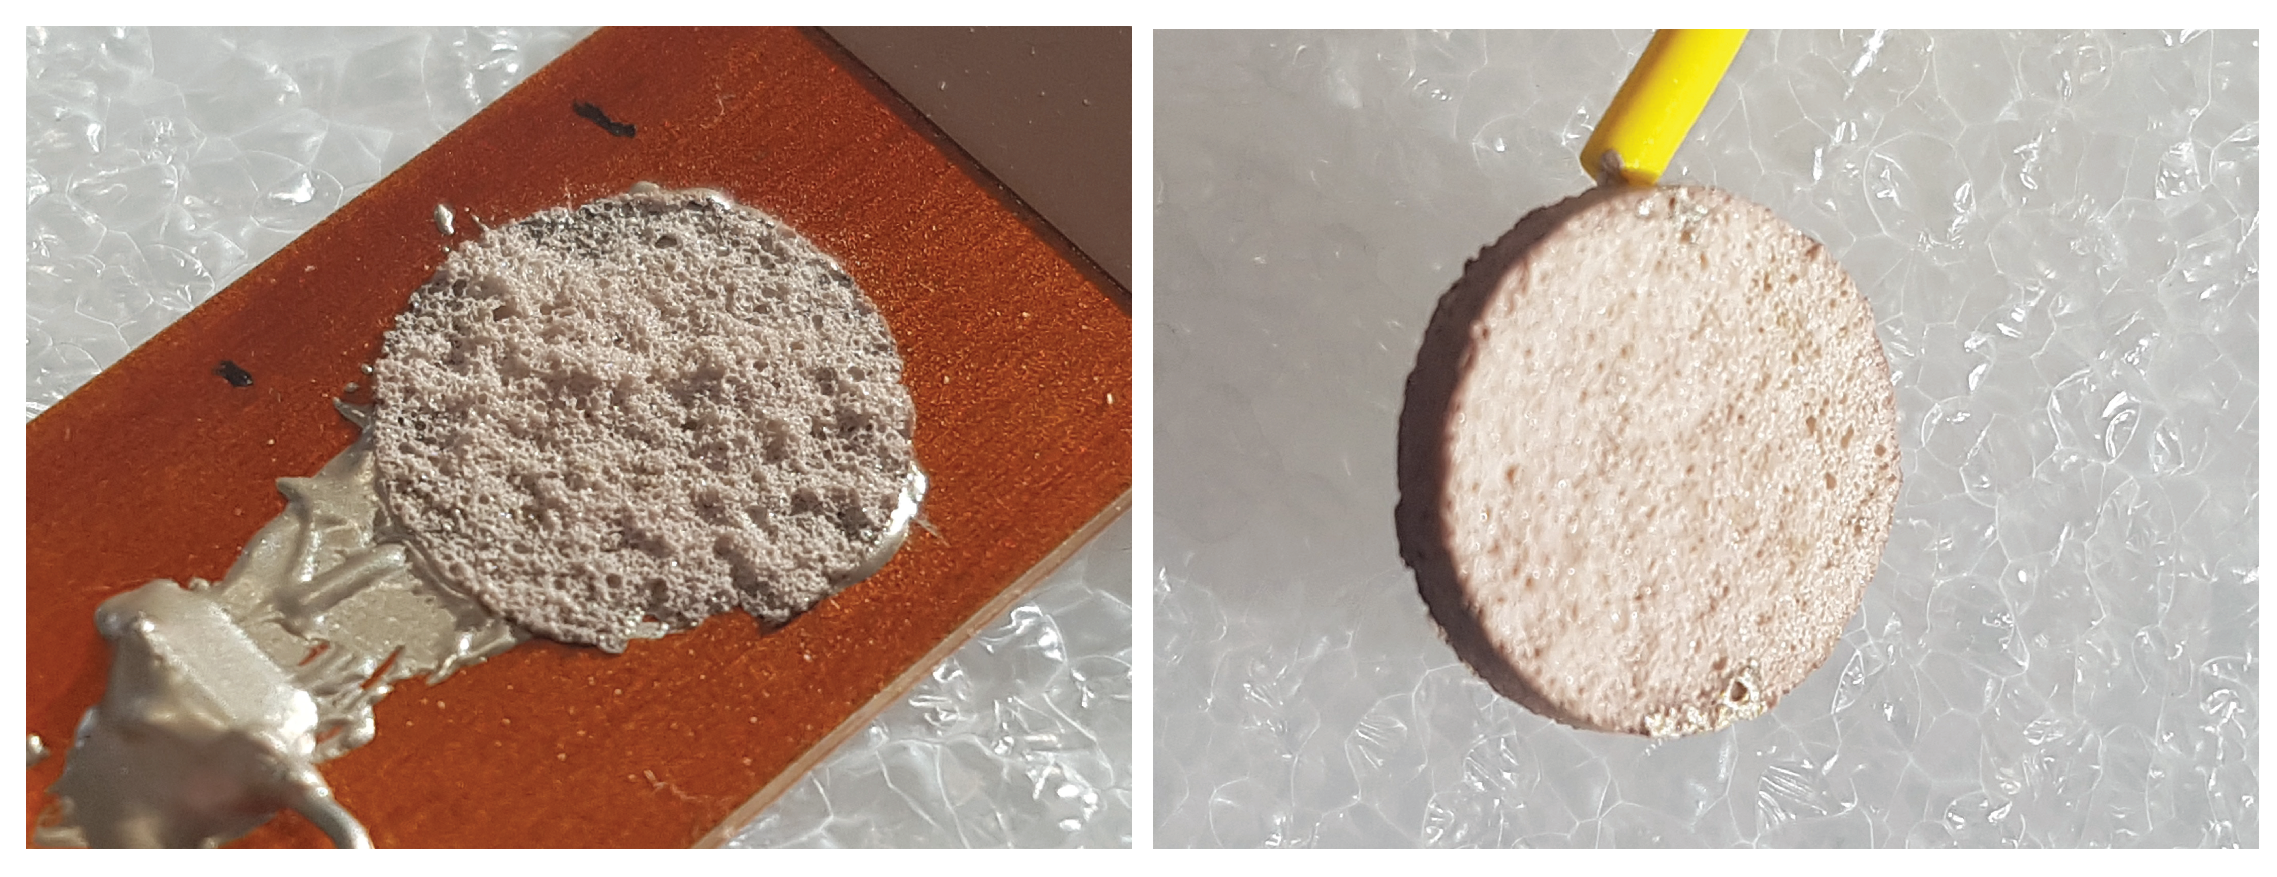
2. Manufacture Of Porous Material

In this study, commercially available barium titanate powders ( B a T i O 3 , d 33 = 147 pC/N, relative permittivity ϵ 33 T / ϵ 0 = 1470 [23,25], deionised water and poly(acrylic acid) (PAA, Mv 100,000, Sigma Aldrich, Saint Louis, MI, USA) and polyethylene glycol (PEG, Mv 8000, Sigma Aldrich, Saint Louis, MI, USA) were used as starting materials, freezing vehicle, dispersant and binder/pore forming agent (PFA), respectively.
For the burned out polymer spheres (BURPS) method, barium titanate powders were mixed with PEG in different proportions by weight and were uni-axially pressed at 300 MPa to form the disks. For freeze casting, suspensions with barium titanate powders, 3 wt % dispersant and 3 wt % binder were ball-milled for 24 h in zirconia media and de-aired by stirring in a vacuum desiccator until their air bubbles were completely removed. Freezing of the suspension and aqueous solution was performed as described in Reference [26,27] by pouring them into a transparent aligned cylindrical polydimethylsiloxane (PDMS) mould, which was then transported to a copper cold finger and placed in a liquid nitrogen container. The frozen barium titanate pillars were then freeze-dried to remove the ice dendrites. The disks and freeze-dried barium titanate pillars were heat-treated at 500 C for 2 h to remove the organic additives, followed by heat-treatment at 1200 C for 2 h and then finally allowed to cool down naturally in the closed furnace. The sintered ceramics were then cut to a diameter of 10 mm and thickness of 1 mm by a cutting machine.
After the manufacture of the porous disks, the piezoelectric strain coefficient, d 31 , was measured using a Berlincourt Piezometer (PM25, Take Control, London, UK), which applies an alternating force of 0.1 N at a frequency of 97 Hz. Measurements of the relative permittivity of the sintered porous barium titanate were carried out at room temperature using an impedance analyser (Solartron 1260, Hampshire, UK). However, not all the material properties required to model the composite using the finite element (FE) method can be obtained without more advanced testing. For example, the elastic modulus cannot be measured using widely used resonance technique because the air in the porous material attenuates the resonance. Other mechanical tests which measure these elastic properties might destroy the patches. Therefore, to avoid these problems, an homogenisation process is proposed in the next section to predict the complete set of material properties.

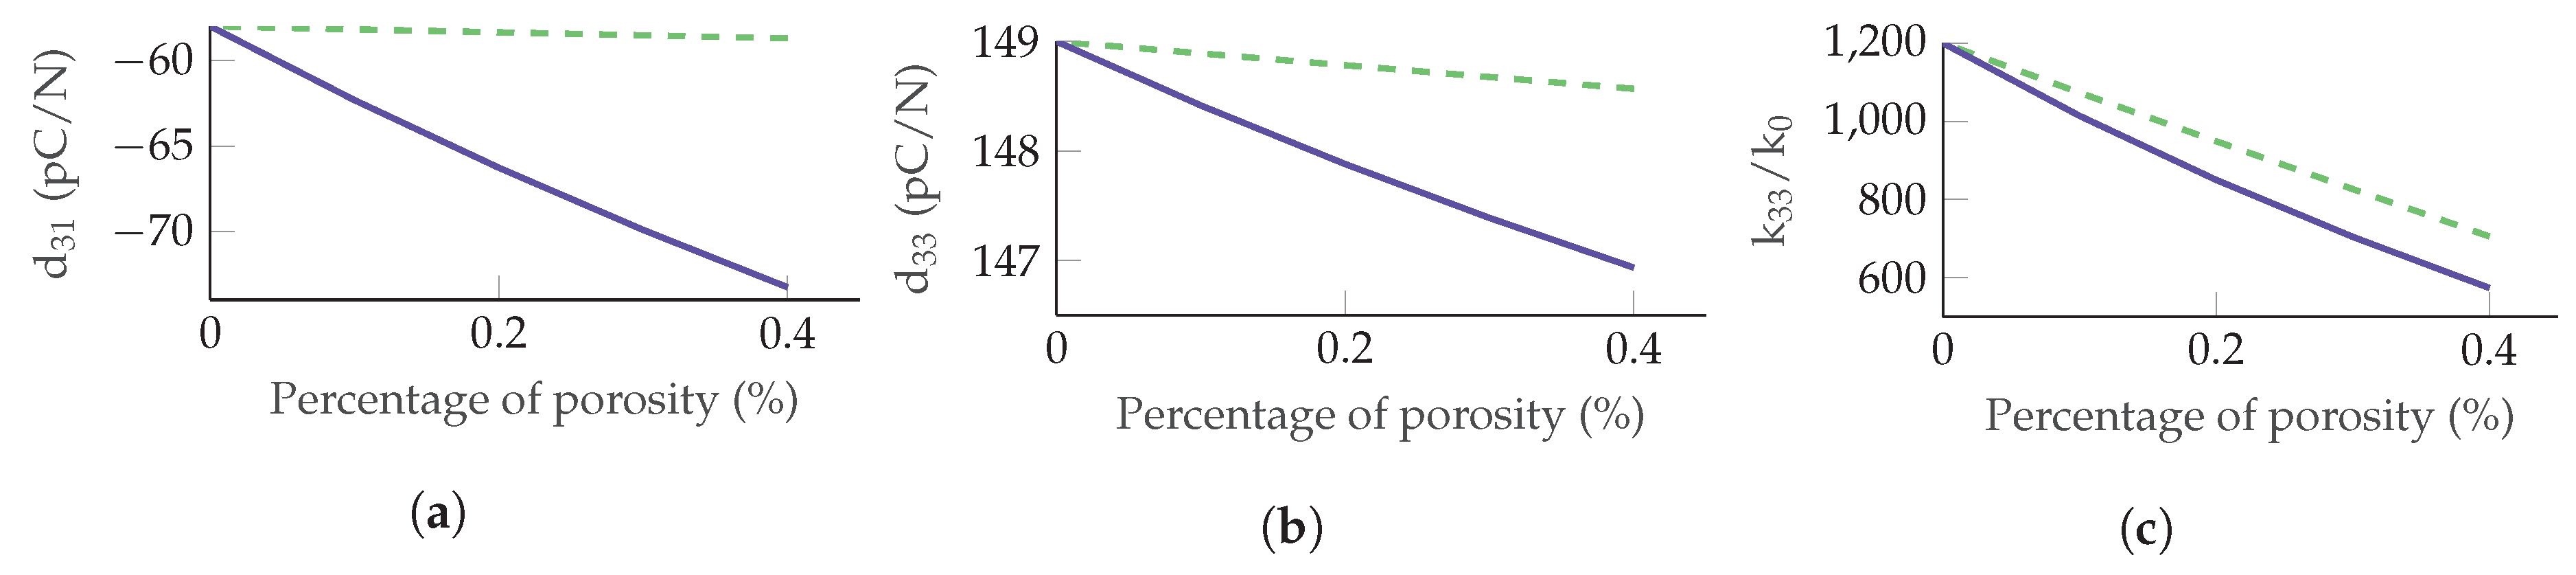
3. Theoretical Homogenisation
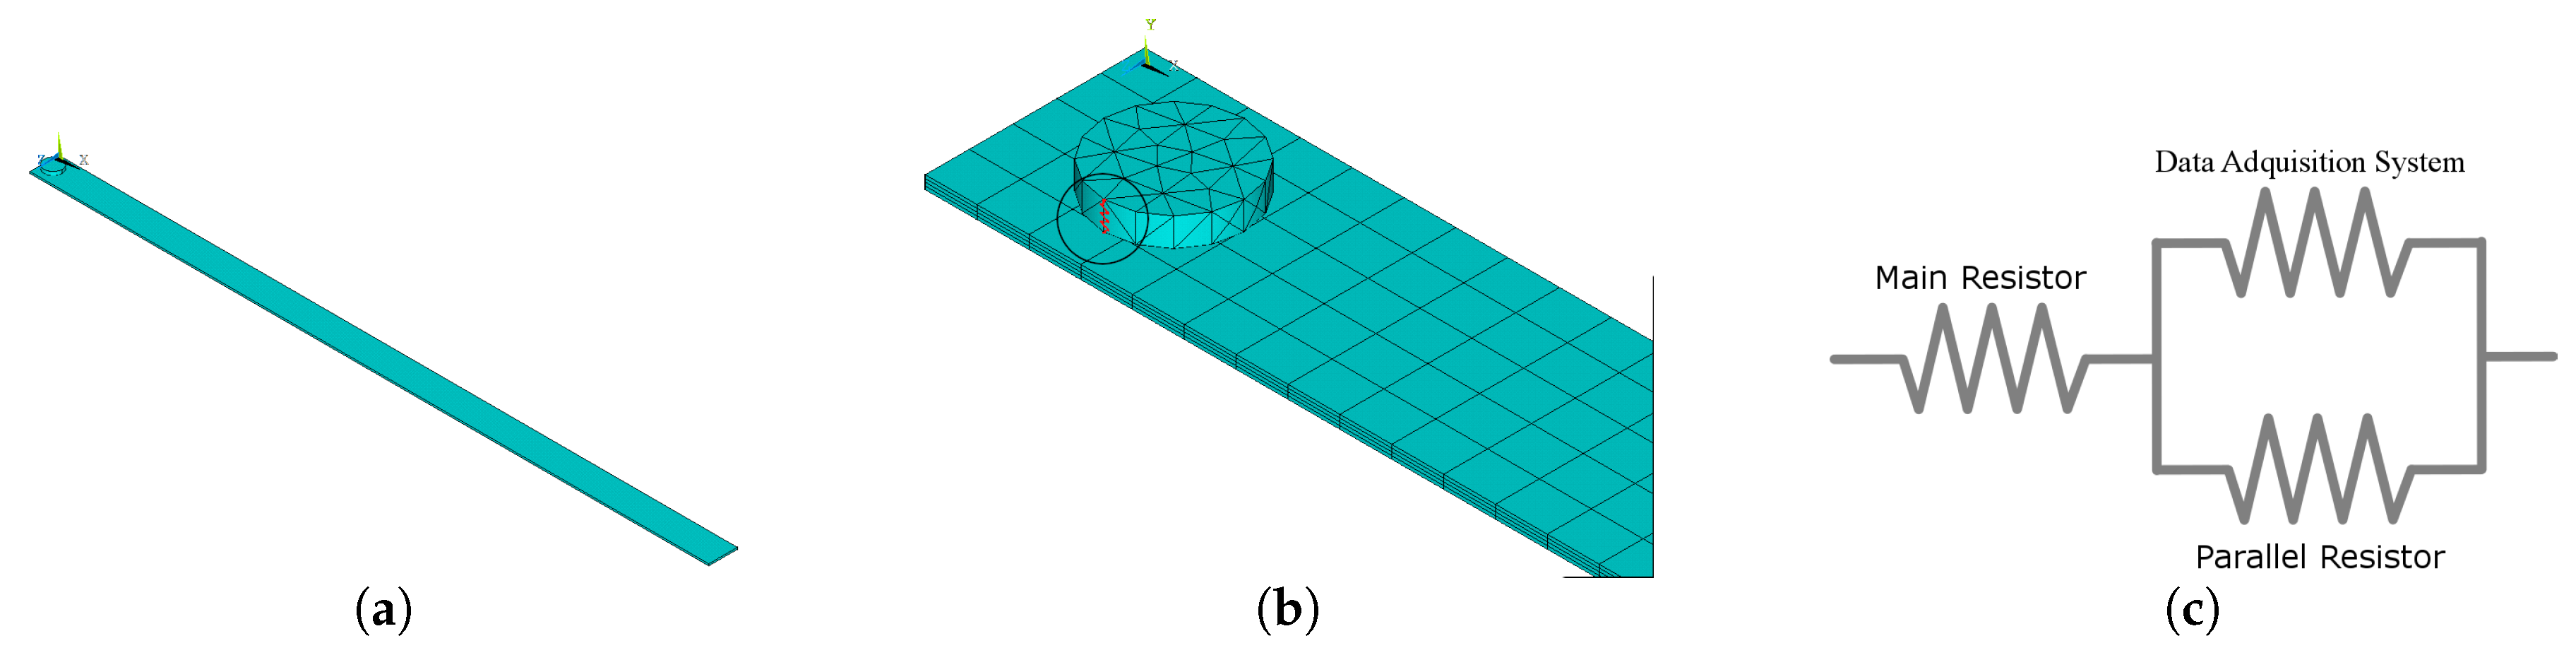
Porous piezoelectric material is composed of two phases: air and piezoelectric material. For each phase, the material constants are well known, but the set of homogenised material constants must be calculated for the resultant composite. As stated in Section 2, not all material properties can be obtained with accuracy or without compromising the health of the porous ceramic disk. Hence, some material properties have to be predicted using a homogenisation approach.
One of the most commonly used approaches is to homogenise the material using analytical methods. Analytical methods have been used extensively to homogenise composites because of their accuracy and speed with respect to other approaches such as computational homogenisation using FE methods. One of the most well-known and validated approaches is the Mori–Tanaka method [28]. This method improves the Eshelby solution [29] given for ellipsoidal inclusions in elastic media. The approach may be used in multi-field physics analysis, for example for general composite materials [30,31] and for porous piezoelectric materials [32,33]. To perform a Mori–Tanaka homogenisation, the calculation of the Eshelby tensor, S * , is required and depends on the shape of the inclusion which is spherical in this case. The procedure to obtain this tensor is comprehensively detailed in Reference [34] and hence is not explained here. In the Mori–Tanaka method, each inclusion has properties E I where E I is composed of the elastic stiffness matrix ( C ), the piezoelectric matrix ( e ) and the permittivity matrix at constant strain ( k s ). This tensor behaves as an isolated inclusion, embedded in an infinite matrix with properties E M , that is loaded remotely by an applied strain; therefore, each inclusion is subjected to the averaged stress fields acting on it from all of the other inclusions, through the superposition of stresses. The application of this method in a porous piezoelectric material is demonstrated in Reference [35] and is compared with other homogenisation methods such as self-consistent and computational homogenisation method using FEM. In this paper, the Mori–Tanaka homogenisation is presented as an accurate method to predict the homogenised material properties. The piezoelectric material properties are detailed in Table 1. The air material properties used for the homogenisation method supposes a linear material with elastic modulus equal to 0 MPa, piezoelectric coefficients equal to zero and dielectric coefficients equal to the relative permittivity constant of the air.
The homogenisation procedure of this method is summarised as follows: First, an influence tensor A 0 I , r has to be calculated for every phase r ( A 0 I , r ) and percentage. This concentration tensor is written in terms of the Eshelby tensor as shown in Equation (1a). These concentration tensors are then averaged to obtain the general influence tensor, A ( MT ) I , r , and, finally, the effective electro-elastic material tensor ( E * ) using Equation (1c).
A 0 I , r = I + S * E M 1 E I , r E M 1
A ( MT ) I , r = c I , r I + c M ( A 0 I , r ) 1 + j = 1 N c I , r A 0 I , j ( A 0 I , r ) 1 1
E ( MT ) * = E M + r = 1 N c I , r E I , r E M A ( MT ) I , r
This method is self-consistent, since the inverse of the electromechanical matrix E * is equal to the compliance electromechanical matrix F * , which is composed by the elastic compliance ( S ), the piezoelectric matrix ( d ) and the permittivity matrix at constant stress ( k T ).

4. Numerical Model

To design efficient porous material energy harvesters, a reliable and accurate modelling technique is needed. Today, one of the most powerful tools to represent complex multi-physics is the Finite Element Method. This method is based on discretisation of partial differential equations that govern the problem. It can model complex geometries as well as complex material properties. The porosity of piezoelectric material allows a smart distribution of the piezoelectric mass in the energy harvester, removing piezoelectric material from the places where the strain is lower and reallocating it where higher strains are located. The graded distribution of porosity generates functionally graded material which can maximise the power output for a given quantity of piezoelectric material. This distribution can be accurately modelled using finite element methods. Therefore, the FE technique was used here, although this study did not include functionally graded materials. In future studies, the porosity distribution will be optimised to maximise the power output.
In this study, the finite element package ANSYS® was used to model the harvester. The homogenised material properties obtained from the Mori–Tanaka theory were modelled in the linear elastic range using 3D elements as Figure 1 shows. The element type used for the whole model was SOLID 227. The external resistors were modelled using the element CIRCU94, connecting the top surface of the piezoelectric disk and the bottom surface. The FE model was coupled with Matlab® which performed the homogenisation process and provided the material properties and geometrical parameters to ANSYS®. An in-house Matlab® code was developed to link ANSYS to MATLAB and can be used for optimisation/model updating purposes. The porous material was modelled using the homogenised parameters obtained in Section 3.

5. Experimental Validation

To validate the finite element model, a set of experiments were designed. Several piezoelectric patches with different percentages of porosity were prepared at the University of Bath. The porosity of the test disk ranged between 20% and 66% with different values of thickness and radius, as shown in Table 2. In addition, some non-porous piezoelectric patches were used to compare the accuracy of the model with traditional lead zirconate titanate (PZT). These non-porous square patches were PZT-5A and supplied by Morgan Advanced Ceramics. Their properties and dimensions are shown in Table 1.
The patches were attached to aluminium beams using conductive glue which also acts as the electrode. These aluminium beams have the properties specified in Table 1. These piezoelectric demonstrators were tested using an APS Dynamics Model 113-HF electrodynamic shaker as an excitation source, powered by an APS amplifier Model 125-230. The type of testing was stepped sine analysis for a range of frequencies between 5 Hz and 42 Hz which includes the first two modes and the anti-resonance.
Two measurements were obtained, the base acceleration through an accelerometer located on the shaker, and the voltage difference between the top and bottom electrode of the piezoelectric patch using a Data Physics Quattro analyser.

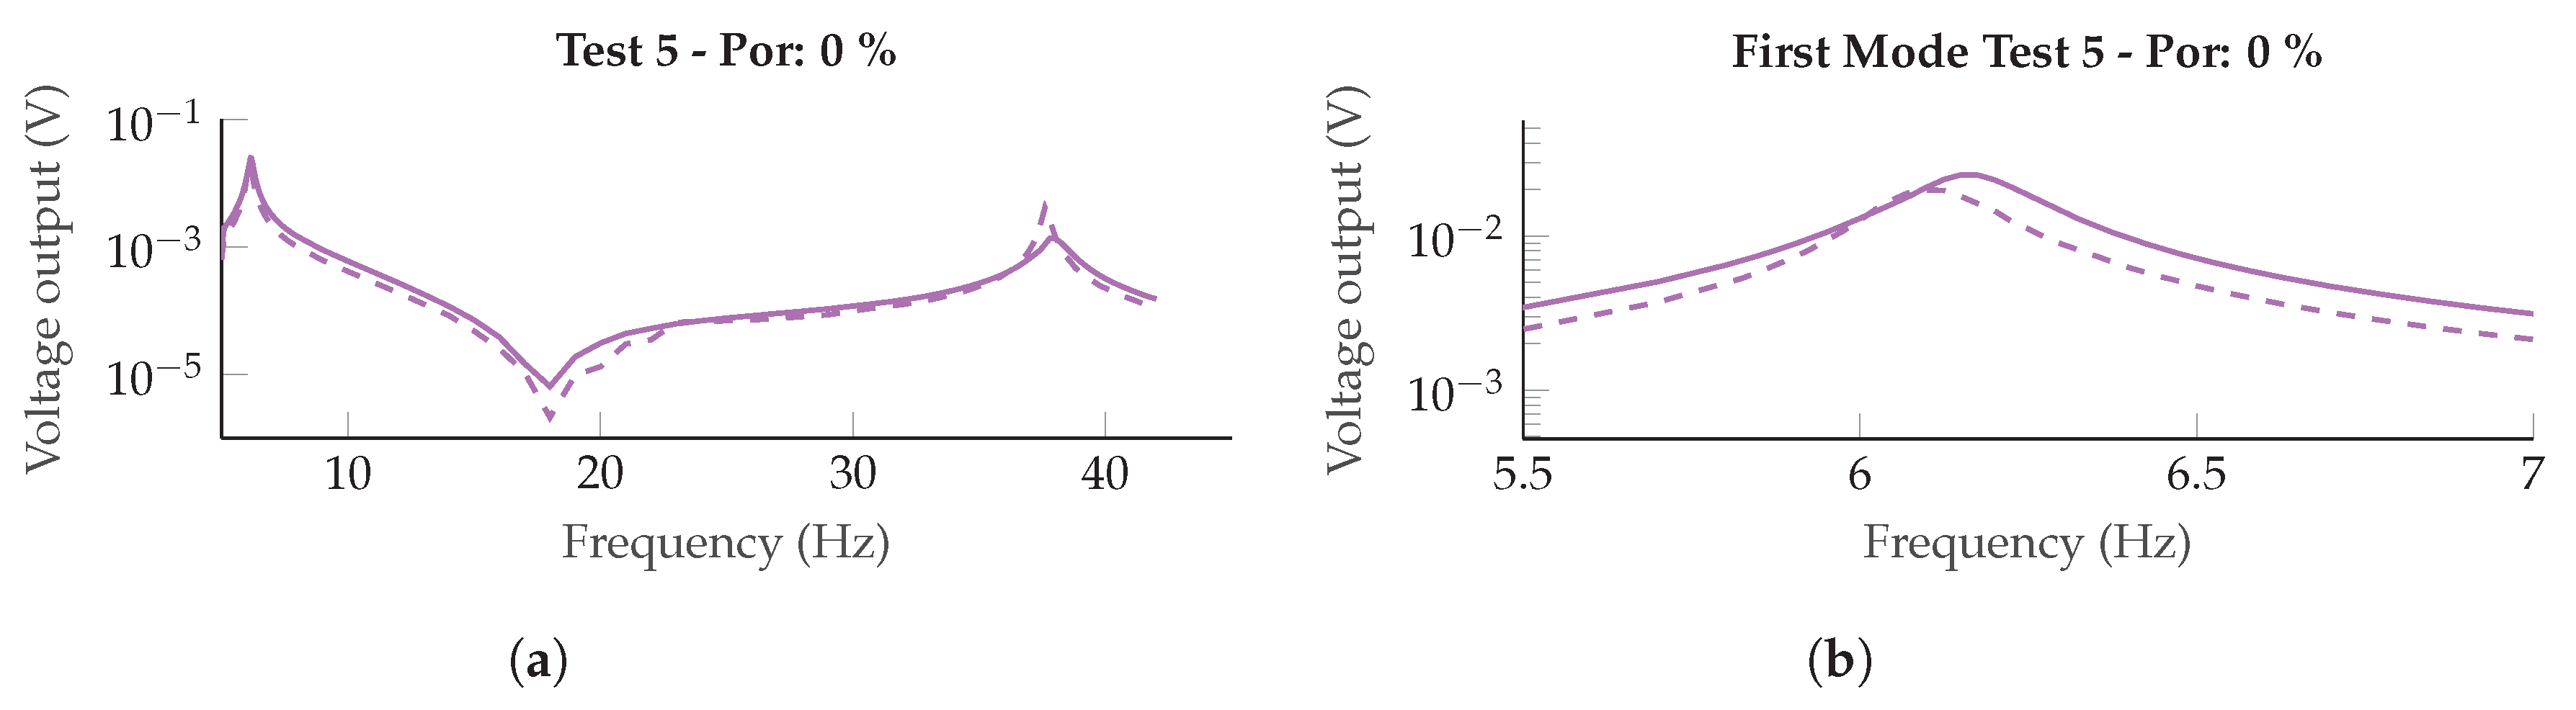
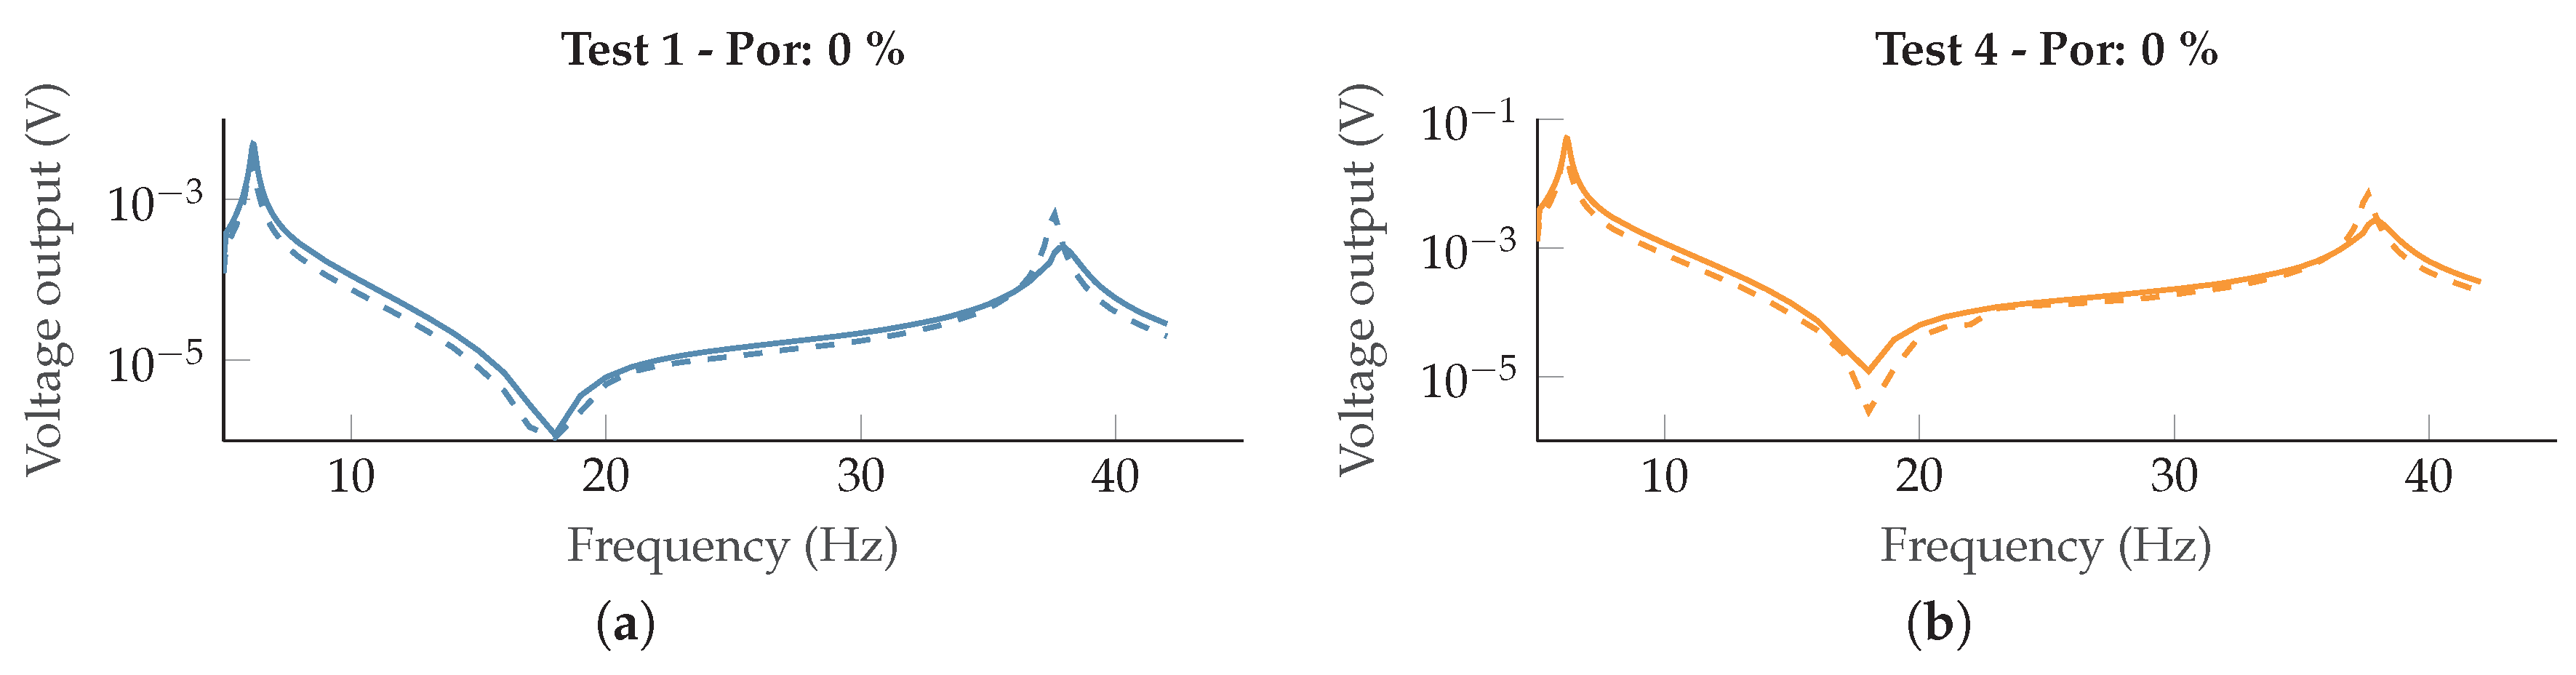
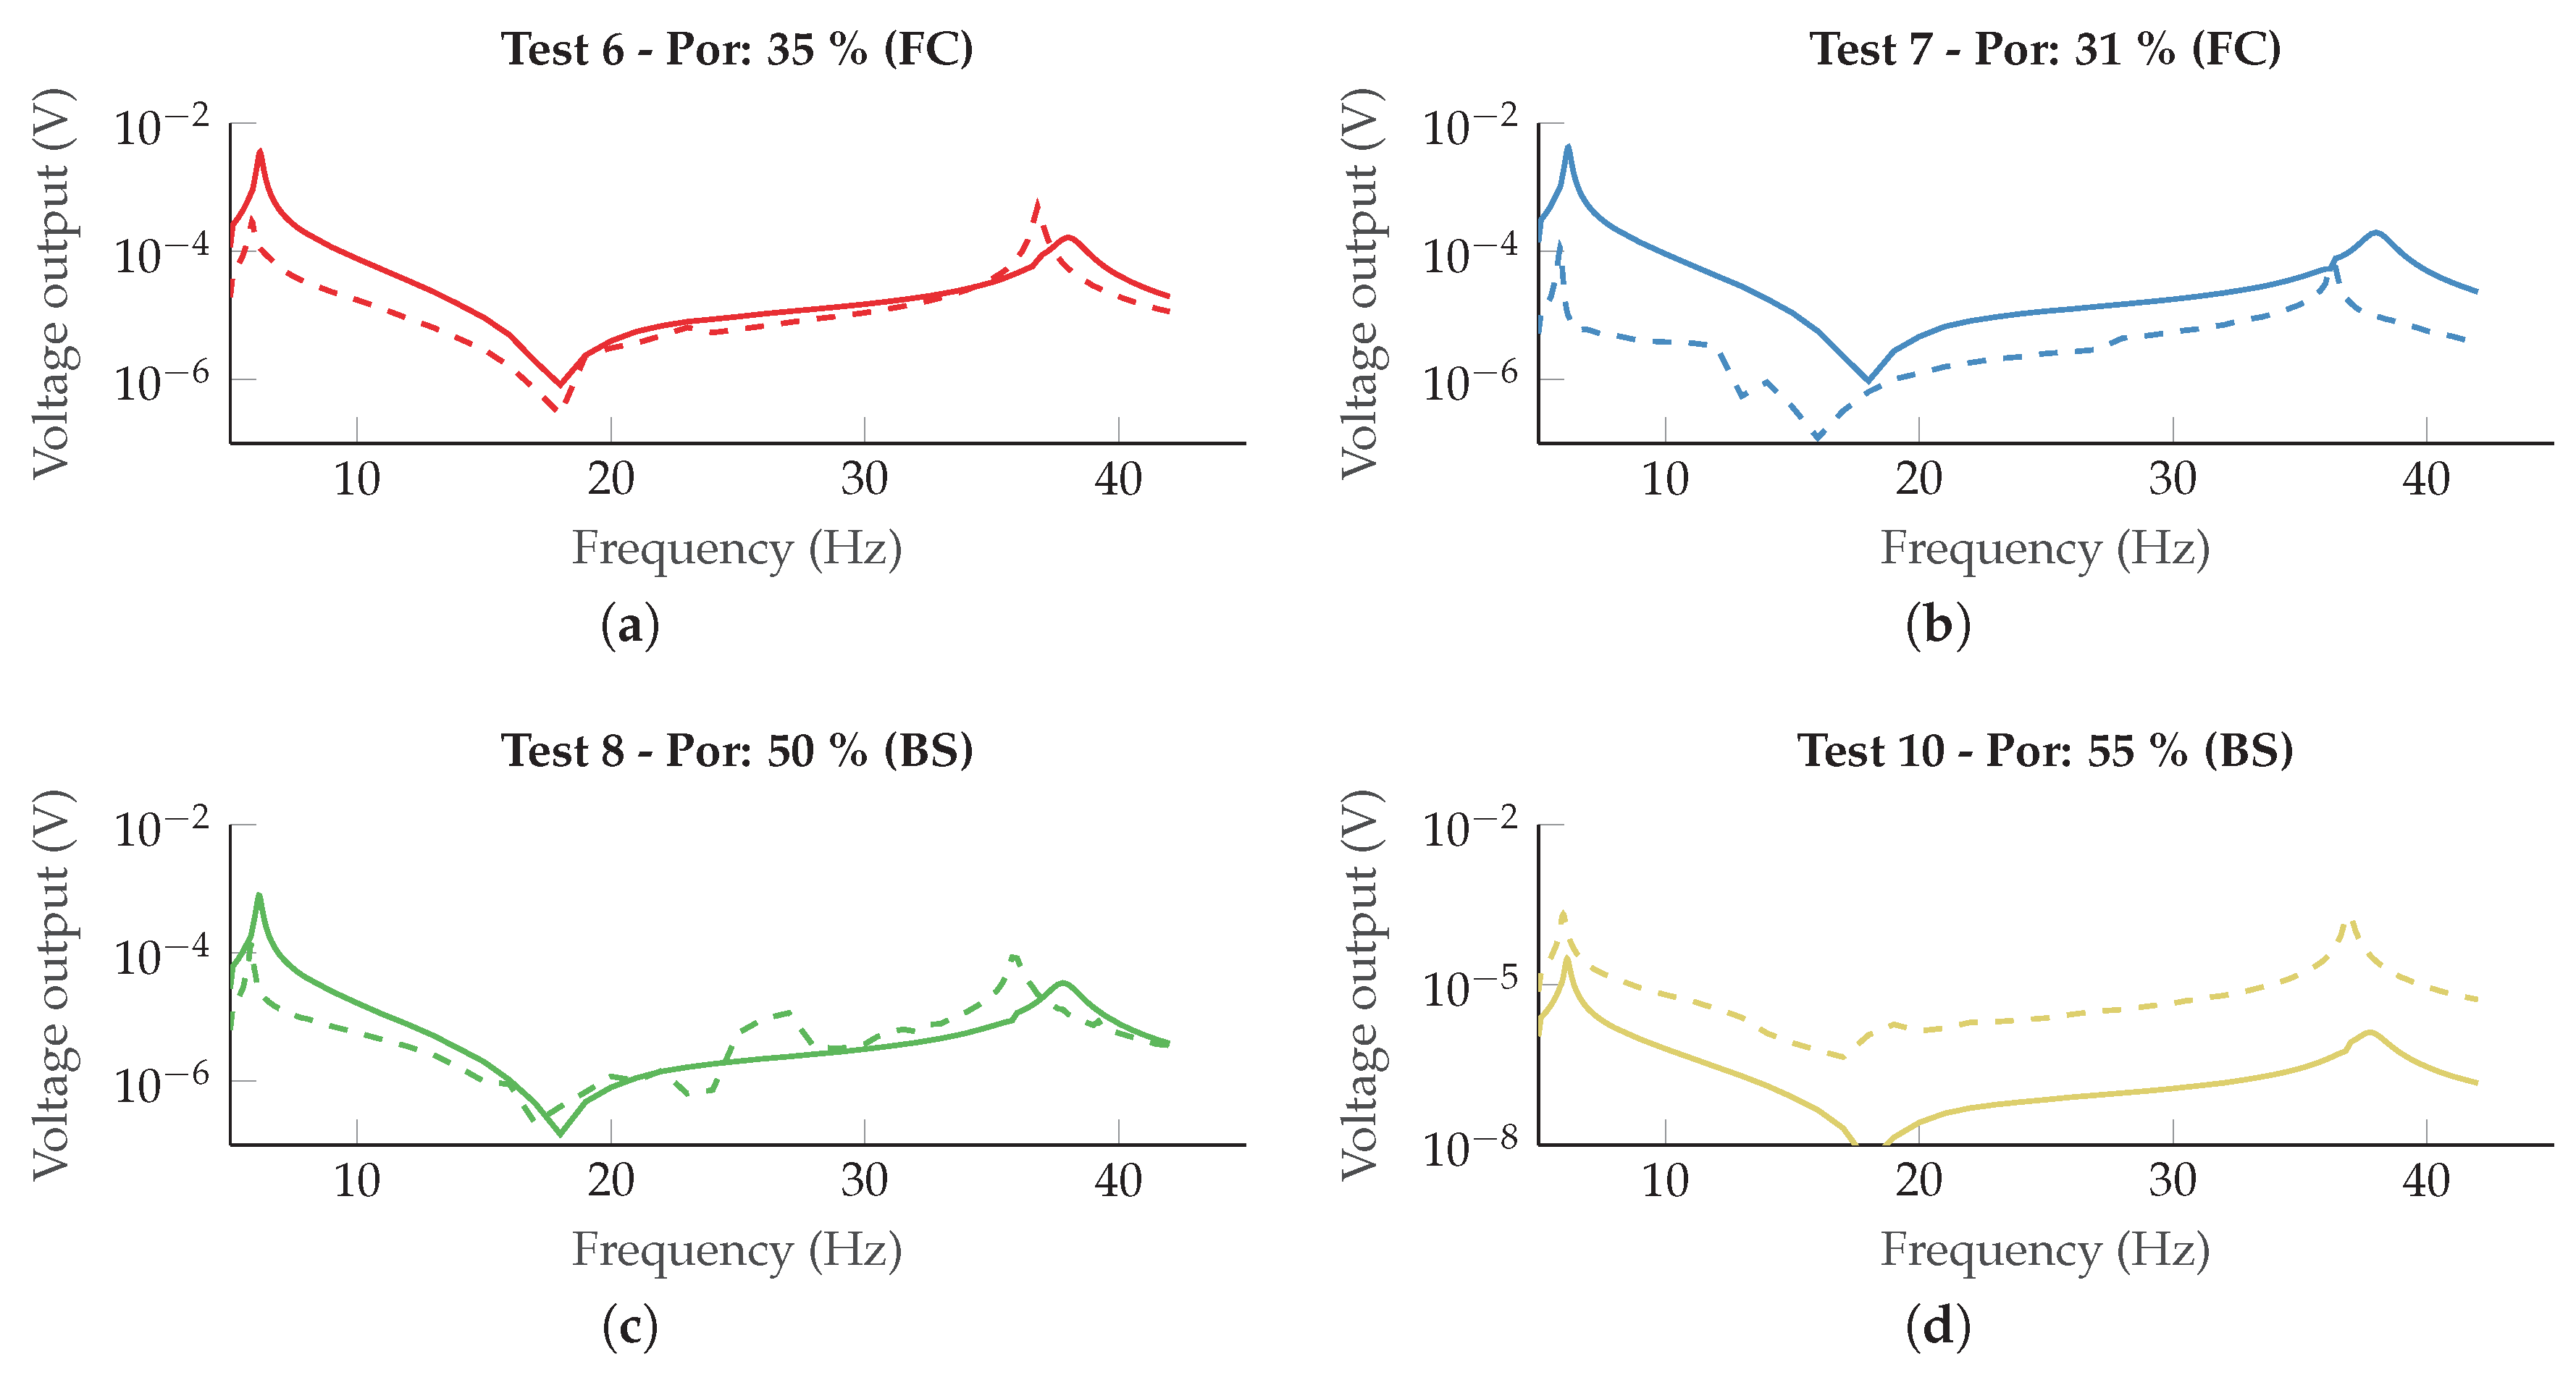
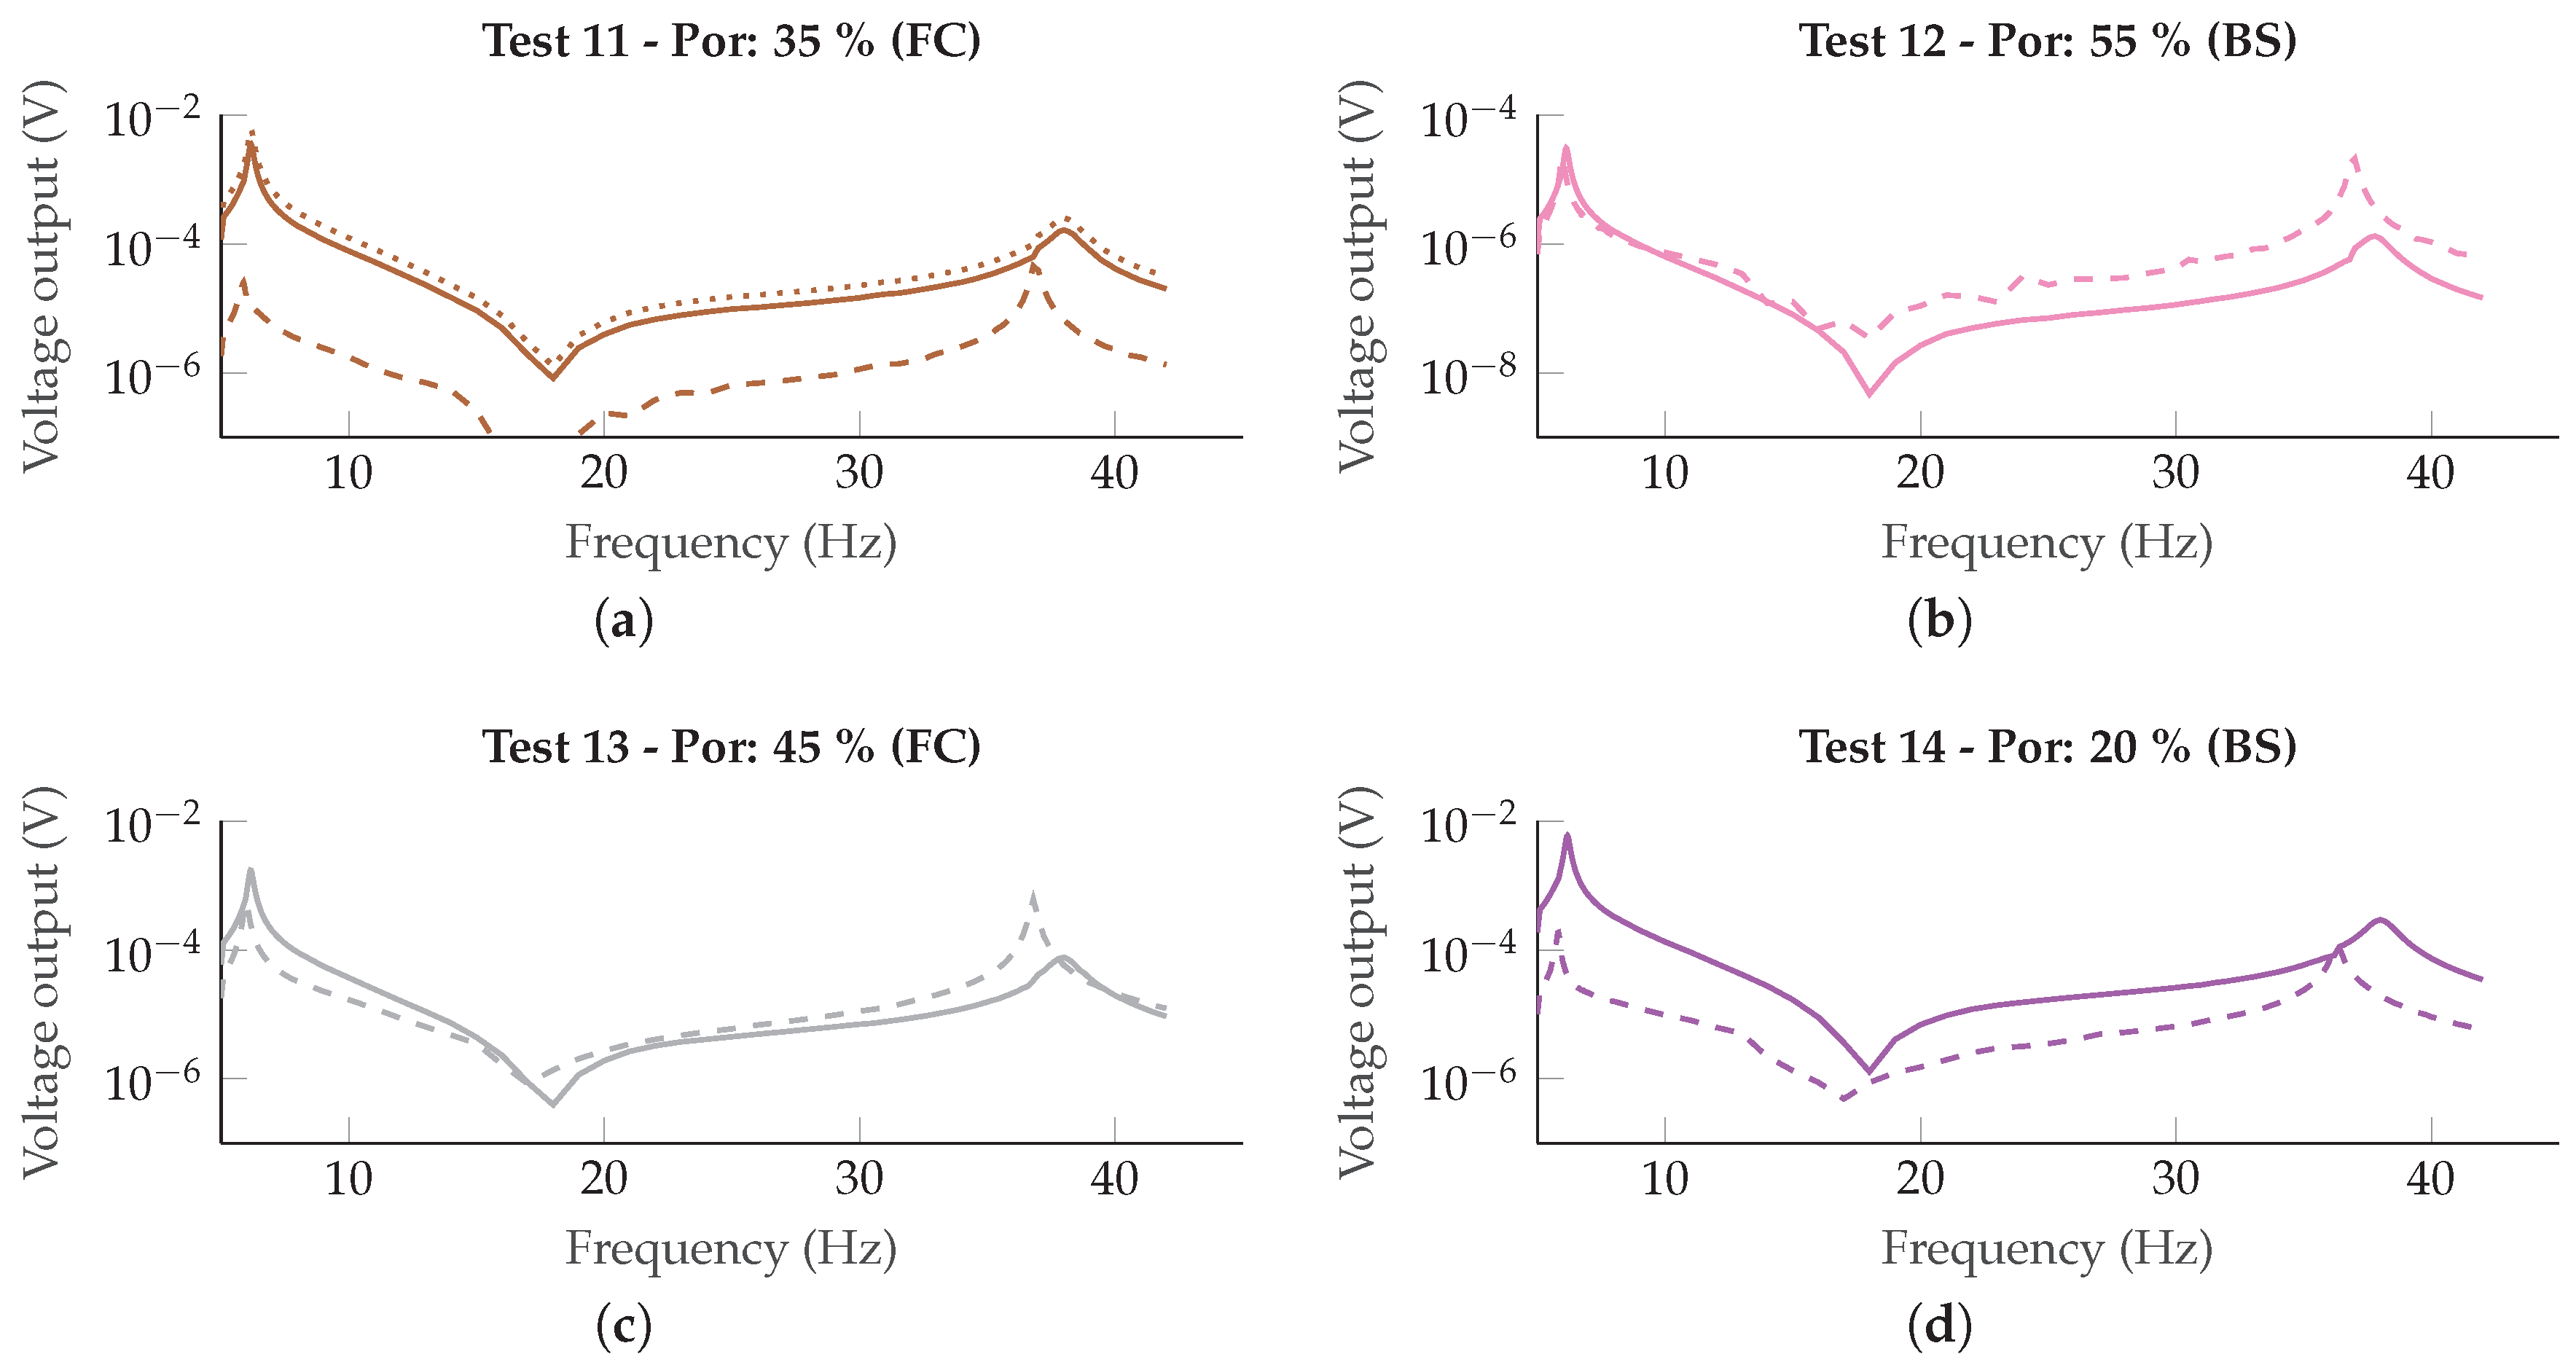
6. Experimental Results

As stated in Section 2, an homogenisation method for the porous piezoelectric ceramic was used to obtain the complete set of material properties of the porous PZT. In Figure 2a, the results obtained from the homogenisation process for the piezoelectric coefficient d 31 and the dielectric coefficient ϵ 33 T are compared with the values measured on the patches after its fabrication. Note that the Mori–Tanaka theory is not suitable for a high volume of inclusions (see [28]) which explains the positive values of the coefficient d 31 , predicted for percentages of inclusions over 55%, shown in Figure 2a. The homogenised values of these coefficients overestimate of the measured values. Further examinations of the disk reveal some cracks which potentially could decrease the piezoelectric values. It was also observed that not all inclusions are spherical, as was assumed (Section 3). In the case of the disk manufactured using the free-casting method, the shape of the inclusions tends to be more cylindrical than spherical. The cylindrical inclusions reduce in-plane properties whilst maintaining the benefits of the through thickness properties and this causes the differences between the values of the material coefficients in different directions. In other words, the in-plane properties of the porous piezoceramic with spherical inclusions will be larger than their corresponding values for the ones with cylindrical inclusion shapes [36]. Using the assumption of spherical inclusions could overestimate some parameters especially in direction perpendicular to the cylinders, as shown in Figure 2a. It was observed that the main piezoelectric coefficient for the voltage output in a cantilever energy harvesting device is d 31 which is potentially greatly affected by the shape of the inclusions.
Once the material coefficients were obtained and validated, the dynamic tests were performed, as stated in Section 5. Table 3 shows the experiment setup for each test. The dynamic tests consider different fabrication methods (Free-Casting or BURPS) and percentages of porosity (from 20% to 66% porosity). In any harvester, the external circuit has a strong impact on the power output due to impedance matching. Therefore, the load resistance has to be optimised for each level of porosity to obtain the maximum power. In Reference [33], it is suggested that the porosity has a limited impact on the optimal resistance, being close to the non-porous optimal resistance, defined by ω n R C = 1 . This value for the first natural frequency (5.84 Hz, obtained from FE model) of the non-porous patch is approximately 10 M Ω . The resistors configurations are detailed in Table 3 for all the dynamic tests performed.
To validate the FE model, non-porous patches were tested and compared with numerical predictions. Some of the results of this comparison are presented in Figure 3. Good agreement was obtained between the numerical model and the voltage output obtained in the laboratory for different values of resistance connected to the harvester (see Table 3). The FE model accurately predicted the values of the resonance frequencies for all the tests performed. For example, in Test 1 the difference in frequencies of the first mode is lower than 1%. The antiresonance frequencies are slightly lower than the experimental values but the impact of this difference is negligible for energy harvesting. The amplitudes of the voltage output were predicted with a good accuracy, especially around the first mode, as Figure 3b shows. The difference between Tests 4 and 5, observed in Figure 4, is due to different levels of the amplitude of base excitation. This was achieved by increasing the acceleration from 0.0885g (Test 5) to 0.1824g (Test 4) to identify possible sources of non-linearities. Nevertheless, no sources of non-linearities were identified, confirming that the energy harvester behaviour will remain linear in the ranges of base excitation amplitude tested. The damping ratio was obtained experimentally from the half power points and lies between for the first mode 1.27% and for the second mode 0.347%.
To assess the reliability of the numerical model for non-porous patches, the analysis of the dynamic results are presented. Test 9 is not presented in this figure because the disk detached during the dynamic test due to crack propagation (see Figure 5) and the formation of cracks are an issue when manufacturing or testing porous material. The fabrication of the porous disk is difficult for thin patches (less than 2 mm) or high porosities (over 55% of the total volume), and disks usually collapse for porosities over 70%. In relevant papers (e.g., [23,37]), CT images of the porous material are given, where its structure and pore distribution are shown. In Test 9, the porosity was 66% which was the highest porosity achieved.
In Figure 6 and Figure 7, a comparison between the numerical model prediction (solid line) and the experimental values (dashed line) is presented. The experimental voltage output of the porous demonstrator is, in general, lower than the non-porous output because the matrix material is different for non-porous (PZT-5A1) and porous patches ( BaTiO 3 ). In general, the results show reasonable agreement between FE model predictions and measurements. This is an indicator that the stiffness and inertia properties reflect the physics of the problem and hence the geometry and material properties of the porous material. The amplitude of the voltage output varies according to the porosity and manufacturing process. For example, Tests 6 and 12 show an acceptable degree of agreement between the predicted voltage output in the numerical model and the experimentally measured voltage. In particular, the predicted and measured voltages have similar values around the first resonance frequency. In general, there is a shift in the voltage output between the predictions and the experimental results with Tests 10, 7 and 8 presenting the greatest shifts. A general shift in the voltage output can be possibly related to poorly estimated values of the piezoelectric coefficients. As mentioned in Section 2 and Section 3, the values used in the FE model were obtained from the Mori–Tanaka method which assumes spherical inclusions and no cracks inside the matrix. These cracks are likely to decrease the piezoelectric coefficients and the dielectric coefficients, generating the shift presented in the graphs. This also might be seen as an indicator of the health of the disks. The fragility of the disks and the tendency for crack growth has already been highlighted, and hence measuring the coefficients before and after the dynamic tests could quantify damage in piezoelectric porous material. This is clearly different to the non-porous material where the second mode generates lower voltage amplitudes than the first mode (see Figure 4a). This effect is interesting for designing wide range energy harvester which their frequency range spans multiple modes.
Some experimental data present important changes in the voltage output close to the anti-resonance frequency, for example Tests 7, 8 and 11. This variability is attributed to the noise when measuring very low voltage amplitudes. The fabrication method also has an important impact in the final voltage output. The BURPS manufacturing processing is a more developed technique for porous piezoelectric material than free-casting. It is simpler to manufacture and the results are better compared to free-casting. Hence, higher percentages of porosity can be achieved using this method. In addition, the free-casting method generates long aligned cylindrical-shaped inclusions which are very sensitive to cracks, contributing to fracture propagation under dynamics loads, especially loads normal to the polarising direction.

7. Discussion

Change the title of the section? As stated in the previous section, there is a general shift in the voltage output of the porous material experimental test results compared with the FE predictions. This shift could be due to different reasons, such as the already mentioned difference between the assumed porous shape (spherical) and the real porous shape which can be oblate when using BURPS method or more elongated in one direction when using the free-casting method. This shape can have great impact on the different coefficients, as Figure 8 shows. The homogenisation process performed in Section 3 is compared for two different shapes. The extreme case of cylinder shapes shows a higher decrease in the piezoelectric coefficient with respect to the spherical shape when the percentage of porosity increases. The shape of the inclusions also affect the dielectric coefficients but, as Figure 8c shows, its impact is lower. The elastic coefficients are also affected by the inclusion shape, as already pointed out in [32] but the scope of this paper does not include the analysis of the shape inclusions on the homogenised properties. For further information, the authors recommend [32,35,38,39]. A study using high resolution images of the porous patches is recommended to characterise the real shape of the inclusions. Different methods are available such as X-ray, CT or Tomographic microscopes.
Another possible cause for the difference in the voltage output between the experiments and numerical simulations is the presence of un-poled material in the demonstrators. In the simulations, the material was assumed fully poled, which is very difficult to achieve in practice, especially for materials with inclusions such as porous piezoelectric materials. The presence of inclusions changes the distribution of the electrical field during the polarisation stage leading to concentration of the electrical field around the inclusions and lower electric field in other areas [40]. In these areas, if the electric field is lower than the coercive electric field required to polarise the material grains, then these areas do not exhibit the piezoelectric effect. Lastly, the porous materials are prone to cracking, especially at high volume of inclusions. The fabrication method also introduces some cracks due to the pressure applied during the manufacturing process.
Unfortunately, both unpolarised grains and the presence of cracks are very difficult to quantify either with or without destroying the demonstrator. Modern techniques of scanning such as CT Scanning could give some insight into the level of fractures and their orientation in the material. The authors refer to previous works (e.g., [37,41]). To assess the validity of the model, an uncertainty study was performed to obtain the possible range of voltage output. This study assumed a Gaussian distribution to represent the value of the piezoelectric coefficient d 31 . This distribution approximates the uncertainty in the fabrication process, polarisation of the material, the presence of cracks, as well as manufacturing tolerance and errors. The mean values and standard deviations for the porous piezoelectric materials manufactured using the BURPS methods are given in Reference [23] and presented in Table 4. These data suggest that the decrease in the piezoelectric coefficient d 33 is lower than the decrease in d 31 for increasing porosity [25], and hence this coefficient ( d 31 ) could be potentially used in novel energy harvesters where the loads and electrical field are aligned. Check the demonstrator number in the figure
A random study was performed using 120 samples to obtain the variations in the voltage output shown in Figure 9. In this figure, the experimental values constitute a lower bound of the predicted voltage output. Values around 40% of the nominal piezoelectric coefficient d 31 represent the best match with respect to the experimental results, which means there is still a big uncertainty around the manufacturing and polling process and how it should be included in the numerical models. Around the first mode, the sensitivity of the energy harvester to the piezoelectric coefficient d 31 is low, where changes in this coefficient do not imply great changes in the voltage output.
The ability of porous piezoelectric material for energy harvesting is discussed. Given the small number of samples tested, and the scattering of the experimental data because of the manufacturing process, the conclusions of this study should be validated with further studies with more experimental samples. The results presented in Figure 6 and Figure 7 shows that tests with low porosity samples produce more energy than those with higher porosity. This is due to the decrease in the piezoelectric coefficients and the presence of cracks which decrease the internal connectivity in the sample. However, the numerical simulations show that the power output does not decrease significantly with the porosity up to 40–45%, as Figure 10 shows. Although the piezoelectric coefficients decrease with increased porosity, the density and capacitance also decrease, and this gives a greater design space than might be useful in some situations. Further studies on the optimisation of energy harvesting with porous piezoelectric material, which includes the optimisation of the external circuit, should be performed to evaluate the performance of these materials for energy harvesting.

8. Conclusions

A validation scheme for novel porous piezoelectric based on energy harvesting capabilities is presented. A numerical model that obtains the homogenised material properties using Mori–Tanaka theory and finite element method for the harvester modelling was developed and validated. The validation is based on the comparison of voltage output with dynamic tests performed on porous piezoelectric energy harvesters. This scheme shows promising results for predicting the power output of energy harvesters. However, important reductions of the nominal values of the piezoelectric coefficients have been encountered due to the presence of cracks and unpolarised regions in the material as consequence of manufacturing imperfections and processing. The material modelling should be improved to account for these cracks and polarisation process, predict more accurately the material coefficients, and to optimise the piezoelectric material in terms of the electrical and mechanical requirements for energy harvesting applications. Future work will include the cracks and polarisation process in the numerical model of the porous piezoelectric material.

Author Contributions

Writing, Modelling and Experimental testing, G. Martinez-Ayuso; Funding acquisition and Project supervision, H. Haddad Khodaparast; Experimental manufacturing and Testing, Y. Zhang; Supervision, Review and Editing, C.R. Bowen; Supervision, Review and Editing, M.I. Friswell; Validation and Experimental testing, A.D. Shaw; Experimental testing, H. Madinei.

Funding

This research was funded by Aerospace Technology Institute in the framework of “Exploiting Aeroelastic Deflections For Improved Aircraft Performance” project.

Acknowledgments

This research was supported by Aerospace Technology Institute in the framework of “Exploiting Aeroelastic Deflections For Improved Aircraft Performance” project. The authors acknowledge the financial support from the Sêr Cymru National Research Network and Swansea University through a Postgraduate Scholarship NRN-103. The authors would like to acknowledge the support from Morgan Advanced Ceramics PLC.

Conflicts of Interest

The authors declare no conflict of interest. The funding sponsors had no role in the design of the study; in the collection, analyses, or interpretation of data; in the writing of the manuscript; or in the decision to publish the results.

References

  1. Kelly, A. Why engineer porous materials? Philos. Trans. R. Soc. Lond. A Math. Phys. Eng. Sci. 2006, 364, 5–14. [Google Scholar] [CrossRef] [PubMed]
  2. Miyoshi, T.; Itoh, M.; Akiyama, S.; Kitahara, A. ALPORAS aluminum foam: Production process, properties, and applications. Adv. Eng. Mater. 2000, 2, 179–183. [Google Scholar] [CrossRef]
  3. Bobyn, J.; Pilliar, R.; Cameron, H.; Weatherly, G. The optimum pore size for the fixation of porous-surfaced metal implants by the ingrowth of bone. Clin. Orthop. Relat. Res. 1980, 150, 263–270. [Google Scholar] [CrossRef]
  4. Göransson, P. Tailored acoustic and vibrational damping in porous solids–Engineering performance in aerospace applications. Aerosp. Sci. Technol. 2008, 12, 26–41. [Google Scholar] [CrossRef]
  5. Canham, L.T. Silicon quantum wire array fabrication by electrochemical and chemical dissolution of wafers. Appl. Phys. Lett. 1990, 57, 1046–1048. [Google Scholar] [CrossRef]
  6. She, J.; Yang, J.; Ohji, T. Thermal shock resistance of porous silicon nitride ceramics. J. Mater. Sci. Lett. 2003, 22, 331–333. [Google Scholar] [CrossRef]
  7. White, R.J.; Luque, R.; Budarin, V.L.; Clark, J.H.; Macquarrie, D.J. Supported metal nanoparticles on porous materials. Methods and applications. Chem. Soc. Rev. 2009, 38, 481–494. [Google Scholar] [CrossRef] [PubMed]
  8. Seo, J.S.; Whang, D.; Lee, H.; Im Jun, S.; Oh, J.; Jeon, Y.J.; Kim, K. A homochiral metal–organic porous material for enantioselective separation and catalysis. Nature 2000, 404, 982–986. [Google Scholar] [CrossRef] [PubMed]
  9. Staszewski, W.; Boller, C.; Tomlinson, G.R. Health Monitoring of Aerospace Structures: Smart Sensor Technologies and Signal Processing; John Wiley & Sons: Hoboken, NJ, USA, 2004. [Google Scholar]
  10. Sodano, H.A.; Inman, D.J.; Park, G. A review of power harvesting from vibration using piezoelectric materials. Vib. Dig. 2004, 36, 197–206. [Google Scholar] [CrossRef]
  11. Jin, L.; Ma, S.; Deng, W.; Yan, C.; Yang, T.; Chu, X.; Tian, G.; Xiong, D.; Lu, J.; Yang, W. Polarization-Free High-Crystallization β-PVDF Piezoelectric Nanogenerator Toward Self-Powered 3D Acceleration Sensor. Nano Energy 2018, 50, 632–638. [Google Scholar] [CrossRef]
  12. Jaffe, B. Piezoelectric Ceramics; Elsevier: New York, NY, USA, 2012; Volume 3. [Google Scholar]
  13. Friswell, M.I.; Ali, S.F.; Bilgen, O.; Adhikari, S.; Lees, A.W.; Litak, G. Non-linear piezoelectric vibration energy harvesting from a vertical cantilever beam with tip mass. J. Intell. Mater. Syst. Struct. 2012, 23, 1505–1521. [Google Scholar] [CrossRef]
  14. Adhikari, S.; Friswell, M.I.; Inman, D.J. Piezoelectric energy harvesting from broadband random vibrations. Smart Mater. Struct. 2009, 18, 115005. [Google Scholar] [CrossRef]
  15. Erturk, A.; Inman, D. Broadband piezoelectric power generation on high-energy orbits of the bistable Duffing oscillator with electromechanical coupling. J. Sound Vib. 2011, 330, 2339–2353. [Google Scholar] [CrossRef]
  16. Madinei, H.; Khodaparast, H.H.; Adhikari, S.; Friswell, M.; Fazeli, M. Adaptive tuned piezoelectric MEMS vibration energy harvester using an electrostatic device. Eur. Phys. J. Spec. Top. 2015, 224, 2703–2717. [Google Scholar] [CrossRef]
  17. Neiss, S.; Goldschmidtboeing, F.; Kroener, M.; Woias, P. Piezoelectric Materials for Nonlinear Energy Harvesting Generators. In Journal of Physics: Conference Series; IOP Publishing: Bristol, UK, 2013; Volume 476, p. 012035. [Google Scholar]
  18. Cammarano, A.; Neild, S.; Burrow, S.; Wagg, D.; Inman, D. Optimum resistive loads for vibration-based electromagnetic energy harvesters with a stiffening nonlinearity. J. Intell. Mater. Syst. Struct. 2014, 25, 1757–1770. [Google Scholar] [CrossRef] [Green Version]
  19. Zhou, S.; Chen, W.; Malakooti, M.H.; Cao, J.; Inman, D.J. Design and modeling of a flexible longitudinal zigzag structure for enhanced vibration energy harvesting. J. Intell. Mater. Syst. Struct. 2017, 28, 367–380. [Google Scholar] [CrossRef]
  20. Masana, R.; Daqaq, M.F. Electromechanical modeling and nonlinear analysis of axially loaded energy harvesters. J. Vib. Acoust. 2011, 133, 011007. [Google Scholar] [CrossRef]
  21. Fukui, Y.; Kakimoto, K.; Yamagiwa, K.; Mitsuoka, T.; Ohbayashi, K. Effect of Pore Shape on the Electrical Property of Porous LNKN Piezoceramics. Ferroelectrics 2008, 367, 133–138. [Google Scholar] [CrossRef]
  22. Bowen, C.R.; Perry, A.; Lewis, A.C.F.; Kara, H. Processing and properties of porous piezoelectric materials with high hydrostatic figures of merit. J. Eur. Ceram. Soc. 2004, 24, 541–545. [Google Scholar] [CrossRef]
  23. Roscow, J.I.; Taylor, J.; Bowen, C.R. Manufacture and characterization of porous ferroelectrics for piezoelectric energy harvesting applications. Ferroelectrics 2016, 498, 40–46. [Google Scholar] [CrossRef] [Green Version]
  24. Martínez-Ayuso, G.; Friswell, M.I.; Adhikari, S.; Khodaparast, H.H.; Featherston, C.A. Energy harvesting using porous piezoelectric beam with impacts. Procedia Eng. 2017, 199, 3468–3473. [Google Scholar] [CrossRef]
  25. Roscow, J.I.; Topolov, V.Y.; Bowen, C.R.; Taylor, J.; Panich, A.E. Understanding the peculiarities of the piezoelectric effect in macro-porous BaTiO3. Sci. Technol. Adv. Mater. 2016, 17, 769–776. [Google Scholar] [CrossRef] [PubMed]
  26. Zhang, Y.; Chen, L.; Zeng, J.; Zhou, K.; Zhang, D. Aligned porous barium titanate/hydroxyapatite composites with high piezoelectric coefficients for bone tissue engineering. Mater. Sci. Eng. C 2014, 39, 143–149. [Google Scholar] [CrossRef] [PubMed]
  27. Zhang, Y.; Bao, Y.; Zhang, D.; Bowen, C.R. Porous PZT ceramics with aligned pore channels for energy harvesting applications. J. Am. Ceram. Soc. 2015, 98, 2980–2983. [Google Scholar] [CrossRef] [Green Version]
  28. Mori, T.; Tanaka, K. Average stress in matrix and average elastic energy of materials with misfitting inclusions. Acta Metall. 1973, 21, 571–574. [Google Scholar] [CrossRef]
  29. Eshelby, J.D. The determination of the elastic field of an ellipsoidal inclusion, and related problems. Proc. R. Soc. Lond. A 1957, 241, 376–396. [Google Scholar] [CrossRef]
  30. Pierard, O.; Friebel, C.; Doghri, I. Mean-field homogenization of multi-phase thermo-elastic composites: A general framework and its validation. Compos. Sci. Technol. 2004, 64, 1587–1603. [Google Scholar] [CrossRef]
  31. Wu, T.T. The effect of inclusion shape on the elastic moduli of a two-phase material. Int. J. Solids Struct. 1966, 2, 1–8. [Google Scholar] [CrossRef]
  32. Dunn, M.L.; Taya, M. Electromechanical properties of porous piezoelectric ceramics. J. Am. Ceram. Soc. 1993, 76, 1697–1706. [Google Scholar] [CrossRef]
  33. Martinez-Ayuso, G.; Friswell, M.I.; Adhikari, S.; Khodaparast, H.H.; Featherston, C.A. Porous piezoelectric materials for energy harvesting. In Proceedings of the International Conference on Noise and Vibration Engineering, Leuven, Belgium, 19–21 September 2016. [Google Scholar]
  34. Mikata, Y. Determination of piezoelectric Eshelby tensor in transversely isotropic piezoelectric solids. Int. J. Eng. Sci. 2000, 38, 605–641. [Google Scholar] [CrossRef]
  35. Martinez-Ayuso, G.; Friswell, M.I.; Adhikari, S.; Khodaparast, H.H.; Berger, H. Homogenization of porous piezoelectric materials. Int. J. Solids Struct. 2017, 113, 218–229. [Google Scholar] [CrossRef]
  36. Iyer, S.; Venkatesh, T. Electromechanical response of (3-0) porous piezoelectric materials: Effects of porosity shape. J. Appl. Phys. 2011, 110, 034109. [Google Scholar] [CrossRef]
  37. Roscow, J.; Zhang, Y.; Taylor, J.; Bowen, C. Porous ferroelectrics for energy harvesting applications. Eur. Phys. J. Spec. Top. 2015, 224, 2949–2966. [Google Scholar] [CrossRef] [Green Version]
  38. Dunn, M.L.; Taya, M. An analysis of piezoelectric composite materials containing ellipsoidal inhomogeneities. Proc. R. Soc. Lond. A 1993, 443, 265–287. [Google Scholar] [CrossRef]
  39. Kar-Gupta, R.; Venkatesh, T. Electromechanical response of porous piezoelectric materials: Effects of porosity distribution. Appl. Phys. Lett. 2007, 91, 062904. [Google Scholar] [CrossRef]
  40. Roscow, J.; Lewis, R.; Taylor, J.; Bowen, C. Modelling and fabrication of porous sandwich layer barium titanate with improved piezoelectric energy harvesting figures of merit. Acta Mater. 2017, 128, 207–217. [Google Scholar] [CrossRef] [Green Version]
  41. Zhang, Y.; Xie, M.; Roscow, J.; Bao, Y.; Zhou, K.; Zhang, D.; Bowen, C.R. Enhanced pyroelectric and piezoelectric properties of PZT with aligned porosity for energy harvesting applications. J. Mater. Chem. A 2017, 5, 6569–6580. [Google Scholar] [CrossRef] [PubMed] [Green Version]
Figure 1. Finite element model: (a) general view of the cantilever beam energy harvester with the left side clamped; (b) detailed view of the clamped side and the porous piezoelectric patch as well as the the resistor which connects the top surface with the bottom surface of the porous piezoelectric disk; and (c) schematic view of the external circuit connected to the harvester.
Vibration 01 00010 g001
Figure 2. (a) Material coefficients d 31 (red) and ϵ 33 (blue) predicted by homogenisation theory “Mori–Tanaka” (solid line) compared with the values measured experimentally (dots); (b) view of the laboratory setup; and detailed view of a porous patch attached to the aluminium beam at the bottom right corner.
Vibration 01 00010 g002
Figure 3. Dynamic test results performed on the non-porous patches. Solid lines correspond to simulation results and dashed lines correspond to experimental results.
Vibration 01 00010 g003
Figure 4. Identification of possible sources of non linearities through sweep in the amplitude of the base excitation.
Vibration 01 00010 g004
Figure 5. Test 9 which detached during the dynamic experiment.
Vibration 01 00010 g005
Figure 6. Dynamic test results (6–10) performed on the porous piezoelectric disks. FC, Free-casting; BS, BURPS. Solid lines correspond to simulation results and dashed line correspond to experimental measures.
Vibration 01 00010 g006
Figure 7. Dynamic test (11–14) results performed on the porous piezoelectric disks. FC, Free-casting; BS, BURPS. Solid lines correspond to simulation results and dashed line correspond to experimental measures.
Vibration 01 00010 g007
Figure 8. Comparison between the piezoelectric coefficients d 31 , d 33 and k 33 for different inclusion shapes, sphere (solid line) and cylindrical (dashed line). Data were obtained using the Mori–Tanaka.
Vibration 01 00010 g008
Figure 9. Uncertainty results for the voltage output of demonstrator Test 12. The simulation results for values between 40% and 120% of the nominal values of the piezoelectric coefficients are presented as a blue green area. Experimental results are given as blue line with blue circles and the results for the nominal values are given as dashed red line.
Vibration 01 00010 g009
Figure 10. Power output for given porosity percentage on Barium Titanate test samples. The resistance is constant (see Figure 1c) and the frequency excitation is equal to the first natural frequency of each sample.
Vibration 01 00010 g010
Table 1. Material properties of the non-porous piezoelectric patch supplied by Morgan Advance Ceramics PLC and the aluminium used for the beams.
PZT-5A Aluminium
Density ( kg / m 3 )7750 Density ( kg / m 3 )2700
S 33 E ( 10 12 m 2 / N )17.2 Young’s Modulus (GPa)70
S 11 E ( 10 12 m 2 / N )16.7 Poisson’s Ratio0.3
d 33 ( pC / N )409
d 31 ( pC / N )176 Beam Dimensions
ϵ 33 T / ϵ 0 1800 Length × Width × Thickness (mm)375 × 16 × 1
Table 2. The properties of the demonstrator patches using barium titanate.
Sample
Number
Porosity
(%)
Thickness
(mm)
Diameter
(mm)
Fabrication
Method
Piezoelectric Coeff.
d 31 ( pC / N )
Relative Permittivity
ϵ 33 T / ϵ 0
1662.0711.137BURPS−10290
2552.0011.240BURPS−60445
3501.8611.273BURPS−120526
4321.5011.247BURPS−190808
5201.2711.260BURPS−2501199
6451.789.940Freeze cast−340563
7352.0610.230Freeze cast−390702
8311.7010.640Freeze cast−300788
Table 3. Dynamic tests performed for the different values of porosity, fabrication method and resistance configuration.
Test NumberSample NumberMethod FabricationPorosityMain Resistor in SeriesResistor in Parallel
1#Ref-0.0%10.042 M Ω 0.9951 k Ω
2#Ref-0.0%14.677 M Ω 0.9951 k Ω
3#Ref-0.0%14.677 M Ω 9.987 k Ω
4#Ref-0.0%10.042 M Ω 9.987 k Ω
5#Ref-0.0%10.042 M Ω 9.987 k Ω
67Free-casting35.0%10.042 M Ω 9.987 k Ω
78Free-casting31.0%10.042 M Ω 9.987 k Ω
83BURPS50.0%10.042 M Ω 9.987 k Ω
91BURPS66.0%10.042 M Ω 9.987 k Ω
102BURPS55.0%10.042 M Ω 9.987 k Ω
117Free-Casting35.0%10.042 M Ω 9.987 k Ω
122BURPS55.0%10.042 M Ω 0.9951 k Ω
136Free-Casting45.0%10.042 M Ω 9.987 k Ω
145BURPS20.0%10.042 M Ω 9.987 k Ω
Table 4. Statistical values for the porous piezoelectric materials manufactured using the BURPS method. From [23].
d 33 (pC/m) d 31 (pC/m)
PercentageMeanS.D.MeanS.D.
3050.745.67−0.690.45
4076.549.83−4.861.20
5090.485.65−11.371.81
6097.087.23−17.651.52
7099.014.85−19.401.39
8091.905.36−22.560.48
90100.359.09−30.3011.12
Nominal149−59

