
Calcium Carbonate as Functional Filler in Polyamide 12-Manipulation of the Thermal and Mechanical Properties


1
Research and Development Department, Omya International AG, 4665 Oftringen, Switzerland
2
Department of Printing and Media, Hochschule der Medien, 70569 Stuttgart, Germany
3
College of Engineering, Swansea University, Swansea SA2 8PP, UK
4
School of Chemical Engineering, Department of Bioproducts and Biosystems, Aalto University, 00076 Aalto, Helsinki, Finland
*
Author to whom correspondence should be addressed.
Processes 2021, 9(6), 937; https://doi.org/10.3390/pr9060937
Submission received: 8 May 2021
/
Revised: 21 May 2021
/
Accepted: 24 May 2021
/
Published: 26 May 2021
(This article belongs to the Special Issue Particulate-Filled Advanced Polymer Composites)
Abstract
:Adjusting the thermal response properties of a polymeric compound can significantly improve the usability in a selective laser-sintering process. As previously shown, combining a precise amount of coarse and narrow size distribution fine calcium carbonate fillers results in a potential optimization of the thermal properties of a polyamide 12 matrix. Additionally, up to 60% of the normally associated lost ductility can be re-gained by surface modification, thus functionalizing the filler. To optimize the functionality further this study combines a precisely defined particle size ratio of fillers adopting a specially selected surface modification using amino hexanoic acid. Morphology of the carbonate filler was also investigated. The range of effect of each parameter on the thermal response and mechanical properties was studied. The results show that the thermal properties have large potential to be optimized, without reducing the ductility significantly, by adjusting the morphology and size ratio of coarse and fine filler particles. The compound properties were demonstrated using a twin-screw extruder, indicating the potential for producing a preparate composite for additive manufacturing.
1. Introduction
Previous work illustrated the role of a functional filler in a polyamide 12 polymer matrix with respect to its physical properties relating to particle size and thermal response. However, an open question remaining is whether it is possible to find an optimum between the contrasting effect of particle number loading, related to particle size per unit loading, and the thermal capacity distribution of those particles in the polymer matrix. Additionally, the effect of ground rhombohedral calcite only used as functional filler was previously illustrated. The second open question is whether changing particle morphology at a given particle size renders a further opportunity of optimizing the filler functionality in the polymer matrix. We address this question by adopting a precipitated calcium carbonate exhibiting nested crystal structure in the form of an aggregate of scalenohedral calcite.
Additive manufacturing (AM) is defined as a process for joining materials step-by-step forming a three dimensional object, which advantageously can be constructed directly via computer-aided design (CAD), usually layer upon layer [1,2]. As opposed to the subtractive (machining) manufacturing methods, such AM technologies are able to construct more complex objects [3]. AM technologies have been introduced in various areas of application, such as aerospace, automotive, artistic design, and biomedicine [3,4,5,6]. Materials commonly used in AM are often plastic or metal based [7,8].
Approximately 40 years ago, the company 3D Systems was created and started the development of polymer-based additive manufacturing. There are several individual technologies available today, which are all focused on polymer printing and are, in part, based on totally different principles of material cohesion. Selective laser sintering (SLS) is one such additive manufacturing process, in which energy is introduced by laser into a powder bed, where discrete powder particles are fused together. By overlapping sequential layers of powder, a three-dimensional body is produced [4]. The most frequently used thermoplastics are polyamides/nylons, typically polyamide 12 [5].
In the past decade, many investigations have been carried out to optimize the laser-sintering process and define the limitations and most significant control factors [5,6,7,8,9,10,11]. Parameters having the most crucial influence on the performance of a composite suitable for laser sintering are the particle size and morphology as well as the thermal properties of the polymer/composite powder [12]. Besides investigating the possibility to improve the sintering process, Y. Guo et al., for example, introduced the principle of reducing the overall material costs, by blending the pure polymer with an environmentally friendly mineral filler [13]. This also addresses the environmental issue and high energy consumption, normally considered synonymous with selective laser sintering [14,15,16].
Previous investigations in classical polymer composite development demonstrated how beneficial it can be to introduce filler material into the polymer matrix, which shows a difference in thermal conductivity as well as thermal capacity. In the case of additive manufacturing, a higher thermal conductivity (than polyamide 12 alone) can be expected to result in a reduction of the needed laser power to sinter the polymer, while the greater thermal capacity of the filler material will likely be expressed in the ability to increase the total energy density without causing process errors, such as a deformation of the final part or surface defects [17].
Since the introduction of a rigid mineral filler, such as calcium carbonate, into a polymer classically results in an undesirable loss of mechanical properties in the final part, the interfacial interaction between the composite component fractions needs to be considered carefully to achieve and maintain optimal properties. The compatibility between the polymer matrix and the filler particle surface is usually poor, and so the adhesion between them ends up being weak [18]. Considering calcium carbonate as the mineral filler, an adhesion promoter acting between the free nitrogen groups within the polyamide 12 chains and the reactive calcium carbonate surface can be implemented, which can significantly improve the compatibility and, hence, adhesion between polymer and filler.
Shi et al. illustrated the now industry standard of coating calcium carbonate with stearic acid to aid compatibility between the filler and polymer [19]. As suggested by H. Goodman, a surface modification with an amino-group containing carboxylic acid, such as 6-aminocaproic acid, can improve the bonding strength of the polar groups within the polymer structure, while the hydroxyl groups of the calcite surface react with carboxylic acid containing a modifier agent in a condensation reaction [19,20].
Previous investigations by the current authors have shown that the chemical interaction between a calcium carbonate filler and the surrounding polyamide 12 matrix can also be improved by an adjusted chemical coating of the mineral filler. This results in an improved processability as well as a regain of the lost mechanical properties of a produced element [21]. Surface modification in this way, now combined with designed particle size distribution and morphology of the calcium carbonate filler is the focus of the work reported here in maximizing the functional benefits of filler addition as a precursor to additive manufacture.
Calcium carbonate is an abundant filler, which imparts advantageous functionality as filler and coating pigment for paper, consumer goods, paints and adhesives, rubbers and plastics [22,23,24,25,26,27,28,29,30]. Calcium carbonate, in a form usable as a mineral filler in such applications, is typically produced either by crushing/milling (top-down process) or a synthetic precipitation (bottom-up process). In the top-down process, natural calcium carbonate is crushed and ground down either by dry or wet milling to produce ground calcium carbonate (GCC) having a desired particle size distribution. The energy, needed to break down the coarse primary particles, is applied to the calcium carbonate via various grinding processes, such as jaw crusher, pin mill, jet mill, ball mill, roller mill, agitator bead mill etc., [18]. Synthetic precipitated calcium carbonate (PCC) is produced by carbonation, in which carbon dioxide is introduced into a calcium hydroxide solution/slurry to precipitate calcium carbonate. By the controllable synthesis of precipitated calcium carbonate, the crystal structure, particle size distribution as well as morphology of the final filler product can be adjusted precisely. Typically, PCC can be synthesized as rhombohedral or scalenohedral calcite or aragonite. As shown by Thenepalli et al., the physical properties of calcium carbonate fillers are differentiated depending on the crystal structure and morphology of the final product (Table 1) [27].
The global demand for both GCC and PCC for use as mineral filler for the plastics industries continues to increase [27]. One growing market for polymer is in additive manufacturing, though the opportunity for benefiting from functional fillers has so far been neglected.
2. Materials and Methods
2.1. Materials
The mineral filler used for this study was “Omyacarb® 10-AV,” a marble-derived ground calcium carbonate (GCC) provided by Omya International AG (Baslerstrasse 42, 4665 Oftringen, Switzerland).
The precipitated calcium carbonate (PCC), was produced in the usual way from slaked calcium oxide, provided by Omya International AG (Baslerstrasse 42, 4665 Oftringen, Switzerland), and carbonating the resulting calcium hydroxide under chosen conditions to reach the desired particle size distribution.
SLS-approved polyamide 12 (EOS PA2200) powder was sourced from EOS e-Manufacturing Solutions (Electro Optical Systems, Robert-Stirling-Ring 1, 82152 Krailling, Germany).
General specifications for the materials described above are listed in Table 2.
For the filler surface modification agent, 6-amino hexanoic acid was chosen, which was selected from among various amino-containing acids as having been shown to perform the most advantageously [21]. The material specification for the surface modifier, as supplied, is listed in Table 3 and the molecular structure is shown in Figure 1.
2.2. Functional Filler Production
The particle size of the GCC-feed was adjusted to form three variant fillers ranging from coarse through medium to small particle size distribution (samples c-G, m-G and s-G, respectively) by dispersing the starting product in demineralized water to a solids content of 25 w/w% and grinding the suspension in an agitator ball mill (Dyno®-Mill KDL-Pilot from Willy A. Bachofen AG Maschinenfabrik, 4132 Muttenz, Switzerland) employing a grinding medium consisting of zirconium dioxide beads, having a particle size of 0.7–1.4 mm. It is to be noted that no dispersing aid was used during the grinding to avoid any negative influence on the subsequent surface treatment.
Two PCCs, one coarse and one small particle size (samples c-P and s-P) were produced by first diluting the calcium oxide to a solids content of 10 w/w%, adding 0.05–0.1 w/w% sucrose to the slaking water and slaking for 30 min to form calcium hydroxide. Carbonation was then made by bubbling a continuous controlled CO2 flow until a specified equilibrium conductivity and resulting particle size, and morphology/crystal habit of coarse rhombohedral or fine scalenohedral calcite was achieved [31].
The volume-defined particle size distribution of all products was determined using time-average laser light scattering (Malvern Instruments Mastersizer 3000, Malvern Panalytical Ltd., Enigma Business Park, Grovewood Road, Malvern WR14 1XZ, United Kingdom), adopting the Fraunhofer particle scattering cross-section model. The distribution is described by the volume per cent of particles (vN) finer than a given particle diameter, dvN. All samples were stabilized in aqueous suspension in advance of measurement by adding approx. 500 ppm of a polyacrylate-based dispersing agent.
After all desired filler product specifications were achieved, the carbonate suspensions were dewatered via a chamber filter press and subsequently spray dried using a “GEA Niro MOBILE MINORTM” nozzle spray dryer (GEA Group, Peter-Müller-Strasse 12, 40468 Düsseldorf, Germany). The atomization pressure in the dryer was kept constant at 3 bar, with an inlet temperature of 200 °C and an outlet temperature of 90 °C.
The specific surface area (SSA) was determined via the nitrogen gas adsorption method (BET-Method) [13] (ASAP 2460 Surface Area and Porosity Analyzer, Micromeritics®, 4356 Communications Drive, Norcross, GA 30093-2901, USA). All produced main single component functional fillers are listed in Table 4.
The morphology of each developed functional filler was recorded using a field emission scanning electron microscope (FESEM) (Zeiss Sigma VP, Carl-Zeiss-Strasse 22, 73447 Oberkochen, Germany). The samples were Au-coated and analyzed using a secondary electron detector (SE) which clearly revealed the particle shape of each filler type.
As suggested in a previous publication [17,32], the precise combination of a coarse and a fine filler fraction results in precisely optimized thermal and crystallization parameters.
Table 5 gives an overview of all tested filler mix ratios, and hence the discrete particle size distribution ratios as well as the resulting total carbonate specific surface. Figure 2 and Figure 3 show the particle size distribution of each of the used functional fillers and blends thereof. The precise mixtures result in a specifically controlled bimodal particle size distribution, as desired for the investigation.
Surface Modification and Amount
The surface modification of the dried filler materials was carried out using a dry process. Each raw filler material was pre-heated to 120 °C and treated with the precisely determined amount of coating agent in a batch coater (MP-LB mixer from Somakon Verfahrenstechnik UG, 44536 Lünen, Germany). Mixing was maintained for 10 min with a constant stirring speed of 500 min−1 (rpm) to ensure homogeneity.
In the previous investigation, it was found that the optimized filler/coated adhesion promoter (surface modifier) ratio, in terms of improved mechanical properties, was achieved at approx. 2.5 to 3.0 mmol of treatment agent per 100 m2 calcium carbonate [21]. To determine the influence of the surface modifier amount on thermal properties within this optimized mechanical range previously found, two modifier levels were considered and tested, series 1 and 2, respectively, where series 1 employed the maximal level of surface treatment (~3 mmol per 100 m2) applied to all single component fillers before mixing into the designed blends as shown in Table 5, and series 2 the reduced amount toward the lower end of the range (~2 mmol per 100 m2) applied to selected examples of the single components and thus used in a second series of blends. Table 6 and Table 7 show an overview of the resulting single component functional fillers and their modifier amount for series 1 and 2, in which the higher amount of modification and lower modification levels were used, respectively.
Additionally, a third series was constructed, in which only the fine filler fraction was surface modified at the lower level (~2 mmol per 100 m2), to prevent the modification agent from interfering with the thermal transfer between the coarse filler fraction and the polymer matrix. Table 8 gives an overview of the tested ratios from series 2 and 3, showing the differences between the untreated and treated fractions.
As control samples, the same filler blends and ratios were tested in which the mineral filler was not surface modified at all, having the properties as shown previously in Table 4 and Table 5. This was carried out to be able to evaluate the effect the calcium carbonate alone gives to the system and what effect the surface modification has on the thermal and mechanical properties.
2.3. Composite Manufacturing
Formulation Mixing and Compounding
To produce a homogeneously mixed powder blend, a batch mixer (MP-LB mixer from Somakon Verfahrenstechnik UG, 44536 Lünen, Germany) was used, in which the solid polyamide 12 powder was homogeneously pre-mixed with the specific weight-defined amount of the functional filler. This powder blend was directly used in compounding using a twin-screw extrusion process.
The surface area was used to describe the functional loading effect of the filler per given mass of polymer. Table 9 shows the used filler loadings as well as the resulting surface area of filler introduced per given mass of polymer.
Compounds were extruded via a twin-screw extruder system (Extruder ZE 12 from Three-Tec GmbH, 5703 Seon, Switzerland). A barrel-length of 25 cm was chosen with a twin-screw diameter of 12 mm and a flank pitch of 12 mm. Inlet temperature was set at 160 °C, followed by a compounding zone at 200 °C and an outlet temperature of 170 °C. To keep the residence time at approximately 30 s, the twin-screw rotation speed was maintained constant for all trials at 90 min−1 (rpm). For the thermal analysis, the compounds were formed through a filament nozzle with a diameter of 2 mm and granulated into cylindrical pellets with a length ≈ 1 mm.
For the investigation of the morphology and uniformity of the compounds, approx. 1-mm-thick sample plates with a width of 3 cm were produced. The compound was formed in this case through a plate nozzle with a thickness of 2 mm and a width of 2 cm, passed through a calender press and pulled by an extract roller. The calender was set to a thickness of 1 mm and a roller speed adjusted to the extruder. For mechanical analysis, the resulting plates were punched to normalized tensile test “dog bones” for further analysis.
To avoid any humidity influence on the investigations, the produced samples were kept at a constant relative humidity of 50% and 22 °C for at least 24 h before analysis.
2.4. Composite Analysis
2.4.1. Scanning Electron Microscopy
The resulting compound structure and homogeneity of the polymer/filler matrix was visually observed using scanning electron microscopy (SEM) (Zeiss Sigma VP, Carl-Zeiss-Strasse 22, 73447 Oberkochen, Germany).
The compound samples were embedded in epoxy resin and SEM specimens were prepared by cutting down the surface with a diamond knife (20 μm and 15 μm) and polishing with corundum (0.05 μm). The specimens were studied with a backscatter detector in variable pressure mode (50 Pa) at 20 kV and a 60 μm cover.
2.4.2. Thermal Response Analysis
Important parameters to determine the usability of a new compound for the SLS-approach concern the melting and solidification behavior. Therefore, the physical phase change behavior in response to the thermal energy input is an important measure of suitability for SLS [33].
Melt Flow Index
Understanding the melt viscosity of a compound in the SLS process is very important. As alternative to the very precise but complex measurement method of a cone-plate rheometer, the melt flow index provides an easier access to basic rheological data, which is commonly used in the plastics industry [1]. The melt flow index is the flow in grams that occurs within 10 min through a standard die, when a fixed pressure is applied to the melt via a piston at a temperature at/above the melt temperature of the polymer. At the used conditions of the test, the MFI is an inverse measure of the melt flow viscosity [33]. It has to be kept in mind, that the resulting viscosity value for a measured material is only valid at the given applied force and temperature.
The MFI was determined with the use of a “CEAST Melt Flow Index Tester Model 702700” according to the “DIN EN ISO 1133” guidelines. The compound was pre-heated in the barrel for 5 min without load at 190 °C. Afterwards a constant pressure exerted by a force of 2.16 kgf, was given to the compound and pressed through a die with a diameter of 2.095 mm. The measuring length was kept constant at 20.00 mm.
Differential Scanning Calorimetry
The temperature transitions and melting range of polymers can be observed by recording a differential scanning calorimetry (DSC) plot. DSC is a thermo-analytical technique where the heat difference between a sample and the reference is measured as a function of temperature. The reference and the sample are heated at a specific heating rate above the melting temperature of the sample and afterwards cooled at a specific heating rate to below the crystallization point. The difference in the heat-curve gives information of the different phase transitions. At a specific temperature, the sample undergoes a physical transformation (phase transition), in which more or less heat is needed than the reference to maintain both at the same temperature [34].
Due to the absorption of heat by the sample (endothermic phase transition), more heat is required during the melting process to increase the sample temperature at the same rate as the reference. During the cooling step, the sample crystallizes back to the solid state and less heat is required to keep the temperature at the reference level due to the exothermic phase transition from liquid to solid [35].
DSC curves were recorded on a Mettler-Toledo DSC 823 apparatus under a continuous nitrogen flow of 50 cm3 min−1. An approx. 7 mg sample was heated to 100 °C, kept constant for 2 min, heated up to 200 °C at a rate of 5 °C min−1, and then kept at a constant temperature for an additional 2 min. To determine the crystallization properties, the melt was cooled down to 100 °C at a rate of 5 °C min−1. Figure 4 shows the schematic temperature program used for the melting and crystallization temperature determination measurements. Figure 5 represents a typical DSC curve, obtained with this method, showing the main thermal properties that are detected through this analysis.
For a detailed investigation of the crystallization kinetics, the crystallization time was measured at a constant temperature to provide a record of the material’s isothermal response [36]. The samples (≈7 mg) were heated to 100 °C, kept constant for 2 min, heated up to 200 °C at a rate of 20 °C min−1, cooled down with a cooling rate of 40 °C min−1, and finally kept at the measuring temperature of 172 °C, until the sample was completely crystallized back. Figure 6 shows the schematic temperature program used for the crystallization time determination measurements.
2.4.3. Mechanical Tensile Properties
The mechanical properties of each compounded sample were evaluated with a Zwick/Roell ProLine table-top testing machine (ZwickRoell GmbH & C. KG, August-Nagel-Strasse 11, 89079 Ulm, Germany) according to the European Norm ISO 527-1 guidelines. Ten tensile test dog bones of each compound were measured adopting a tensile extension rate of 1 mm min⁻1 providing a determination between 0.05% and 0.25% extension. Afterwards, the yield stress was measured under an extensional rate of 50 mm min⁻1, with a force threshold of 60% of the maximum force and a sensitivity of 0.5%.
3. Results and Discussion
3.1. Mineral Difference
Figure 7 shows the morphological structure of the five main untreated single components functional fillers “Filler c-G to s-P,” before blending the different mixtures. As it was already shown through the particle size distribution measurement, the coarse ground calcium carbonate filler “c-G” shows a much higher presence of ultrafine particles, than the precipitated calcium carbonate filler with a comparable median dv50, “c-P.” This can be explained by the nature of the wet grinding process, in which a dynamic dissolution and re-precipitation of such ultrafine particles occur, in addition of the grinding itself, in which a larger amount of fines from the desired larger particles are produced [32]. This broad particle size distribution seen in a GCC can be changed by subsequent processing, e.g., differential centrifugation, or avoided, as followed here, by precisely controlling the nucleation and crystal-growth during the precipitation process of calcium carbonate out of calcium hydroxide [37].
Comparing the GCC-Filler “m-G” with the PCC-Filler “s-P,” even at comparable median dv50 there is a higher fraction of ultrafines in the GCC-Filler, and so the control of specific surface area of the filler can be enhanced in the PCC case through adjusting crystal-growth/structure build-up in the precipitation process. With the controlled “cigar/needle-like” crystal-growth and agglomerated structure of the scalenohedral, the inner-particle specific surface area can be almost doubled, compared to a regular wet ground calcium carbonate filler. This enhances the free surface implemented in the polymer matrix, available for energy absorption and quick energy release, without losing the benefit of having a high primary particle area for the set effect on cooling.
3.2. Homogeneity of Filler Distribution
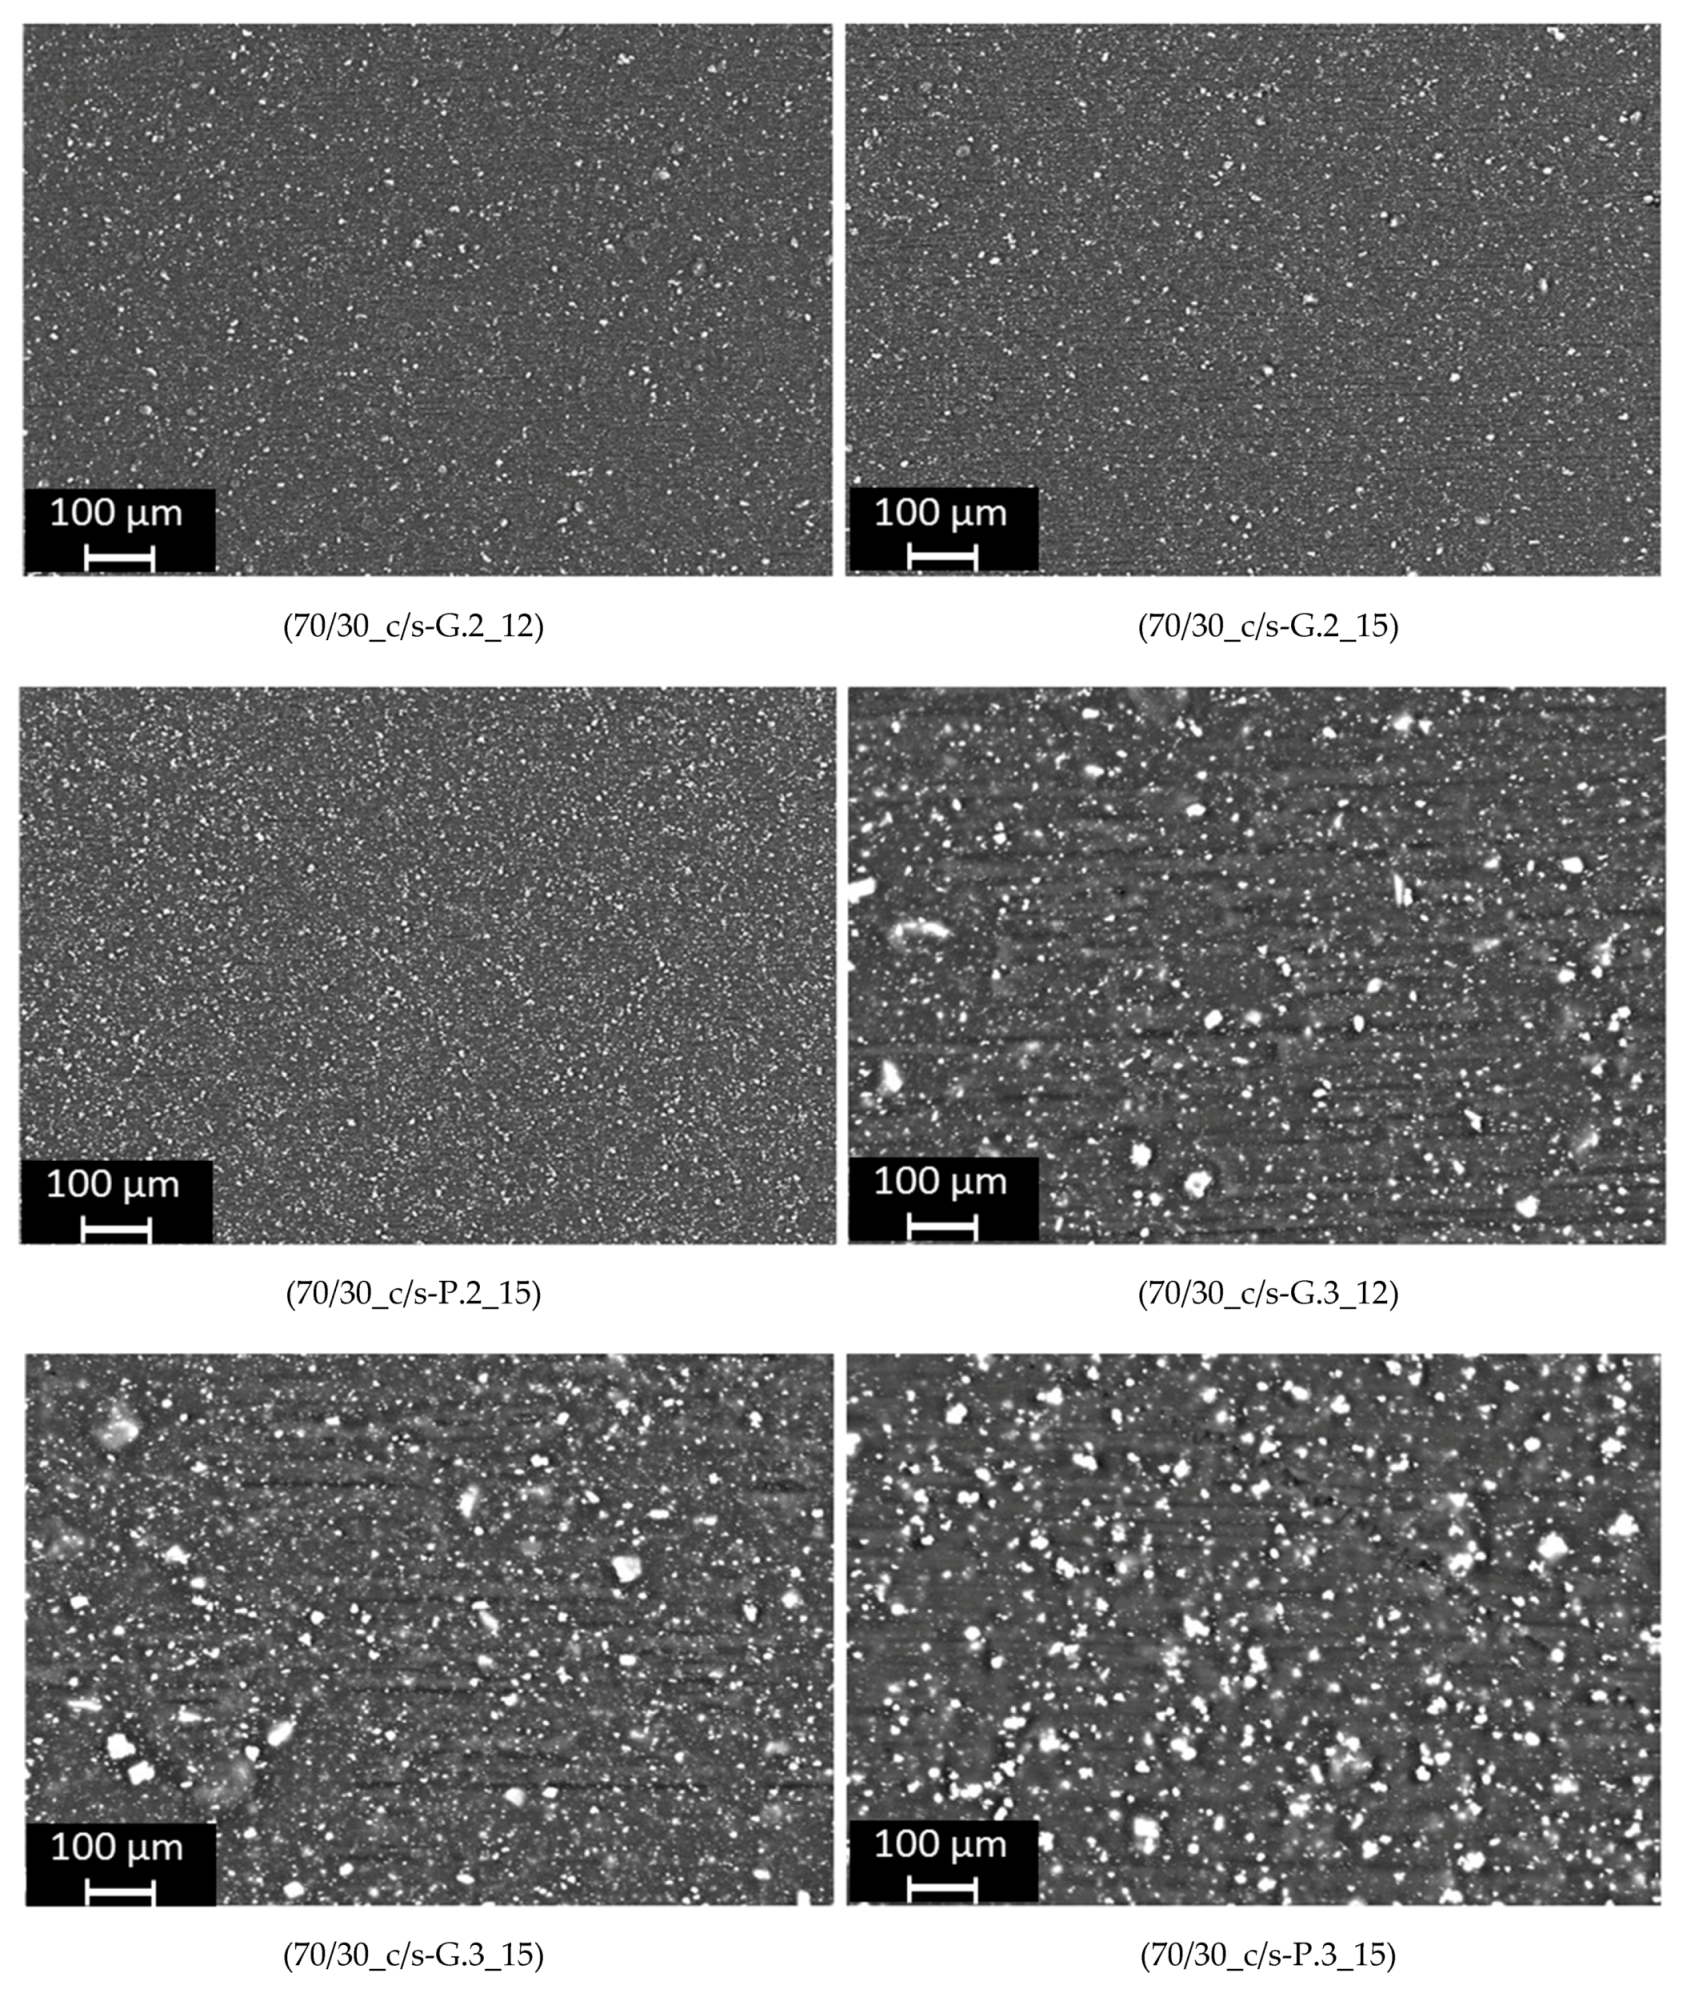
The elemental contrast within each compounded sample can be observed in the SEM pictures in Figure 8. The filler materials reflect more electrons in the backscatter detector and appear brighter (white spots on the image) than the polymer matrix, which constitutes the black (electron-absorbing) background. The images in Figure 8 are taken at relatively low magnification so that the visual distribution of particles represented can be considered statistically relevant.
In all cases, the filler material is homogeneously distributed throughout the polymer matrix, and the contrast in particle size distributions is readily observable. Independent of the filler amount or the filler particle size, the fine and coarse mineral filler particles are homogeneously distributed throughout the whole polymer matrix, without any significant agglomerations occurring. This indicates that the resulting effects the filler shows on the thermal and mechanical properties are based on an essentially agglomeration-free filler distribution. The exception to this is the case of the PCC filler structure, which itself is an agglomerate. However, this agglomerate is considered to be a primary agglomerate, i.e., part of the particle structure itself, and not a secondary agglomerate related to poor dispersion within the compound matrix.
3.3. Melt Properties
3.3.1. Influence of Untreated Functional Filler Ratio/Morphology on Melt Properties
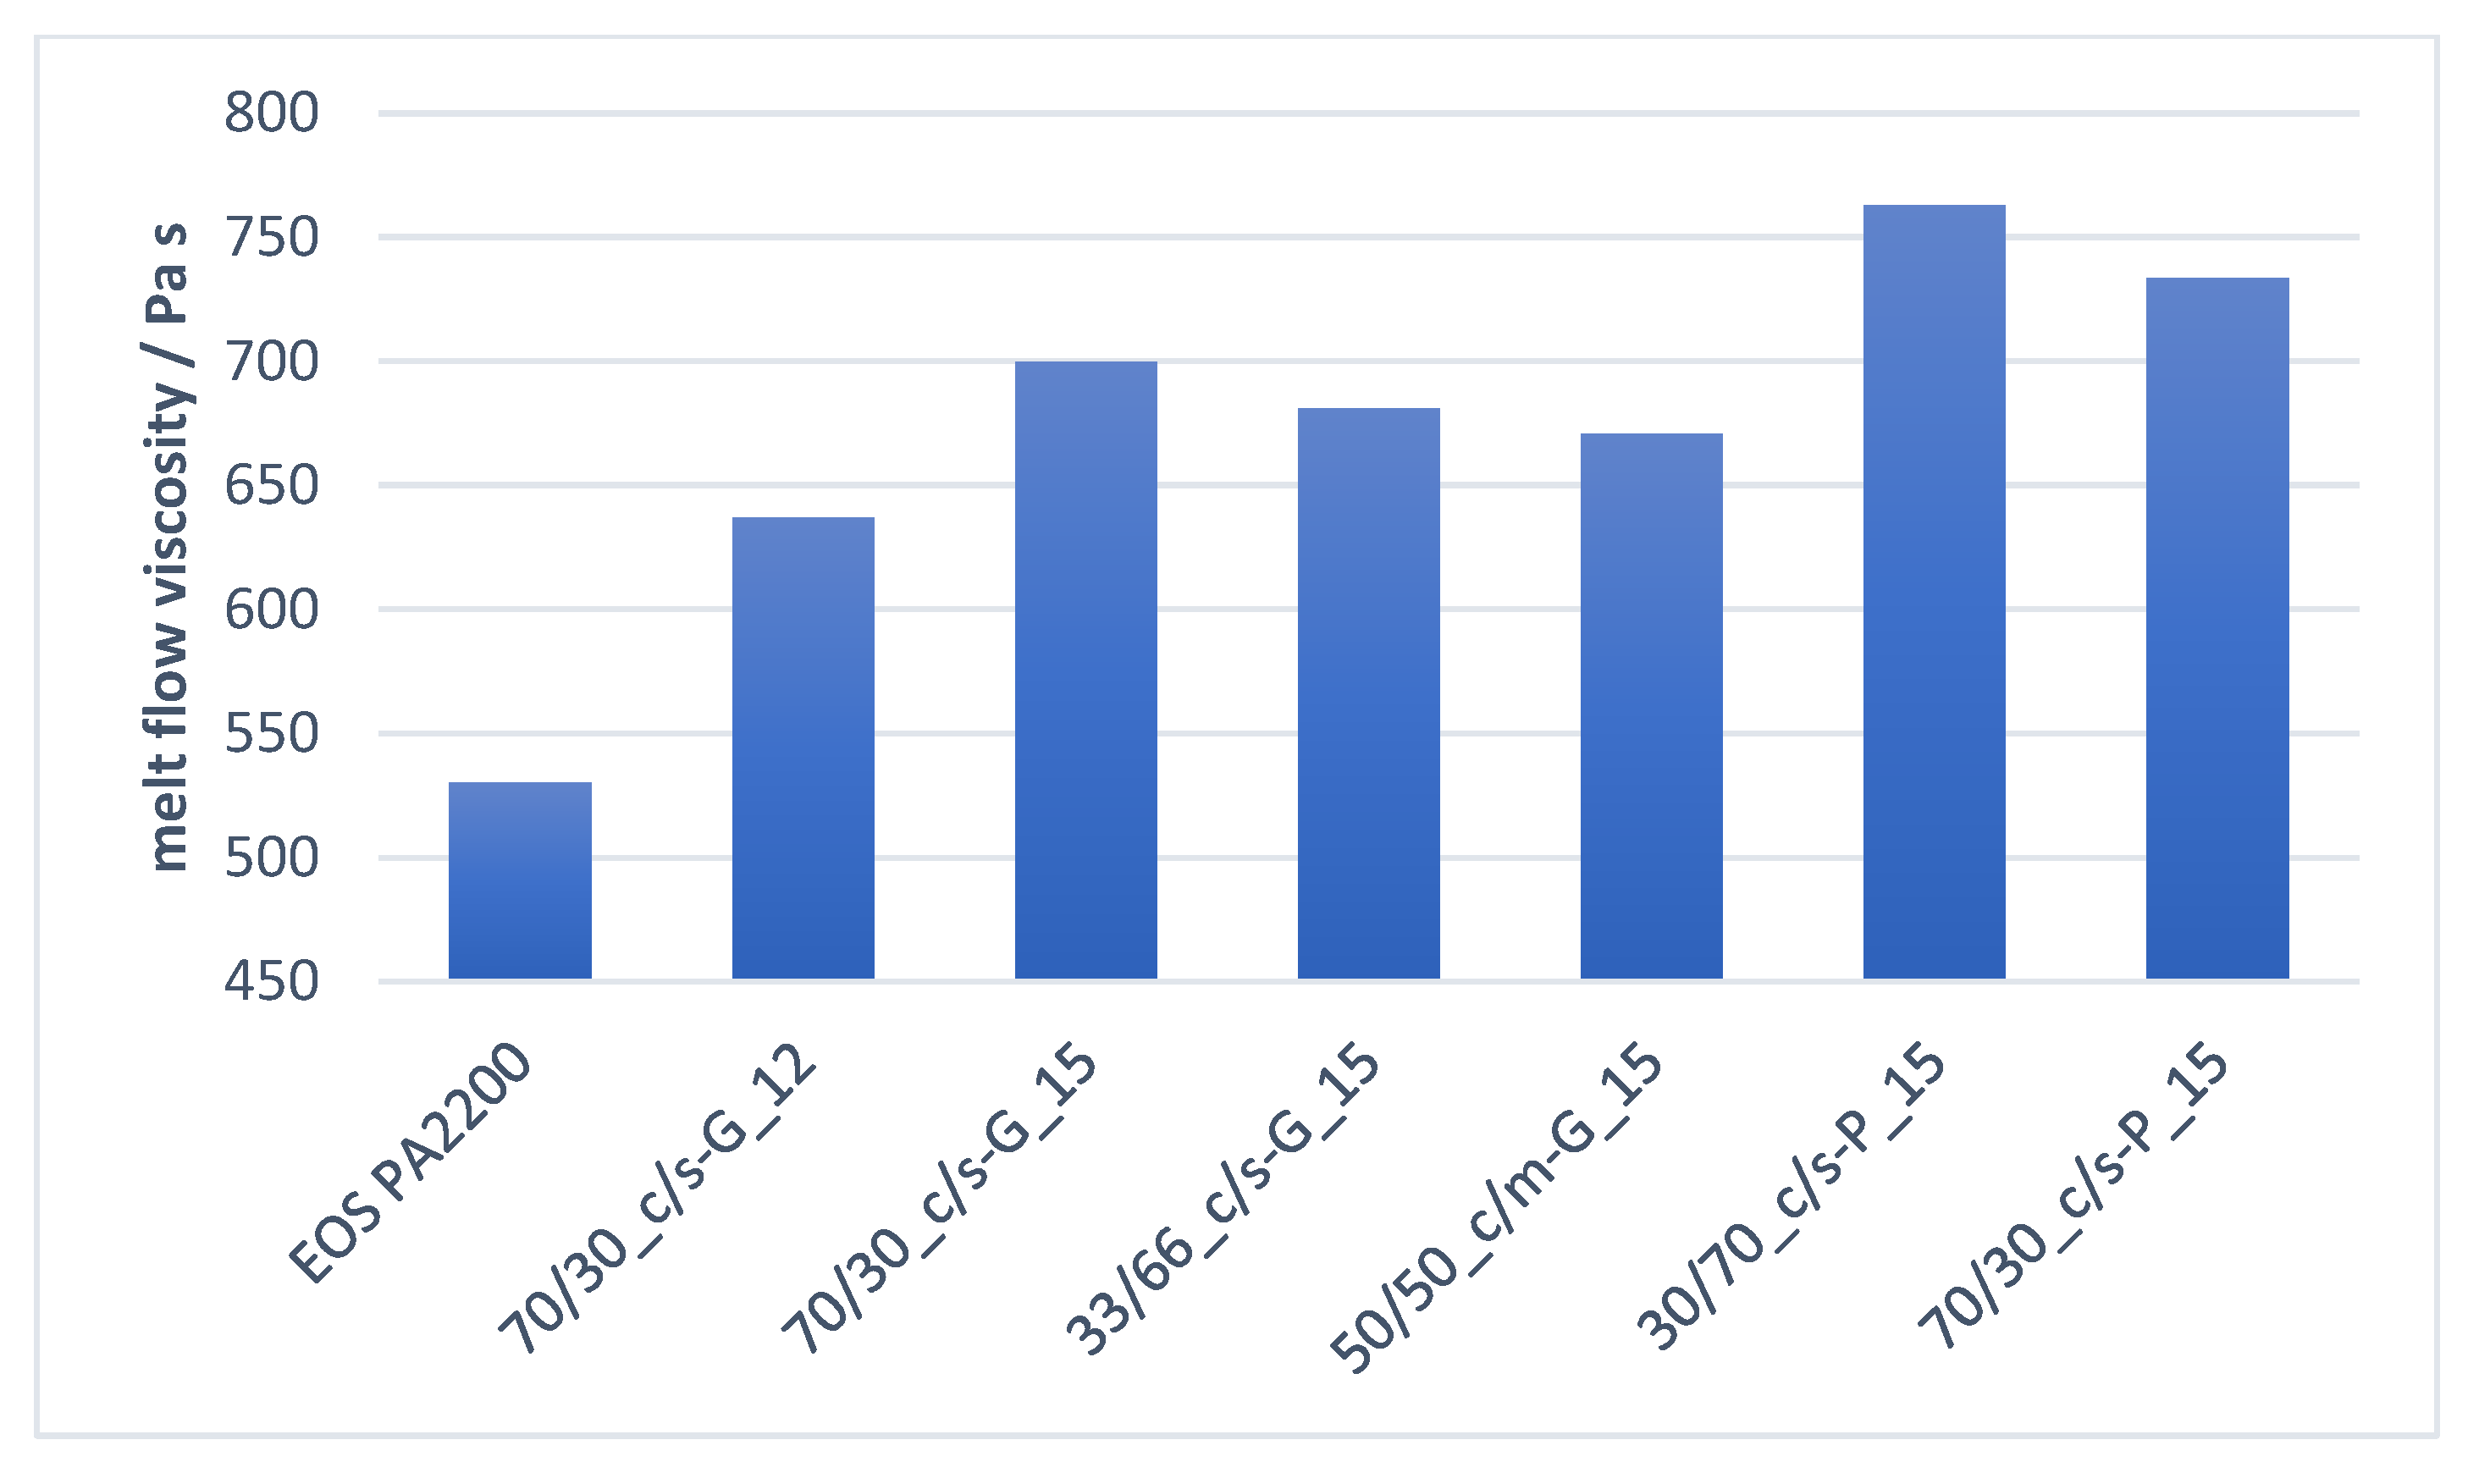
The effect, which the pure, untreated functional filler blend had on the melt properties is shown in Figure 9 and Figure 10. As was shown in previous investigations, the melt flowability decreases with an increased amount of filler material compounded in polyamide 12 / polyolefin [17,38]. By controlling the ratio of the coarse fraction, which shows a greater impact on the melt flow viscosity at high introduced filler surface levels than the same amount of fine particles [17], a further decrease of the mold flowability can be prevented.
Comparing the untreated GCC compound version “33/66_c/s-G_15” and “50/50_c/m-G_15” with the PCC-based functional fillers, the precipitated calcium carbonate functional filler has a more significant and higher impact on the melt flowability. This can be explained by considering and comparing the morphology of the two used fine fillers. As illustrated in Section 3.1, the PCC “s-P” has a distinctive spiky structure, which increases the inner available particle surface for an improved energy transfer but reduces the smooth particle flowability versus the case for the GCC “m-G” and “s-G,” which show a more spherical structure and better melt flowability.
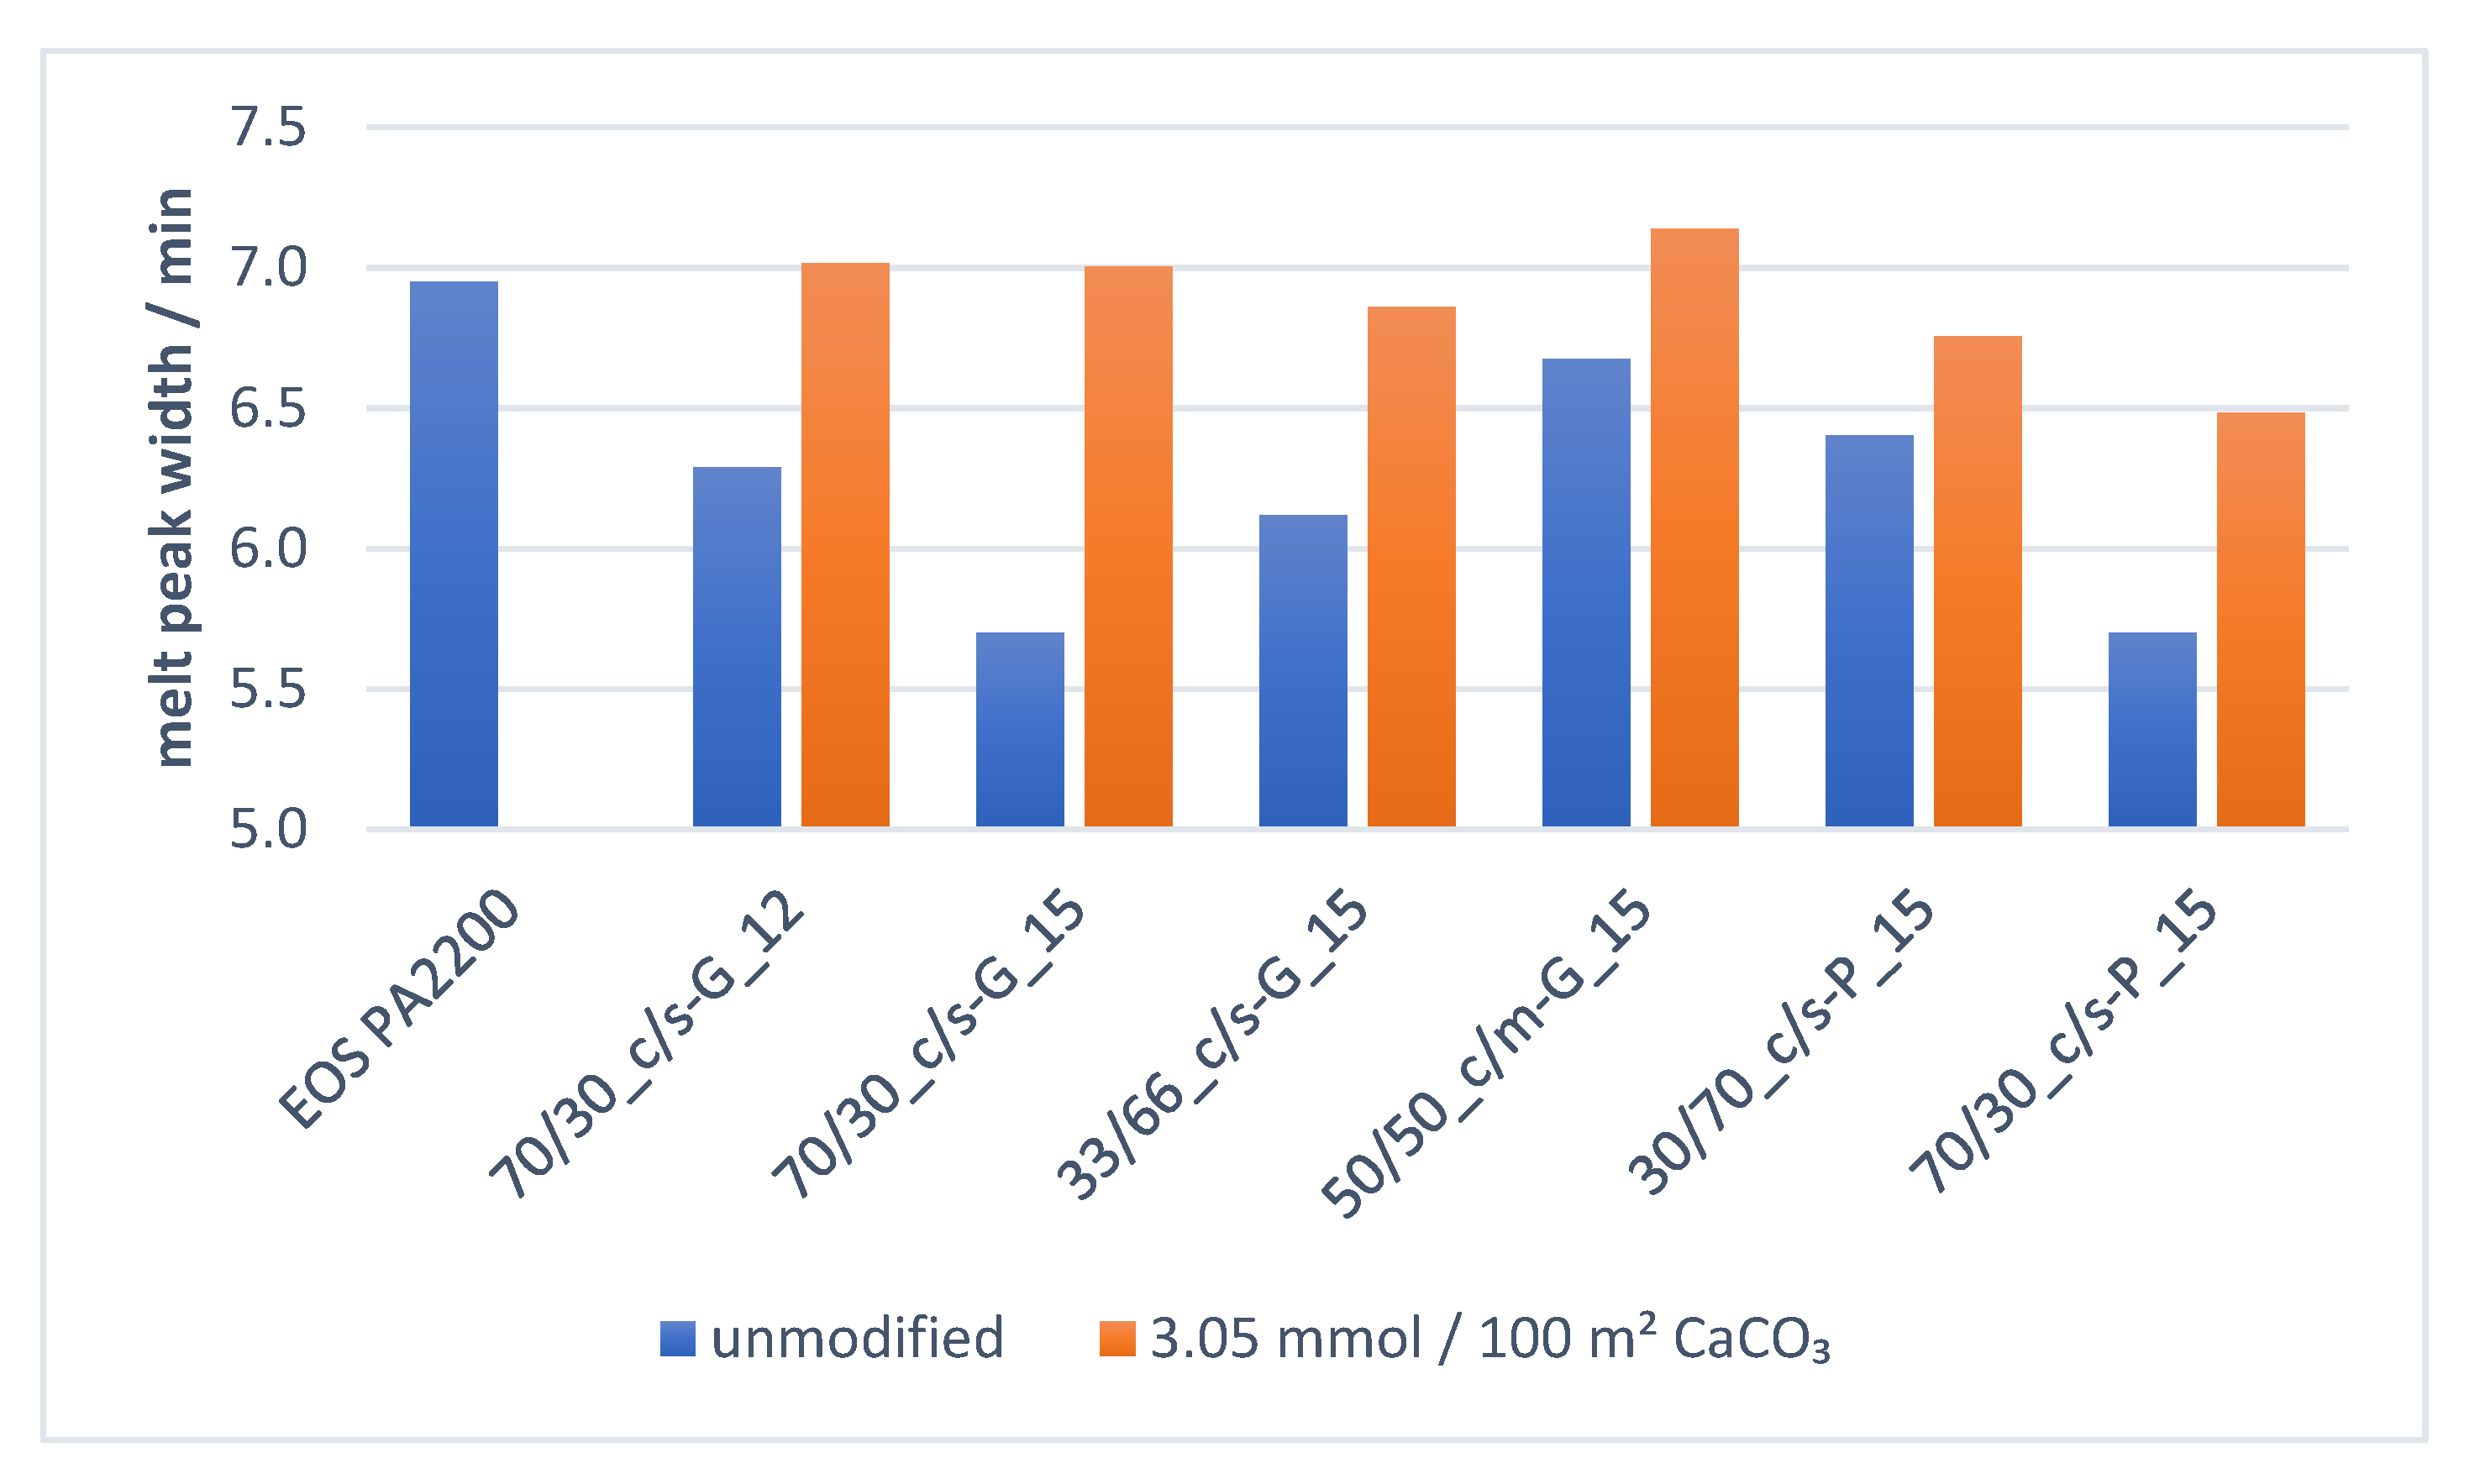
Figure 9 shows how the melt transition width is manipulated with the introduction of filler. The melt peak width is defined as the peak width of the total time over which the melt transition occurs. By implementing an optimized amount of coarse functional filler with a specific surface of ≤2 m2g−1, in combination with a fine filler fraction with a specific surface of ≤6 m2g−1, the melt transition process time can be reduced by up to 18%.
Comparing the reduction that the untreated GCC “50/50_c/m-G” had on the melt transition, with those of the untreated PCC “70/30_c/s-P,” it is clearly shown how the crystal structure of the fine functional filler and the steeper particle size distribution of the coarse filler particles play a significant role in the resulting melt properties. Even at the same weight-amount of filler and the same filler-area introduction of coarse and fine particles in the polymer matrix, the increased inner surface area and high amount of monosized coarse particles of the PCC “70/30_c/s-P” reduces the melting transition peak much more significantly than the ground calcium carbonate.
3.3.2. Effect of Surface Modifier Amount on Melt Properties
Figure 11 illustrates how the beneficial energy transition, due to higher thermal conductivity and lower specific heat of the calcium carbonate filler material, is significantly reduced if the functional filler is surface coated with 3.05 mmol amino hexanoic acid per 100 g polymer matrix. The high coverage of the calcium carbonate surface through the surface modification results in a significant reduction of the thermal property difference between filler and polymer. Consequently, the energy taken up by the filler material is not taken up as quickly and not released as rapidly to the polyamide 12 as when the filler was untreated. Due to the organic nature of the surface modifier, the thermal properties of the surface-modified functional filler behave more comparably to those of the pure polyamide 12. Figure 12 demonstrates how the improved melt transition width achieved with untreated filler can be slightly regained by reducing the surface modifier amount.
In previous investigations, the main driver for the improved melt transition is the action of the coarser filler particles, which, due to their greater single-particle volume, can transmit more thermal energy in comparison with a multitude of single fine filler particles [17]. Figure 12 also shows, how the increased melt transition rate can completely be regained if the coarse PCC particles are completely uncoated and can operate as such as an optimized energy transmitter. The difference in the particle size distribution between the two coarse filler materials “c-G” and “c-P,” is shown in the difference-comparison in the property regain when using untreated coarse filler, shown in Figure 12. While both have similar dv50, the difference in dv90 and specific surface area shows that the PCC-Filler has a much coarser-steeper (close to monosize) curve, with much less fine fraction. This confirms the beneficial role of the correct amount of uncoated coarse particles on the melting properties of the compound.
Figure 13 and Figure 14 show how the surface modification influences the melt flowability beneficially, by reducing the total loss in flow viscosity resulting otherwise from filler loading. A reduction of the surface modifier amount down to 2 mmol/100 m2 of filler material or the coating only applied to the fine filler particle fraction has no significant influence on this flowability response. This indicates that the reason for the improvement depends on the coated fine filler particles. This can additionally be confirmed if it is considered that the greatest reduction in “melt flowability loss” can be achieved with the surface-modified compounds “70/30_c/s-G.1_15,” “33/66_c/s-G.1_15,” and “30/70_c/s-P.1_15,” all of which had the higher fine filler fraction ratio. As it was already shown in previous investigations, the presence of fine filler particles within the compound supports the melt flowability. The contrary being seen for the same amount of coarse mineral filler [17,32]. The surface modifier on the fine filler fraction surface additionally improves this flowability of the mineral filler and the polymer matrix, by working as a lower molecular weight lubricant at the interface between them.
3.4. Crystallization Properties
3.4.1. Influence of Untreated Functional Filler Ratio/Morphology on Crystallization Properties
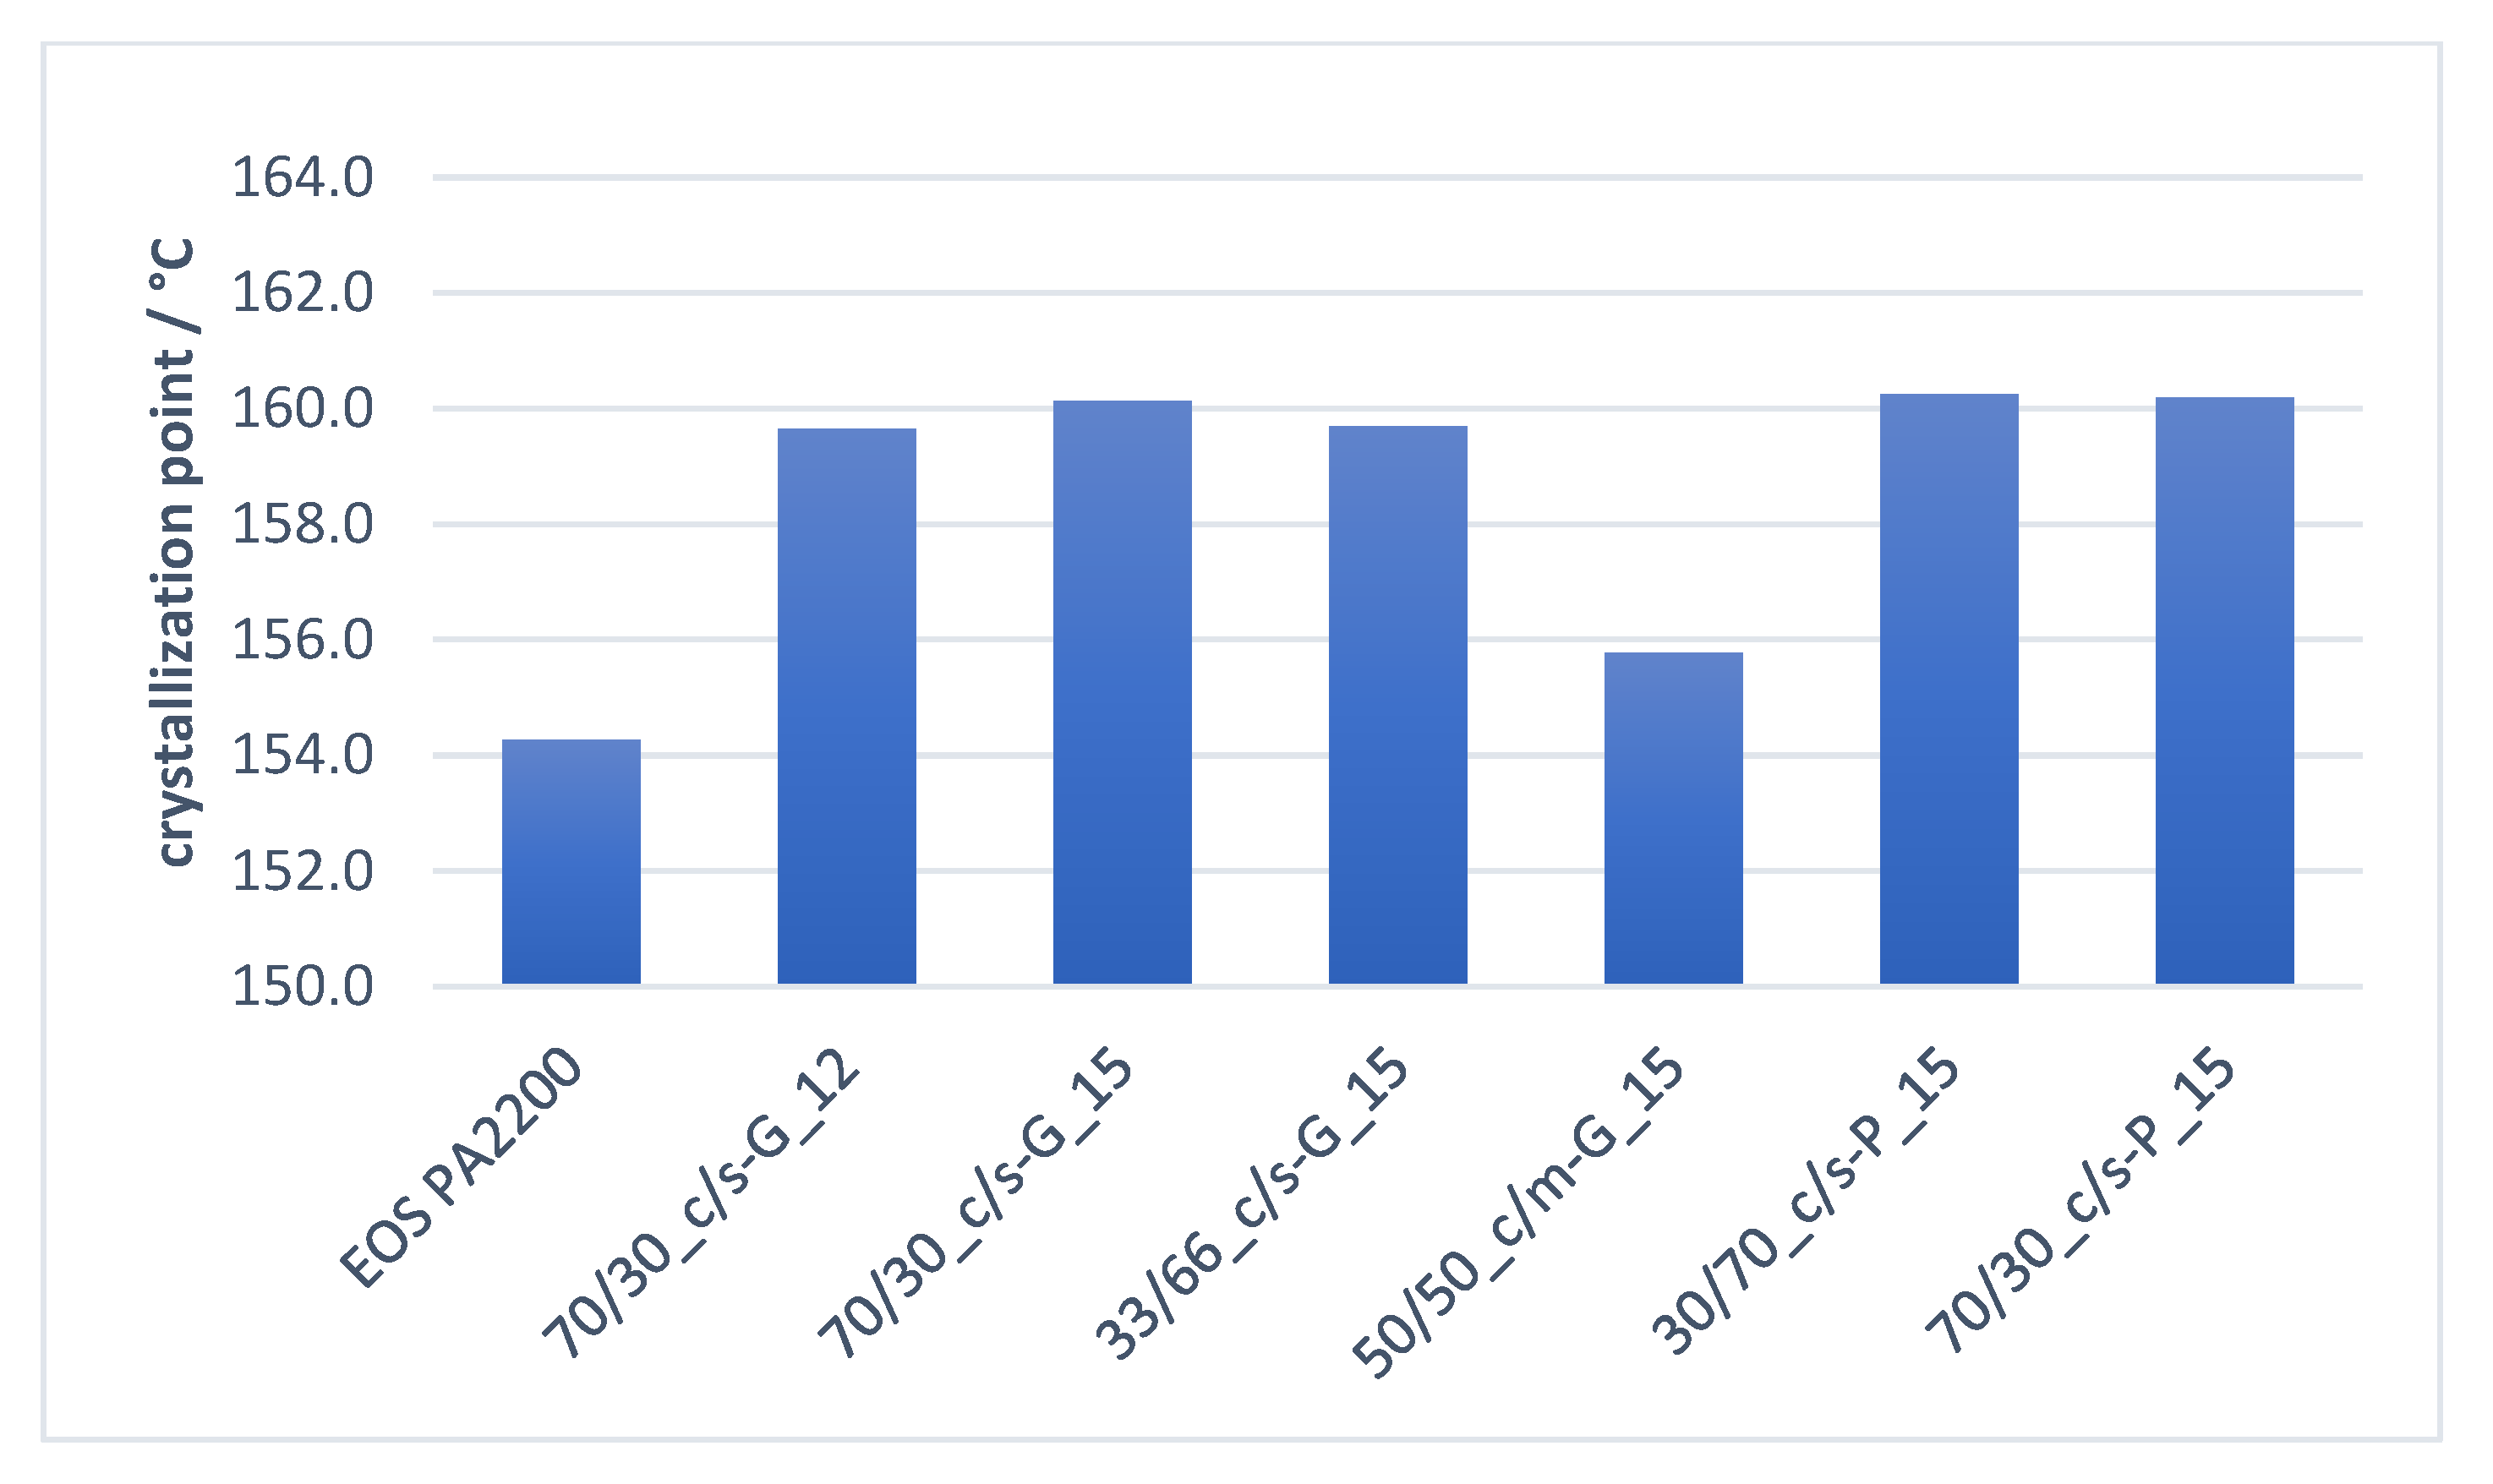
As described in our previous findings, a higher crystallization onset point can be achieved by adopting an optimized amount of fine calcium carbonate particles within the compound [17]. Figure 15 reveals how this effect is shown once again with all the tested untreated filler blends, independent of the morphology of the mineral filler used. Due to the lack of enough fine particles within the compound “50/50_c/m-G_15,” the increase of the crystallization onset point was not significant.
Figure 16 reflects the results seen in previous investigations. With the addition of an increased surface area of mineral filler in a polyamide 12 compound, the crystallization time at 172 °C can be significantly reduced. This reduction in the crystallization time at 172 °C shows no dependency on the ratio of the filler blend, nor the filler particle morphology. These findings support the already presented hypothesis that the crystallization onset point shows a strong dependence primarily on particle number, i.e., available nucleation points.
3.4.2. Effect of Surface Modifier Amount on Crystallization Properties
Even with increased amount surface modifier, the surface modification of the tested functional fillers showed no significant influence on the crystallization properties during the temperature reduction phase at 5 °C min−1. This is shown with the stable crystallization point behavior, Figure 17.
By conducting a more precise investigation of the crystallization kinetics, i.e., determination of the crystallization time at a constant temperature, in this case 172 °C, it is distinctly recognizable how once the free surface of the fine functional filler particles is coated with the surface modifier they lose a part of their nucleation-inducing properties. This results in a significant increase of the measured crystallization time toward that of the polymer alone. Figure 18 shows that the achieved reduction of the crystallization time by the addition of a GCC-based functional filler is from 85% down to 66%. The reduction of the surface modifier amount, or only a surface modification of the fine filler particles, leads to no regaining of this earlier achieved reduction with untreated material filler. These findings underline the statement that it is the high amount of finer particles that results in an increased amount of nucleation points, which enables the positive manipulation of the crystallization properties. However, by surface coating the fine filler fraction, the particles are effectively prevented from inducing nucleation within the crystallization process.
This hypothesis above is additionally confirmed by comparing the crystallization time of the GCC-based compounds versus the PCC-based compounds. The morphology of the fine precipitated calcium carbonate reveals a high amount of cigar/needle-like anisometric structure compared with the more isometric ground calcium carbonate particles. Even if surface coated, the PCC particles present a greater amount of nucleation points, which explains how the achieved crystallization time reduction is only reduced to 72% when coating the PCC filler, instead of the 66% for the GCC filler compounds. Additionally, the anisometric properties of the PCC are expected to lead to a greater patchwork of uncoated surface even after surface modification, which could also account, at least in part, for the less detrimental effect of coating on nucleation in the case of the PCC filler considered here.
3.5. Ductility
3.5.1. Influence of Untreated Functional Filler Ratio/Morphology on Ductility
Mineral filler additions act to stiffen filled polymer compounds. The ductility of the tested compound is significantly reduced. This effect is shown in Figure 19, by comparing the tensile elongation at break of pure polyamide 12 against the tested filled compounds. At a filler loading of 15 weight%, up to 70% of the elongation is lost.
Comparing the untreated GCC-based compound “50/50_c/m-G_15” with the comparable PCC-based compound “70/30_c/s-P_15,” shows that reducing an excess amount of ultrafine filler particles, the loss of ductility can be significantly reduced. The comparison of both untreated PCC-based compounds “30/70_c/s-P_15” and “70/30_c/s-P_15” shows the same trend. By reducing the fine filler fraction and increasing the coarse filler fraction, effectively by narrowing the particle size distribution and so having a low amount of fines, the loss of ductility can be reduced from 68% down to 30%.
3.5.2. Effect of Surface Modifier Amount on Ductility
Relating to the previous investigations, the surface modification of the mineral filler with amino hexanoic acid results in a re-gain of up to 60% of the lost ductility when implementing a solid mineral filler. This was explained through the presence of free amino groups that are coated on the filler particles. Through such a surface modification, hydrogen bonding can occur and, therefore, improve the adhesive strength between the filler and the polymer matrix [21]. Figure 20 presents how the elongation at break of the compound can be improved while suffering only a limited loss of ductility of only ~30%, independent of the filler blend used in the compound. Compound “70/30_c/s-P.1_15” shows how the surface modification of the optimized PCC filler fails to give an additional re-gain of the ductility. Figure 21 additionally shows how, by surface modifying the fine particle filler fraction only, the maximum optimization of 30% loss of ductility can be achieved for compound 70/30_c/s-G.3_15 as well.
The improvement reached through the optimized surface modification of a calcium carbonate filler, together with an optimized particle size ratio blend, is limited to a ductility loss of 30% arising from as high as a 15 weight% loading of solid mineral filler—a very significant finding.
4. Summary and Conclusions
In this study, calcium carbonate-polyamide 12 composites have been produced via twin-screw compounding using a range of designed calcium carbonate blends of different particle size and morphology filler materials together with an illustration of surface functionalization. The filler particle size distributions and filler ratio were combined in such a way as to optimize the thermal response of the compound, thus convincingly supporting the study hypothesis of improving a material preparate based on previously seen effects. The functional filler surface was here newly optimized for compounding with polyamide 12 by surface modification with amino hexanoic acid.
The combination of dually optimized functional filler particle size ratio and surface modification showed how the melting as well as crystallization behavior of polyamide 12 can be manipulated accordingly, while at the same time the typical loss of the mechanical properties on adding filler can be newly limited.
The connection between the thermally altered properties of the compound, derived using the methods described here, and the resulting mechanical properties can be readily linked in terms of the observed improvement in the rate of response to application of heat, particularly with respect to the onset point of crystallization and the time over which crystallization occurs during cooling.
Table 10 gives a brief overview of the discussed effects achieved with the different functional filler modifications.
The thermal and flowability properties of a polyamide 12 matrix can beneficially be manipulated with an introduction of a precise amount of coarse and fine calcium carbonate filler. The loss of the mechanical properties, caused by this introduction, can be partially re-gained by an optimized surface modification of the fine filler fraction with ~2–3 mmol amino hexanoic acid per 100 m2 filler.
By adapting the morphology of the fine functional filler and narrowing the size distribution of the coarse filler fraction, the overall performance can be enhanced additionally.
Out of the tested functional filler blends, “70/30_c/s-P.3” showed the most beneficial improvements in the overall performance. The precise amount of narrow coarse sized PCC-particles in combination with the increased inner surface area of the scalenohedral structured fine particles resulted in the lowest melt transition time, highest ductility, and minimized decrease in the melt flowability.
As in this study, not only the steepness of the particle size distribution was increased through the synthetical production of the mineral filler, but also the crystal structure, for future work each precipitated calcium carbonate morphology/crystal structure has to be studied independently. However, the effect of narrowing size distribution can be considered to a first approximation as an extrapolation of the findings from the previous bimodal studies where different ratios and particle size distribution of GCC were used. To determine an extreme case of difference, a narrow particle size, fine scalenohedral agglomerated calcite was chosen for this study.
These combined improvements found under twin-screw extrusion compounding of polyamide 12 demonstrate the possible usage of optimized calcium carbonate as a functional filler in additive manufacturing, which can potentially be transferred via a subsequent investigation into the selective laser-sintering process.
Author Contributions
Conceptualization, F.I., G.H., T.C. and P.G.; validation, G.H., T.C. and P.G.; investigation, F.I.; resources, F.I.; writing—original draft preparation, F.I.; writing—review and editing, G.H., T.C. and P.G.; visualization, F.I.; supervision, G.H., T.C. and P.G.; project administration, F.I. All authors have read and agreed to the published version of the manuscript.
Funding
This research received no external funding.
Institutional Review Board Statement
Not applicable.
Informed Consent Statement
Not applicable.
Acknowledgments
The authors gratefully acknowledge the support and Omya International AG for the financial support as well as providing filler raw material and experimental laboratory facilities.
Conflicts of Interest
The authors declare no conflict of interest.
References
- Schmid, M. Laser Sintering with Plastics: Technology, Processes, and Materials; Carl Hanser Verlag GmbH Co. KG: Munich, Germany, 2018. [Google Scholar]
- Mueller, B. Additive manufacturing technologies–rapid prototyping to direct digital manufacturing. Assem. Autom. 2012, 32. [Google Scholar] [CrossRef]
- Hague, R.; Mansour, S.; Saleh, N. Design opportunities with rapid manufacturing. Assem. Autom. 2003, 23, 346–356. [Google Scholar] [CrossRef]
- Gibson, I.; Rosen, D.; Stucker, B. Additive Manufacturing Technologies: 3D Printing, Rapid Prototyping, and Direct Digital Manufacturing; Springer: New York, NY, USA, 2014. [Google Scholar]
- Kumar, S. Selective Laser Sintering/Melting. In Comprehensive Materials Processing; Hashmi, S., Batalha, G.F., Van Tyne, C.J., Yilbas, B., Eds.; Elsevier: Oxford, UK, 2014; pp. 93–134. [Google Scholar]
- Liu-Lan, L.; Yu-Sheng, S.; Fan-di, Z.; Shu-huai, H. Microstructure of selective laser sintered polyamide. J. Wuhan Univ. Technol. Mater. Sci. Ed. 2003, 18, 60–63. [Google Scholar] [CrossRef]
- Childs, T.; Berzins, M.; Ryder, G.; Tontowi, A. Selective laser sintering of an amorphous polymer—simulations and experiments. Proc. Inst. Mech. Eng. Part. B J. Eng. Manuf. 1999, 213, 333–349. [Google Scholar] [CrossRef]
- Schmidt, M.; Pohle, D.; Rechtenwald, T. Selective laser sintering of PEEK. CIRP Ann. 2007, 56, 205–208. [Google Scholar] [CrossRef]
- Koo, J.; Lao, S.; Ho, W.; Ngyuen, K.; Cheng, J.; Pilato, L.; Wissler, G.; Ervin, M. Polyamide nanocomposites for selective laser sintering. In Proceedings of International Solid Freeform Fabrication Symposium; University of Texas Libraries: Austin, TX, USA, 2006; pp. 392–409. [Google Scholar]
- Schmid, M.; Amado, A.; Wegener, K. Polymer Powders for Selective Laser Sintering (SLS); ETH-Zürich: Zürich, Switzerland, 2014. [Google Scholar]
- Kim, J.; Creasy, T. Selective laser sintering characteristics of nylon 6/clay-reinforced nanocomposite. Polym. Test. 2004, 23, 629–636. [Google Scholar] [CrossRef]
- Goodridge, R.; Tuck, C.; Hague, R. Laser sintering of polyamides and other polymers. Prog. Mater. Sci. 2012, 57, 229–267. [Google Scholar] [CrossRef]
- Guo, Y.; Jiang, K.; Bourell, D.L. Preparation and laser sintering of limestone PA 12 composite. Polym. Test. 2014, 37, 210–215. [Google Scholar] [CrossRef]
- Sreenivasan, R.; Goel, A.; Bourell, D.L. Sustainability issues in laser-based additive manufacturing. Phys. Procedia 2010, 5, 81–90. [Google Scholar] [CrossRef] [Green Version]
- Ford, S.; Despeisse, M. Additive manufacturing and sustainability: An exploratory study of the advantages and challenges. J. Clean. Prod. 2016, 137, 1573–1587. [Google Scholar] [CrossRef]
- Le Bourhis, F.; Kerbrat, O.; Hascoet, J.-Y.; Mognol, P. Sustainable manufacturing: Evaluation and modeling of environmental impacts in additive manufacturing. Int. J. Adv. Manuf. Technol. 2013, 69, 1927–1939. [Google Scholar] [CrossRef] [Green Version]
- Ippolito, F.; Rentsch, S.; Hübner, G.; Claypole, T.; Gane, P. Influence of calcium carbonate on polyamide 12 regarding melting, formability and crystallization properties. Compos. Part. B Eng. 2019, 164, 158–167. [Google Scholar] [CrossRef] [Green Version]
- Gysau, D. Füllstoffe: Grundlagen und Anwendungen; Vincentz Network GmbH & Co. KG: Hannover, Germany, 2006. [Google Scholar]
- Shi, X.; Rosa, R.; Lazzeri, A. On the coating of precipitated calcium carbonate with stearic acid in aqueous medium. Langmuir 2010, 26, 8474–8482. [Google Scholar] [CrossRef]
- Goodman, H. Surface-Modified Fillers for Polymer Resins Compositions. Patent GB0321703A, 16 September 2003. [Google Scholar]
- Ippolito, F.; Hübner, G.; Claypole, T.; Gane, P. Influence of the Surface Modification of Calcium Carbonate on Polyamide 12 Composites. Polymers 2020, 12, 1295. [Google Scholar] [CrossRef] [PubMed]
- Azadi, M.; Ferdosi Heragh, M.; Bidi, M.A. Electrochemical Characterizations of Epoxy Coatings Embedded by Modified Calcium Carbonate Particles. Prog. Color. Colorants Coat. 2020, 13, 213–222. [Google Scholar]
- Chen, X.; Qian, X.; An, X. Using calcium carbonate whiskers as papermaking filler. BioResources 2011, 6, 2435–2447. [Google Scholar]
- Grönfors, J. Use of Fillers in Paper and Paperboard Grades. Ph.D. Thesis, Tampere University of Applied Sciences, Tampere, Finland, 2010. [Google Scholar]
- Katz, H.S.; Mileski, J.; Melewski, J.V. Handbook of Fillers for Plastics; Springer Science & Business Media: Berlin/Heidelberg, Germany, 1987. [Google Scholar]
- Ramadhani, A.; Herda, E.; Triaminingsih, S. The effect of brushing with toothpaste containing nano calcium carbonate upon nanofill composite resin surface roughness. In Proceedings of Journal of Physics: Conference Series; IOP Publishing: Bristol, UK, 2017; p. 012103. [Google Scholar]
- Thenepalli, T.; Jun, A.Y.; Han, C.; Ramakrishna, C.; Ahn, J.W. A strategy of precipitated calcium carbonate (CaCO3) fillers for enhancing the mechanical properties of polypropylene polymers. Korean J. Chem. Eng. 2015, 32, 1009–1022. [Google Scholar] [CrossRef]
- Stirnimann, T.; Di Maiuta, N.; Gerard, D.E.; Alles, R.; Huwyler, J.; Puchkov, M. Functionalized calcium carbonate as a novel pharmaceutical excipient for the preparation of orally dispersible tablets. Pharm. Res. 2013, 30, 1915–1925. [Google Scholar] [CrossRef]
- Xanthos, M. Functional Fillers for Plastics; John Wiley & Sons: Hoboken, NJ, USA, 2010. [Google Scholar]
- Bollström, R.; Gane, P. Spot Application of a Transparent Nanoclay Layer to Provide Post-print Laser Marking Functionality on High Brightness 100% Calcium Carbonate Coatings. Adv. Print. Media Technol. 2016, 43, 33. [Google Scholar]
- Erdogan, N.; Eken, H.A. Precipitated calcium carbonate production, synthesis and properties. Physicochem. Probl. Miner. Process. 2017, 53, 57–68. [Google Scholar]
- Ippolito, F.; Hübner, G.; Claypole, T.; Gane, P. Impact of Bimodal Particle Size Distribution Ratio of Functional Calcium Carbonate Filler on Thermal and Flowability Properties of Polyamide 12. Appl. Sci. 2021, 11, 641. [Google Scholar] [CrossRef]
- Kruth, J.-P.; Levy, G.; Schindel, R.; Craeghs, T.; Yasa, E. Consolidation of polymer powders by selective laser sintering. In Proceedings of the 3rd International Conference on Polymers and Moulds Innovations, Ghent, Belgium, 17–19 September 2008; pp. 15–30. [Google Scholar]
- Höhne, G.W.H.; Hemminger, W.; Flammersheim, H.-J. Theoretical fundamentals of differential scanning calorimeters. In Differential Scanning Calorimetry; Springer: Berlin/Heidelberg, Germany, 1996; pp. 21–40. [Google Scholar]
- Wunderlich, B. Thermal Analysis of Polymeric Materials; Springer Science & Business Media: Berlin/Heidelberg, Germany, 2005. [Google Scholar]
- Drummer, D.; Rietzel, D.; Kühnlein, F. Development of a characterization approach for the sintering behavior of new thermoplastics for selective laser sintering. Phys. Procedia 2010, 5, 533–542. [Google Scholar] [CrossRef] [Green Version]
- Koutsoukos, P.G.; Kontoyannis, C.G. Precipitation of calcium carbonate in aqueous solutions. J. Chem. Soc. Faraday Trans. Phys. Chem. Condens. Phases 1984, 80, 1181–1192. [Google Scholar] [CrossRef]
- Da Silva, A.; Rocha, M.; Moraes, M.; Valente, C.; Coutinho, F. Mechanical and rheological properties of composites based on polyolefin and mineral additives. Polym. Test. 2002, 21, 57–60. [Google Scholar] [CrossRef]
Figure 1.
Molecular structure of 6-amino hexanoic acid.

Figure 2.
Particle size distribution of developed GCC fillers.

Figure 3.
Particle size distribution of developed PCC fillers.

Figure 4.
Schematic temperature program used in differential scanning calorimetry measurements for melting and crystallization behavior.
Figure 4.
Schematic temperature program used in differential scanning calorimetry measurements for melting and crystallization behavior.

Figure 5.
Visual example for evaluated DSC curve—DSC curve of EOS PA 2200.

Figure 6.
Schematic temperature program used in differential scanning calorimetry measurements for crystallization time behavior.
Figure 6.
Schematic temperature program used in differential scanning calorimetry measurements for crystallization time behavior.

Figure 7.
SEM pictures of the main five untreated functional fillers “Filler c-G” through “Filler s-P,” before blending.
Figure 7.
SEM pictures of the main five untreated functional fillers “Filler c-G” through “Filler s-P,” before blending.


Figure 8.
SEM images confirm the homogeneity of the filler distribution within the PA-CaCO3 composites.
Figure 8.
SEM images confirm the homogeneity of the filler distribution within the PA-CaCO3 composites.


Figure 9.
Melt properties—influence of the different untreated functional filler blends on the melt peak width at 5 °C min−1.
Figure 9.
Melt properties—influence of the different untreated functional filler blends on the melt peak width at 5 °C min−1.

Figure 10.
Melt properties—influence of the different untreated functional filler blends on the melt flow viscosity at 190 °C, 2.16 kg.
Figure 10.
Melt properties—influence of the different untreated functional filler blends on the melt flow viscosity at 190 °C, 2.16 kg.

Figure 11.
Melt properties—influence of the filler modification on the melt peak width at 5 °C min−1.
Figure 11.
Melt properties—influence of the filler modification on the melt peak width at 5 °C min−1.

Figure 12.
Melt properties—effect of the variation of surface modifier amount on the melt peak width at 5 °C min−1.
Figure 12.
Melt properties—effect of the variation of surface modifier amount on the melt peak width at 5 °C min−1.

Figure 13.
Melt properties—influence of the filler modification on the melt flow viscosity at 190 °C, 2.16 kgf.
Figure 13.
Melt properties—influence of the filler modification on the melt flow viscosity at 190 °C, 2.16 kgf.

Figure 14.
Melt properties—effect of the variation of surface modifier amount on the melt flow viscosity at 190 °C, 2.16 kgf.
Figure 14.
Melt properties—effect of the variation of surface modifier amount on the melt flow viscosity at 190 °C, 2.16 kgf.

Figure 15.
Crystallization properties—influence of the different untreated functional filler blends on the crystallization point at 5 °C min−1.
Figure 15.
Crystallization properties—influence of the different untreated functional filler blends on the crystallization point at 5 °C min−1.

Figure 16.
Crystallization properties—influence of the different untreated functional filler blends on the crystallization time at 172 °C.
Figure 16.
Crystallization properties—influence of the different untreated functional filler blends on the crystallization time at 172 °C.

Figure 17.
Crystallization properties—influence of the filler modification on the crystallization point at 5 °C min−1.
Figure 17.
Crystallization properties—influence of the filler modification on the crystallization point at 5 °C min−1.

Figure 18.
Crystallization properties—effect of the variation of surface modifier amount on the crystallization time at 172 °C.
Figure 18.
Crystallization properties—effect of the variation of surface modifier amount on the crystallization time at 172 °C.

Figure 19.
Mechanical properties—influence of the different untreated functional filler blends on the elongation at break.
Figure 19.
Mechanical properties—influence of the different untreated functional filler blends on the elongation at break.

Figure 20.
Mechanical properties—influence of the filler modification on the elongation at break.

Figure 21.
Mechanical properties—effect of the variation of surface modifier amount on the elongation at break.
Figure 21.
Mechanical properties—effect of the variation of surface modifier amount on the elongation at break.


Table 1.
Physical properties of calcium carbonate at different crystal structure and morphology.
| Properties | PCC Calcite | PCC Aragonite | GCC | |
|---|---|---|---|---|
| Rhombohedral | Scalenohedral | Fine Ground | ||
| Solubility product (Ksp) | 3.36 × 10⁻⁹ | 6.00 × 10⁻⁹ | ||
| Density (g cm−3) | 2.71 | 2.93 | ||
| Hardness (Mohs scale) | 3.0 | 3.0 | 3.5–4.0 | 3.0 |
| Refractive index | 1.58 | 1.58 | 1.63 | 1.58 |
| Coordination number | 6 | 9 | ||
| Specific gravity | 2.71 | 2.71 | 2.92 | 2.71 |
| TAPPI brightness * /% | 99 | 99 | 99 | 95 |
* TAPPI T452 (ISO) [22].
Table 2.
Material specification.
| Omyacarb 10-AV | EOS PA2200 | |
|---|---|---|
| producer/supplier | Omya International AG | EOS e-Manufacturing |
| volume-based median particle size, dv50 | 9 μm | 60 μm |
| particle shape | irregular | spherical |
| approx. thermal conductivity at 298 K | 1.3 Wm⁻1 K⁻1 | 0.2 Wm⁻1 K⁻1 |
| approx. specific heat | 0.8 kJkg⁻1 K⁻1 | 1.2 kJkg⁻1 K⁻1 |
Table 3.
Material specification of the surface modification agent.
| Amino Hexanoic Acid | |
|---|---|
| producer/supplier | Sigma Aldrich |
| CAS Number | 60-32-2 |
| Linear Formula | C6H12NO2 |
| Molecular weight | 131.17 g mol⁻1 |
Table 4.
Single component pigment data.
| Filler Nomenclature | Filler Type | dv10 /μm | dv50 /μm | dv90 /μm | SSA /m2g−1 |
|---|---|---|---|---|---|
| c-G | coarse sized GCC | 1.0 | 4.9 | 14.8 | 1.8 |
| m-G | medium sized GCC | 0.8 | 2.1 | 5.3 | 3.7 |
| s-G | small sized GCC | 0.5 | 1.1 | 2.7 | 7.7 |
| c-P | coarse sized PCC | 1.0 | 5.0 | 9.1 | 1.3 |
| s-P | small sized PCC | 0.5 | 2.1 | 3.7 | 6.4 |
Table 5.
Resulting pigment data after filler mixing.
| Mixed Filler Nomenclature | Single Components | Mix Proportions | Specific Surface Area /m2g−1 | ||
|---|---|---|---|---|---|
| Coarse Filler | Fine Filler | Amount Coarse Filler /w/w% | Amount Fine Filler /w/w% | ||
| 70/30_c/s-G | c-G | s-G | 70 | 30 | 3.6 |
| 33/66_c/s-G | c-G | s-G | 33 | 66 | 5.7 |
| 50/50_c/m-G | c-G | m-G | 50 | 50 | 2.7 |
| 30/70_c/s-P | c-P | s-P | 30 | 70 | 4.9 |
| 70/30_c/s-P | c-P | s-P | 70 | 30 | 2.8 |
Table 6.
Resulting single component functional filler data after drying step—maximal treatment amount: series 1.
Table 6.
Resulting single component functional filler data after drying step—maximal treatment amount: series 1.
| Treated Filler Nomenclature | Modifier Surface Concentration /mmol Per 100 m2 Filler | Modifier Amount /% by Weight |
|---|---|---|
| c-G.1 | 3.05 | 0.7 |
| m-G.1 | 3.05 | 1.5 |
| s-G.1 | 3.05 | 3.1 |
| c-P.1 | 3.05 | 0.5 |
| s-P.1 | 3.05 | 2.6 |
Table 7.
Resulting single component functional filler data after drying step—reduced modifier amount: series 2.
Table 7.
Resulting single component functional filler data after drying step—reduced modifier amount: series 2.
| Treated Filler Nomenclature | Modifier Surface Concentration /mmol Per 100 m2 Filler | Modifier Amount /% by Weight |
|---|---|---|
| c-G.2 | 2.3 | 0.5 |
| s-G.2 | 2.3 | 2.3 |
| c-P.2 | 2.3 | 0.4 |
| s-P.2 | 2.3 | 1.9 |
Table 8.
Resulting pigment data after filler mixing—blends arising comparing series 2 and series 3.
| Filler Nomenclature | Coarse Filler | Fine Filler | Amount Coarse Filler /w/w% | Amount Fine Filler /w/w% | Amount Untreated Coarse Filler /w/w% |
|---|---|---|---|---|---|
| 70/30_c/s-G.2 | c-G.2 | s-G.2 | 70 | 30 | 0 |
| 70/30_c/s-P.2 | c-P.2 | s-P.2 | 70 | 30 | 0 |
| 70/30_c/s-G.3 | c-G | s-G.2 | 0 | 30 | 70 |
| 70/30_c/s-P.3 | c-P | s-P.2 | 0 | 30 | 70 |
Table 9.
Tested filler loadings and introduced surface area of filler per given 100 g mass of polyamide 12.
Table 9.
Tested filler loadings and introduced surface area of filler per given 100 g mass of polyamide 12.
| Compound Nomenclature | Filler Used | Filler Amount /w/w% | Total Carbonate Surface Per 100 g Polyamide 12 /m2 | Coarse Filler Surface Per 100 g Polyamide 12 /m2 | Fine Filler Surface Per 100 g Polyamide 12 /m2 |
|---|---|---|---|---|---|
| 70/30_c/s-G_12 | 70/30_c/s-G | 12 | 49 | 17 | 32 |
| 70/30_c/s-G_15 | 70/30_c/s-G | 15 | 63 | 22 | 41 |
| 33/66_c/s-G_15 | 33/66_c/s-G | 15 | 101 | 11 | 90 |
| 50/50_c/m-G_15 | 50/50_c/m-G | 15 | 48 | 16 | 32 |
| 30/70_c/s-P_15 | 30/70_c/s-P | 15 | 86 | 7 | 79 |
| 70/30_c/s-P_15 | 70/30_c/s-P | 15 | 50 | 16 | 34 |
| 70/30_c/s-G.1_12 | 70/30_c/s-G.1 | 12 | 49 | 17 | 32 |
| 70/30_c/s-G.1_15 | 70/30_c/s-G.1 | 15 | 63 | 22 | 41 |
| 33/66_c/s-G.1_15 | 33/66_c/s-G.1 | 15 | 101 | 11 | 90 |
| 50/50_c/m-G.1_15 | 50/50_c/m-G.1 | 15 | 48 | 16 | 32 |
| 30/70_c/s-P.1_15 | 30/70_c/s-P.1 | 15 | 86 | 7 | 79 |
| 70/30_c/s-P.1_15 | 70/30_c/s-P.1 | 15 | 50 | 16 | 34 |
| 70/30_c/s-G.2_12 | 70/30_c/s-G.2 | 12 | 49 | 17 | 32 |
| 70/30_c/s-G.2_15 | 70/30_c/s-G.2 | 15 | 63 | 22 | 41 |
| 70/30_c/s-P.2_15 | 70/30_c/s-P.2 | 15 | 50 | 16 | 34 |
| 70/30_c/s-G.3_12 | 70/30_c/s-G.3 | 12 | 49 | 17 | 32 |
| 70/30_c/s-G.3_15 | 70/30_c/s-G.3 | 15 | 63 | 22 | 41 |
| 70/30_c/s-P.3_15 | 70/30_c/s-P.3 | 15 | 50 | 16 | 34 |
Table 10.
Overview of all achieved property modifications.
| Uncoated GCC Blend | Surface Modification | Reduced Modification | Uncoated Coarse GCC | |
| Melt flowability | Reduced | Improved | Improved | Improved |
| Melt transition | Enhanced | Effect lost | Slight regain | Slight regain |
| Crystallization point | Increased | Increased | Increased | Increased |
| Crystallization time | 20% time needed | Regain of 150% | Regain of 150% | Regain of 150% |
| Ductility | 70% lost | 60% regain | 60% regain | 60% regain |
| Uncoated PCC blend | Modified PCC | Uncoated coarse PCC | ||
| Melt flowability | Reduced | Improved | Improved | |
| Melt transition | Enhanced | Slight regain | High regained | |
| Crystallization point | Increased | Increased | Increased | |
| Crystallization time | 20% time needed | Regain of 60% | Regain of 60% | |
| ductility | 30 % lost | no effect | no effect |
Publisher’s Note: MDPI stays neutral with regard to jurisdictional claims in published maps and institutional affiliations. |
© 2021 by the authors. Licensee MDPI, Basel, Switzerland. This article is an open access article distributed under the terms and conditions of the Creative Commons Attribution (CC BY) license (https://creativecommons.org/licenses/by/4.0/).
Share and Cite
MDPI and ACS Style
Ippolito, F.; Hübner, G.; Claypole, T.; Gane, P. Calcium Carbonate as Functional Filler in Polyamide 12-Manipulation of the Thermal and Mechanical Properties. Processes 2021, 9, 937. https://doi.org/10.3390/pr9060937
AMA Style
Ippolito F, Hübner G, Claypole T, Gane P. Calcium Carbonate as Functional Filler in Polyamide 12-Manipulation of the Thermal and Mechanical Properties. Processes. 2021; 9(6):937. https://doi.org/10.3390/pr9060937
Chicago/Turabian StyleIppolito, Fabio, Gunter Hübner, Tim Claypole, and Patrick Gane. 2021. "Calcium Carbonate as Functional Filler in Polyamide 12-Manipulation of the Thermal and Mechanical Properties" Processes 9, no. 6: 937. https://doi.org/10.3390/pr9060937
Note that from the first issue of 2016, this journal uses article numbers instead of page numbers. See further details here.