Article

Runoff Forecast for the Flood Season Based on Physical Factors and Their Effect Process and Its Application in the Second Songhua River Basin, China

1
Key Laboratory of Groundwater Resources and Environment, Ministry of Education, Jilin University, Jiefang Street No. 2519, Changchun 130021, China
2
Department of Civil Engineering, Swansea University Bay Campus, Swansea SA1 8EN, UK
3
Hydrological and Water Resources Administration of Jilin Province, Changchun 130028, China
*
Author to whom correspondence should be addressed.
Sustainability 2022, 14(17), 10627; https://doi.org/10.3390/su141710627
Submission received: 13 December 2021 / Revised: 1 March 2022 / Accepted: 7 March 2022 / Published: 26 August 2022

Abstract

:
The Second Songhua River Basin is located at the northern edge of the East Asian monsoon region in China. The river basin has a large interannual rainfall-runoff variation often associated with frequent droughts and floods. Therefore, the mid-long-term runoff prediction is of great significance. According to a review of the national and international literature, there are few studies on sunspots in the prediction of medium- and long-term runoff. In this study, sunspots are selected as the influencing factors of runoff based on the mechanism of astronomical factors; sensitivity analysis was used to identify the time delay of sunspots’ influence on runoff and determine the prediction factor (relative number of sunspots in January and March). The BP (backpropagation) network is used to identify the correlation between prediction factors and prediction items (monthly average inflow rate of the Fengman Reservoir and the Baishan Reservoir in the flood season), and then the prediction model is constructed. According to the test results of historical data and the actual forecast results, the forecast is working well, and the accuracy of qualitative forecasting is high.

1. Introduction

Regional hydrological processes are a natural geographical phenomenon that is influenced by geographical factors such as the dimension, altitude, topography, landform and the relative position of sea and land, and other regional characteristics. It can only be forecasted based on identifying and understanding its influencing factors, characteristics, and laws [1]. The regional hydrological cycle is an open and complex giant system, governed by the interaction of weather systems and underlying surface conditions [2].
Solar radiation is the primary source of energy on Earth. The amount of solar energy received by the Earth is usually referred to as the total solar irradiance (TSI). TSI is affected by solar activities such as sunspots, spots, flares, spectral spots, prominence, and coronal mass ejection. Changes in both TSI and solar activity can have direct and indirect effects on the Earth’s climate, which in turn can cause fluctuations in regional climate [3]. Sunspots are one of the most basic and visible solar activity phenomena, reflecting the intensity of solar activity. They are also the most easily observed among all solar activity phenomena. Therefore, solar cycle lengths (SCL) and sunspot numbers (SSN) are used to describe the change of solar activity [4]. A study of nearly 300 years of observed data shows that the sunspot activity has periods of 11a, 22a, and 180a quasi-periodicity [5], which are in turn closely related to changes in climate and hydrology. The cyclical variation of solar activity can cause many natural disasters, especially during the peak and trough of sunspot activity, which is the period of the outbreak of many natural disasters [6]. For example, Clayton [7] mapped the annual rainfall distribution of the global solar activity peaks and valleys, with China being in the peak year rainfall region; Van Loon and Lee’s [8,9] study of sunspots and circulation shows that the Hadley circulation increases when the sunspot number is high; Scafetta [10] argued that global warming in recent years has been strongly related to solar activity, with cyclical variations in solar activity contributing at least 60% of the impact factor to global warming; Verschuren et al. [11] studied the relationship between precipitation and solar activity in East Africa, their results show that precipitation is less when solar radiation is intense and more when solar radiation is weak; Zhu [12] conducted extensive research on the relationship between climate and solar activity and concluded that the rainfall in China’s Yangtze River Basin is positively proportional to the number of sunspots, while rainfall in the Yellow River basin is inversely proportional to the number of sunspots. In summary, there is a certain cyclical relationship between solar activity and climate change, so the relationship between basin floods and solar indicators can be established based on solar activity indicators. The occurrence pattern of floods in the basin can be found in the annual variability of solar indicators.
For the change of river runoff caused by climate and meteorological anomalies, the direct cause is the continuous anomalous of atmospheric circulation. The energy sources of atmospheric and oceanic circulation are derived from solar radiation. The uneven distribution of solar radiation in the high and low latitudes of the Earth causes atmospheric and oceanic circulation. Therefore, solar activities and the Earth’s magnetic field interference caused by solar activities may cause meteorological anomalies, thus affecting the change of river runoff [13,14]. Long-term changes in the Earth’s climate and river runoff are influenced by a variety of factors, among which solar radiation is the source of energy for the climate system and the fundamental driver of the formation of all physical processes and phenomena in the atmosphere, as well as a fundamental factor in climate change and changes in river runoff [15]. Solar activity, on the other hand, directly governs changes in solar radiation, so it is of theoretical and practical significance to explore the relationship between solar activity and changes in river basin runoff.
From the runoff formation mechanism, the climate characteristics of the basin are mainly affected by solar activity, atmospheric circulation, and the natural geographical environment. These three factors have several mechanisms: solar radiation is an astronomical factor outside the hydrological cycle, and its impact on climate is cyclical; the atmospheric circulation is the dominant factor of climate situation and has seasonal variation; the natural geographical environment, as the underlying surface condition, exerts an influence on the climate and also has seasonal variation. At the same time, each influencing factor is through the influence of atmospheric circulation to achieve their respective roles, that is, atmospheric circulation provides basic conditions for different scales of weather system activities, showing random laws; the natural geographical characteristics of the basin have consistent rules of action on atmospheric circulation, reflecting the particularity and consistency of basin response [16]. Therefore, the hydroclimate of the basin is a coupled superposition of periodic and stochastic patterns, showing regularity on long time scales and stochasticity on short time scales. Studies have shown that there is a probable periodic pattern in the years of major droughts and floods in the basin runoff anomalies, e.g., the Second Songhua River has a 10-year probable periodicity for major droughts and floods with a 1-year error before and after [17].
In summary, there are direct and indirect links between the cyclical nature of the solar activity and atmospheric circulation and climate change, which further influence changes in hydrological conditions. However, few studies have established mapping relationships based on the time lag of their effects. Therefore, this paper uses a global sensitivity analysis method to identify the time lag of sunspot influence on the flood runoff in the basin, using the relative number of sunspots as a physical influence and then determining the critical influence factors. A BP (backpropagation) neural network algorithm is used to recognize the complex non-linear relationships between the forecast factors and the forecast items, and to determine the correlation between sunspot relative number and runoff, enabling medium- and long-term runoff prediction.

2. Materials and Methods

2.1. Study Area

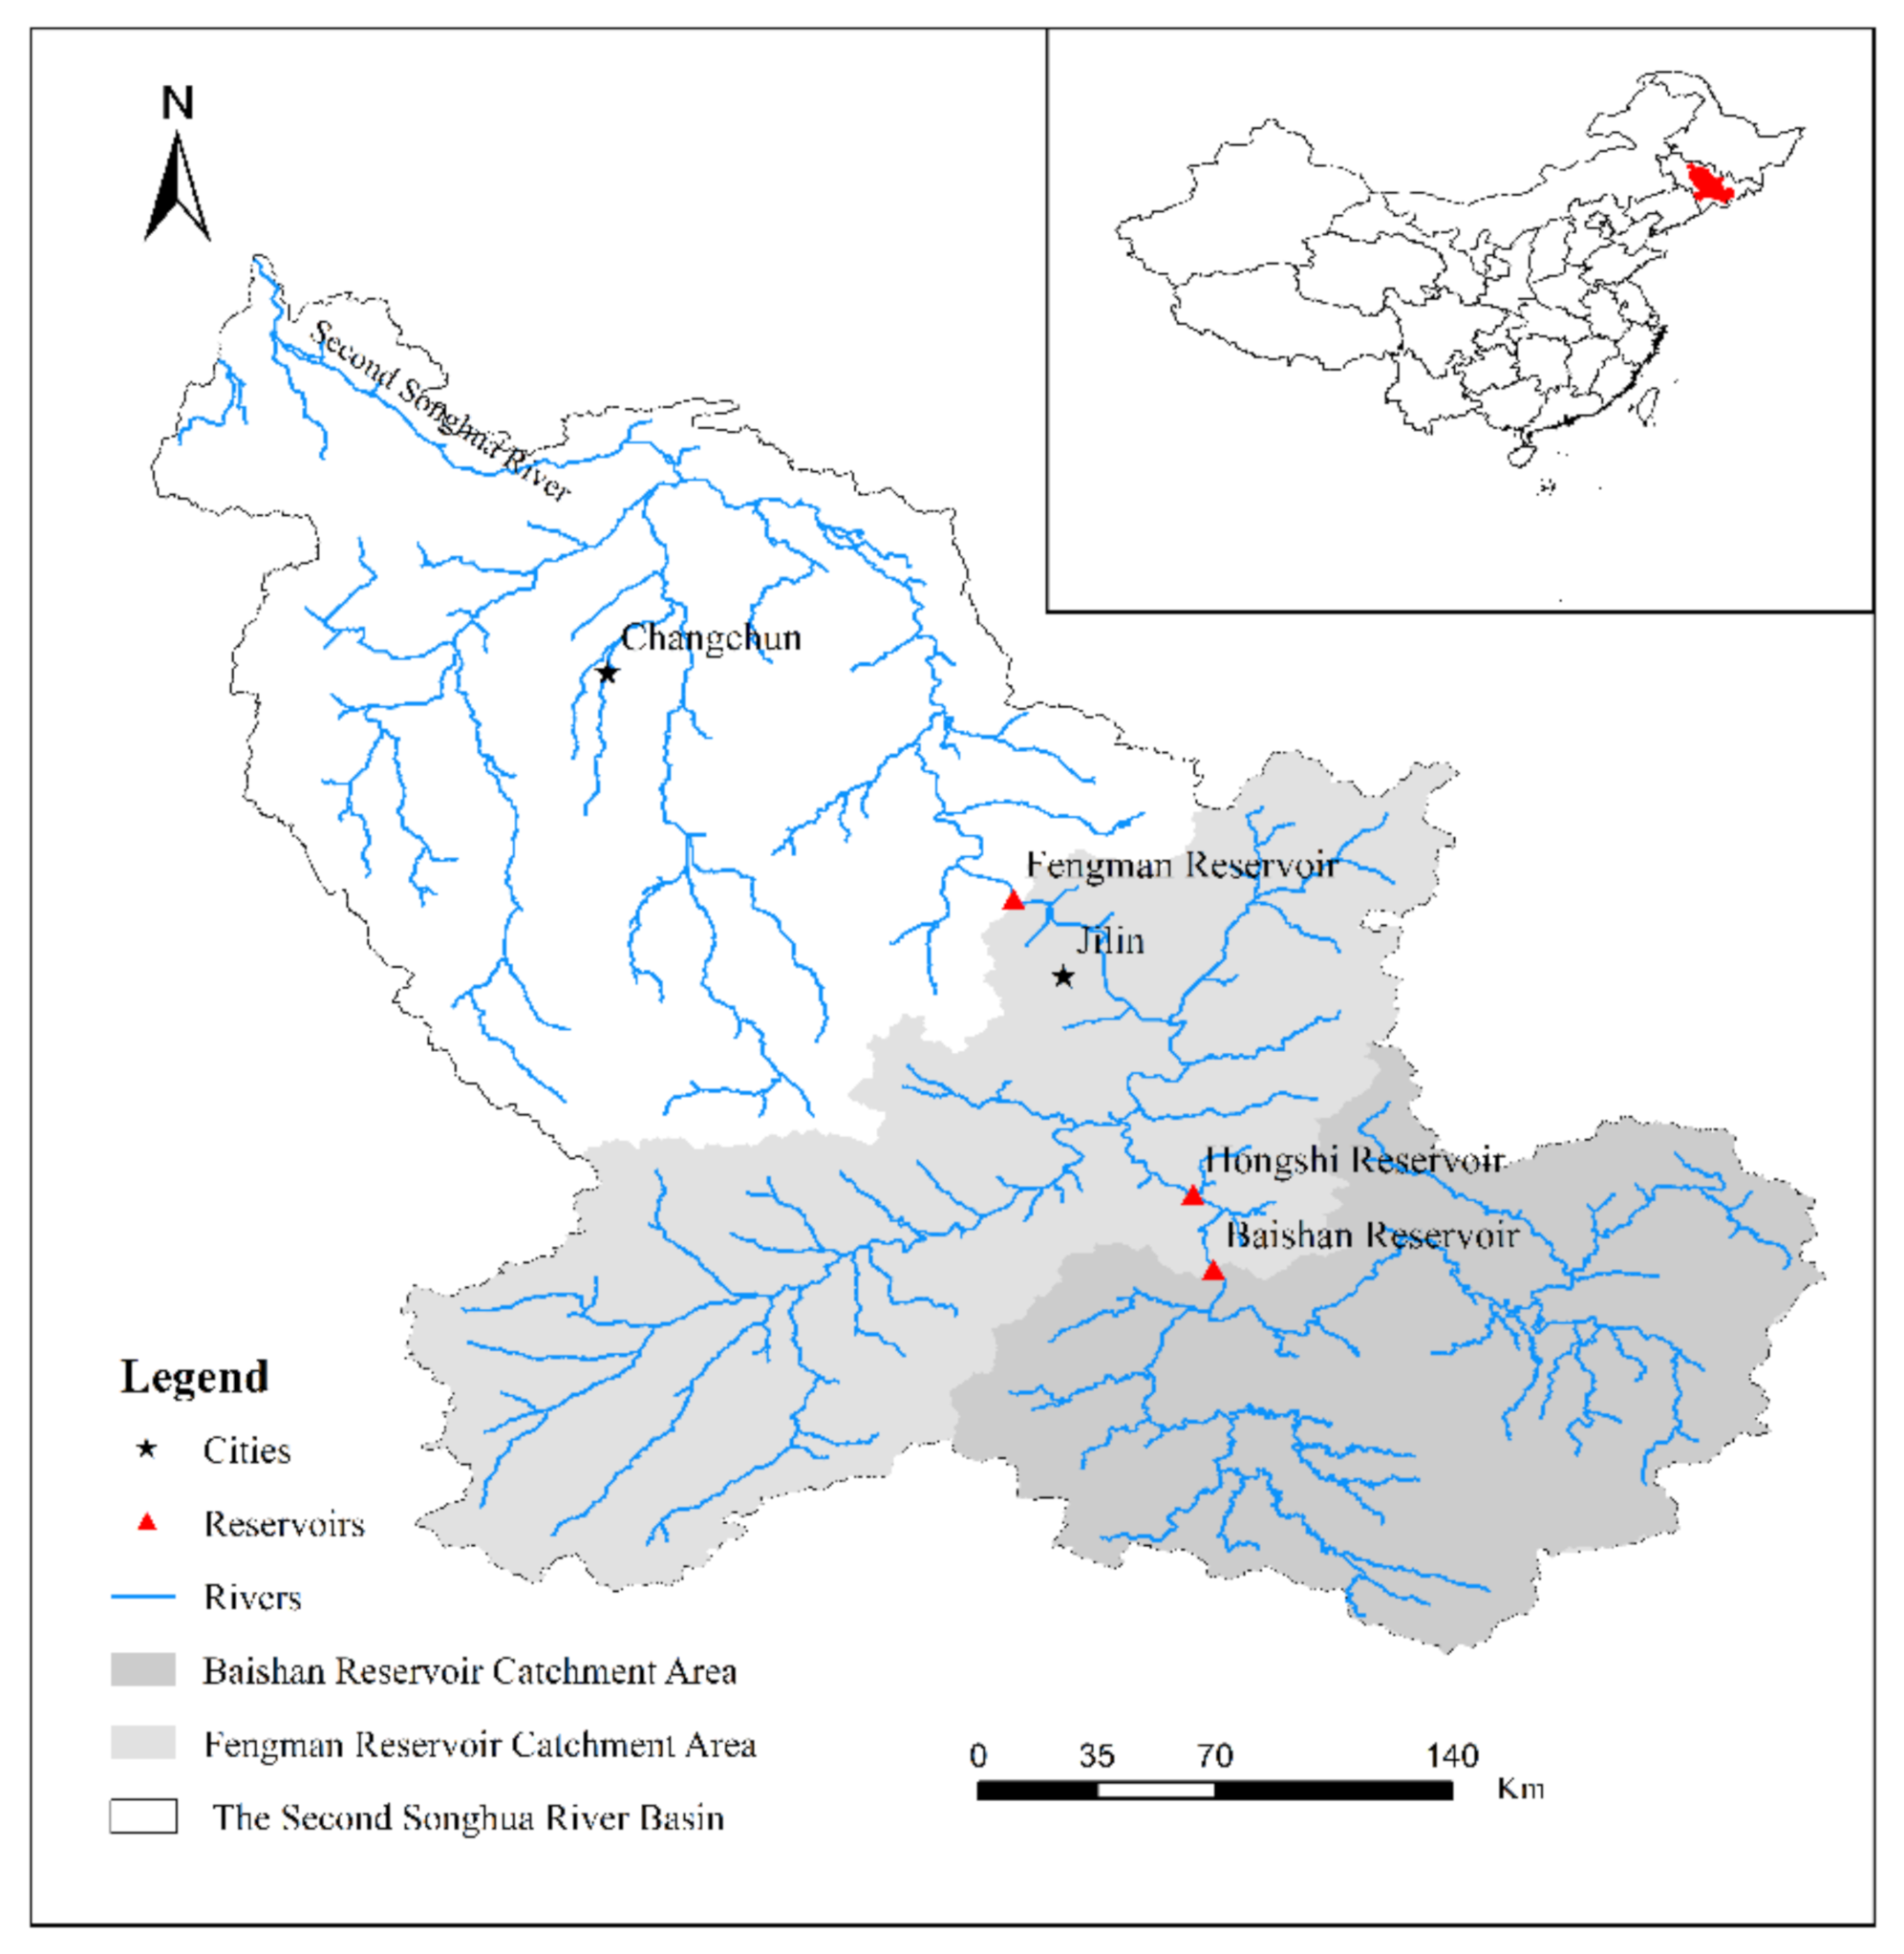
The forecasting object was the monthly average inflow in the Baishan and Fengman Reservoirs of the Second Songhua River mainstream during the flood season (June–September). The watershed system, reservoir site, and catchment area in the Second Songhua River are shown in Figure 1.
The Second Songhua River originates from Tianchi of Mount Paektu in the highest peak of the Changbai Mountains in Northeast China, and the drainage area is 7.34 × 10⁴ km2. The basin has a temperate monsoon climate, controlled by the Pacific monsoon in summer and the Siberian high pressure in winter. It is humid and rainy in summer, but cold and dry in winter. The annual rainfall in the basin ranges from 500 to 1080 mm, decreasing from the upper mountains to the lower reaches, and its spatial distribution is very uneven. Rainfall is also unevenly distributed in time. From an annual perspective, the average annual rainfall is about 735 mm, with an annual minimum of 495 mm and an annual maximum of 1078 mm. In the year, the rainfall is concentrated between June and September, with 60–90% of the annual rainfall, with a monthly maximum of 358 mm. As a result, the interannual distribution of runoff is also highly uneven, with a multi-year average flow of 409 m3/s, a maximum annual average flow of 765 m3/s, and a minimum annual average flow of 164 m3/s. There are 2–6 floods per year, and a process of flood generally lasts for 7–10 days, the maximum peak flow is 20,700 m3/s. The flow in winter glaciation is minimal, less than 10 m3/s. In the hydrology record of more than 70 years, the alternation between high- and low-flow years is also very uneven with low flow for eight consecutive years and high flow for six. In general, low flow occurs constantly for several years after continuous high flow for 2–3 years.

2.2. Data Sources

The long time series data of sunspot relative number are obtained from the Space Environment Prediction Center (http://www.sepc.ac.cn/, accessed on 20 August 2021) of the National Space Science Center of the Chinese Academy of Sciences. The Space Environment Prediction Center is a scientific research unit specialized in space environment research, providing space environment prediction and effect service. It is the main executing agency of the Space Environment Research and Prediction Center of the Chinese Academy of Sciences and a member of the International Space Environment Service (ISES). The monthly runoff data of the Fengman Reservoir and the Baishan Reservoir from 1956 to 2018 are provided by Jilin Hydrology and Water Resources Bureau (Jilin Water Environment Monitoring Center), which is the measured runoff data of the Baishan Reservoir and the Fengman Reservoir.

2.3. Methodology

This paper mainly adopts a global sensitivity analysis method based on the coupled action of multiple factors of BP neural network to carry out the time lag identification of the action of physical factors and determine the key influence factors; a BP neural network algorithm with genetic algorithm to optimize the initial weights is used to establish a complex non-linear mapping relationship between key factors and historical runoff and to realize the forecast of target projects.
(1)
Global sensitivity (GS) analysis method based on BP neural network with multi-factor coupling
In global sensitivity analysis, the analysis of the mechanism of action of the independent variable on the dependent variable is crucial and can be described abstractly using mathematical expressions or physical models as long as the mechanism of action is clear. In most practical problems, however, there are too many independent variables and inconsistencies in the degree of action of each variable on the dependent variable, resulting in unclear mapping relationships between the independent and dependent variables. Therefore, the sensitivity analysis of independent variables is the premise and foundation of mapping the relationship between independent variables and dependent variables. Typical sensitivity analysis methods are mostly based on mathematical statistics, based on multiple regression models mapping the relationship between the independent and dependent variables, which has the limitation of linearizing the non-linear problem. When the problem under study has many influencing factors and the mechanism of action is complex, it is difficult to obtain reasonable sensitivity analysis results with a mapping relationship model based on linear regression.
In this study, the global sensitivity analysis method based on a BP neural network is used to study the influence of the common changes of each variable on the dependent variable. Considering the interaction among the variables, the zero-return disturbance of the independent variable is introduced to deduce the degree of change of the dependent variable. Thus, the sensitivity of dependent variables to independent variables is defined, and the global sensitivity analysis based on the multi-factor coupling is performed.
There are random variables Y based on time series as dependent variables, X 1 ,     X 2 , ,   X i ,   ,   X n as independent variables. The degree of Y change caused by the perturbation of the independent variable X i     i = 1 ,   2 ,   3 ,   ,   n   is the sensitivity of the dependent variable. Suppose there exists a non-linear deterministic mapping relationship Y = f     X 1 ,   X 2 ,   ,   X i ,   ,   X n   , then the relationship expressed by the sample is as follows [18]:
y 1 = f     x 1 , 1 ,   x 2 , 1 ,   ,   x n , 1   y 2 = f     x 1 , 2 ,   x 2 , 2 ,   ,     x n , 2   y k = f     x 1 , k ,   x 2 , k ,   ,   x n , k   y m = f     x 1 , m ,   x 2 , m ,   ,   x n , m  
where k and m are the sample size; n is the dimension of the independent variable.
According to Taylor’s median theorem, the Taylor expansion of the multivariate function is performed while retaining the second-order partial derivatives and further simplified such that Δ y k k + 1 y k = η k , then η k is the mapping of the independent variable x i , k and its increment Δ x i , k k + 1 , denoted as g   :
η k   =   g   x 1 , k ,   x 2 , k ,   ,   x n , k ,   Δ x 1 , k k   +   1 ,   Δ x 2 , k k + 1 ,   ,   Δ x i , k k + 1 ,   , Δ   x n , k k + 1
For the non-linear mapping relationship of g   * , as long as the sample size m is large enough, a BP neural network can be used for identification. If the BP neural network completes the identification of the mapping relationship g   * through training, the increment of the independent variable Δ x i , k k + 1 = 0 is introduced into the zero-return disturbance, so as to calculate the influence of ignoring the increment of the independent variable x i on the dependent variable. Then,
η i , k = g   x 1 , k , x 2 , k , , x i , k , , x n , k , Δ x 1 , k k + 1 , Δ x 2 , k k   +   1 , , Δ x i 1 , k k   +   1 , 0 , Δ x i   +   1 , k k   +   1 , , Δ x n , k k   +   1
The resulting perturbation of the dependent variable is β i , k   =   η i , k η i , k and the overall perturbation effect for all samples is the sensitivity:
β i = k   =   1 m β i , k m
(2)
Genetic algorithm to optimize the initial weights of BP neural network
The BP (backpropagation) neural network, a concept introduced in 1986 by scientists led by Rumelhart and McClelland, is a multilayer feed-forward neural network trained according to an error backpropagation algorithm and is one of the most widely used neural network models [19].
A BP neural network is composed of a large number of neurons connected with each other, which is used to simulate the complex network system of the human brain’s thinking mode. It has attracted widespread attention due to its excellent properties such as parallel distribution processing, self-organization, self-adaptation, self-learning, and fault tolerance [20]. The artificial neural network can make full use of historical data to represent the complex relationship between system input and output. The theory, analysis technology, and algorithm of the artificial neural network are introduced into the field of hydrology and water resources to establish an applicable artificial neural network model, which is expected to solve the complex problems that are difficult to handle [21].
By using the genetic algorithm to optimize the initial weights of the network, the genetic algorithm and the BP algorithm are organically combined to achieve complementary advantages. The initial weights of the network are first optimized using the genetic algorithm, and then the BP algorithm is used to finalize the network training. The main elements of the genetic algorithm to optimize the initial weights of the network are the expression of chromosomes, the definition of the objective and fitness functions, the construction of evolutionary and genetic operators, etc. Some studies have been well applied in the research on how to improve the accuracy of intelligent flood forecasting, especially to improve the accuracy of flood forecasting [22].
The network training adopts the improved BP algorithm based on the genetic algorithm to optimize the initial weight of the network and the limited supervision and adjustment of the learning rate [23]. The transfer function is an S-type logsig function, and the network initialization weight is randomly generated in the [−1, +1] interval. According to multiple trial calculations, the hidden layer was determined to be 2, with nodes of 50 and 30 respectively. Because the sample inputs belong to different physical quantities with different dimensions and large differences in orders of magnitude, they are normalized by transforming the range of values to the interval 0.1–0.9, the relevant parameters are shown in Table 1.

3. Results

3.1. Analysis of Runoff Influencing Factors

The sunspot relative number is an index of the degree of sunspot activity, which was proposed by Wolfe of the Zurich Observatory in 1849. At present, the regularly published global sunspot number is a daily estimate of the sunspot number over the entire solar surface based on the development curve of the sunspot population and using the visibility function. It is not affected by the geometric factors of the day and the Earth and does not show a 27 d period. It can well describe the state of solar activity. Therefore, the sunspot number is commonly used as an astronomical factor for extreme climate prediction. For example, there are relevant research results in eastern China [24,25], central China [26], western China [27,28,29], and Japan [6]. Solar activities are directly related to drought and flood in the Second Songhua River Basin, and the flood years are concentrated in three phases: peak (M year), post-peak (M + 2, M + 3 years), and valley (m − 1, m years) [30]. At the same time, there is a 10-year alternation cycle of drought and flood, that is, years 1, 4, and 6 are flood years, years 0, 3, 5, and 7 are normal, and years 2, 8, and 9 are drought years, which is close to the average 11-year cycle of sunspot activity. The reasonable explanation is that solar activity leads to this rule. Therefore, this article selects the sunspot relative number as the forecast physical factor to have the scientific basis and practical significance.

3.2. Recognition of Runoff Forecast Factors

3.2.1. Recognition of Time Lag Caused by Solar Activity

Solar activity affects solar radiation, leading to changes in atmospheric (land surface) temperature and humidity, thus causing atmospheric circulation. Atmospheric circulation influences water vapor through monsoons, air pressure, and wind bands to produce precipitation, and the precipitation finally produces runoff in the land hydrological process, that is, the astronomical factors have a time lag effect on the runoff of the basin. Therefore, identifying the time delay of astronomical factors is the key to determining the forecast factor. The global sensitivity analysis method based on the coupling effect of multiple factors is used to identify the monthly sunspot relative number with a large correlation in the early stage. The training samples are shown in Table 2.
The results of the sensitivity analysis show that the influence time lag of sunspot relative number is 2–3 months, that is, the sunspot relative number 2 or 3 months ago has a good correlation with the current month’s runoff (Figure 2). It can be considered that the sunspot relative number in the first three months has the greatest impact on the runoff in the study area. Before that, the effect is gradually weakened, and after that, the effect is gradually increased.

3.2.2. Determination of Runoff Forecast Factors

According to the results of sensitivity analysis, the higher sensitivity of the month of sunspot relative number to June, July, August, and September of runoff is March, April, May, and July. Jilin Province Hydrology and Water Resources Bureau (Jilin Province Water Environment Monitoring Center) releases annual flood season (June–September) inflow forecast in mid-April. Therefore, considering the factors of the foreseeable period, two groups of schemes are set up by taking into account the months of sunspot relative number, and the foreseeable period is shown in Table 3.
The improved BP network [31,32] was used to simulate the mapping relationship between the relevant month of sunspot relative number and each month of runoff in the flood season. The sunspot relative number for January, February, March, and April (Scheme 1), and the sunspot relative number for January, February, and March (Scheme 2) was used as network inputs, and the monthly runoff in June, July, August, and September in the Baishan and Fengman Reservoirs was used as network outputs. Monthly average runoff from 1956 to 2006 was used as training samples, and monthly average runoff from 2007 to 2015 was used as validation. The simulation results were tested with relative errors. The relative error can reflect the reliability of the simulated value, and its calculation formula is:
R E = μ x μ × 100 %
where μ is the measured value, m3/s; x is the simulated value, m3/s.
The process of runoff for September in the Baishan and Fengman Reservoirs is shown in Figure 3 and Figure 4, and the relative errors of the simulation results for each month of runoff are shown in Table 4 and Table 5.
According to the results of the relative error of the simulated monthly runoff of the two schemes, the relative error of the monthly runoff in 2012 is larger in the nine years, and the relative error of the September runoff is larger in the four months for the Baishan Reservoir and the Fengman Reservoir. Comparing the results of the two schemes, the mean values of the relative errors of the two schemes for Baishan Reservoir are 0.21 and 0.23, respectively, and the differences between the two schemes are not significant. The mean values of the relative errors for the two schemes for the Fengman Reservoir are 0.30 and 0.25, respectively, which shows that Scheme 2 is better than Scheme 1. Therefore, the forecast factors for runoff were determined to be the sunspot relative number in January, February, and March.

3.3. Application of the Forecast Model

Construction and Testing of Forecast Model
Based on the BP algorithm, the forecasting model was constructed by using the determined runoff forecast factors. The average runoff of the Baishan and Fengman Reservoirs in the flood season (June–September) from 1956 to 2006 was used as training samples, and the average runoff of flood season (June–September) from 2007 to 2016 was used as validation samples. The goodness of fit (R2) and Nash–Sutcliffe efficiency coefficient (NSE) are used to evaluate the fitting, and the calculation formulas are as follows:
(1)
Coefficient of determination
R 2   =   i   =   1 n y ^ i y ¯ 2 i   =   1 n y i y ¯ 2
where y i is the measured value; y ^ i is the simulated value, and y ¯ is the measured average value.
The coefficient of determination (R2) is the fitting degree of the regression line to the observation value. The value range is [0, 1], the closer the value of R2 is to 1, the better the fitting degree of the regression analysis to the observation value, and vice versa.
(2)
Nash–Sutcliffe efficiency coefficient
N S E   =   1 i   =   1 n Q i Q i 2 i   =   1 n Q i Q ¯ i 2
where Q i is the measured value, Q i is the simulated value, and Q ¯ i is the measured average value.
The Nash–Sutcliffe efficiency coefficient (NSE) is a statistical parameter that describes the fitting accuracy of the calculated value to the target value. The value range is −∞ to 1. The closer the value is to 1, the better the simulation effect is. The simulation effect close to 0 is close to the average level of the measured value, and the simulation effect less than 0 is poor.
The process of the runoff in the flood season (June to September) for the Baishan and Fengman Reservoirs are shown in Figure 5 and Figure 6. The evaluation results of forecast results are shown in Table 6.
According to the results of the monthly average inflow process forecasts for the Baishan and Fengman Reservoirs during the flood season (June–September), it can be seen that the flood season average inflow forecasts for the Baishan Reservoir are very good, while the flood season average inflow forecasts for the Fengman Reservoir meet the accuracy requirements, but worse than the Baishan Reservoir forecast results. Among them, the errors in 2010 and 2012 were relatively large, which exceeded 20% of the medium- and long-term forecast allowable errors. The reason was that human activities in the Fengman River Basin had a great influence. In the year of extraordinary flood in 2010, the superposition of flood discharge in the basin was large, and only 728 floods superimposed nearly 700 million cubic meters, and 805 pre-discharge superimposed nearly 1 billion cubic meters, so the forecast value was small. The year 2012 is the second year in a row of dry years, and it is an extremely dry year. The reservoir in the basin has less water storage and a serious interception, so the forecast value is large. Therefore, the qualitative forecast for 2010 is accurate and the qualitative forecast for 2012 is incorrect.

4. Discussion

4.1. Forecast Practice and Evaluation in 2017

By completing and training the intelligent network, the monthly average runoff in the flood season (June–September) of 2017 was forecast as follows:
In 2017, for the Baishan Reservoir, the monthly average inflow in June–September was forecast to be 655 m3/s, and the average for many years is 390 m3/s. Using the specification of “Forecasting norm for hydrology intelligence (GB/T 22482-2008)” (Table 7), 2017 in the Second Songhua River Basin was qualitatively forecast as a high-flow year.
In 2017, the actual monthly average inflow in the flood season was 324 m3/s in the Baishan Reservoir, and the anomaly was −17. Thus, the flood season was a low-flow year. The monthly average inflow is 224 m3/s over the full year and is 228 m3/s over many years. The anomaly was −2, indicating a normal flow year. Thus, in 2017, the qualitative forecast of inflow was incorrect for the Baishan Reservoir.

4.2. Forecast Practice and Evaluation in 2018

In 2018, the samples were trained based on the classification in the Baishan Reservoir; that is, the monthly average runoff in June–September was ranked into two groups: <500 m3/s and >500 m3/s for training. The corresponding forecast results were 400 and 404 m3/s.
The average was taken from two groups, giving a forecast result of 402 m3/s in 2018, and an anomaly of 3. This indicated that 2018 was a normal flow year.
In the Baishan Reservoir, the actual monthly average inflow was 411 m3/s in the flood season of 2018, and the anomaly was 5, indicating that 2018 was a normal flow year. Thus, the quantitative forecasts in 2018 were correct in the Baishan Reservoir.

5. Conclusions

By the sensitivity analysis method, the mechanism of solar activity effect on runoff in the catchment area of the Fengman and Baishan Reservoirs in the Second Songhua River Basin was determined. For the runoff in June–September, the sensitivity indexes of SSN in the first 3 months and the runoff in the current month were at a maximum. This indicated a time lag of 3 months for solar activity to runoff in the Fengman and Baishan Reservoirs. Thus, SSN in January, February, and March served as forecast factors, and the average runoff in June–September was the forecast item, so the forecast model was constructed.
In combination with the long series historical data, by the non-linear relationship between the forecast factor and the forecast item simulated by BP network, from the perspective of forecast verification of previous inflow the forecast results in most years were good, with the exceptions of special years of high flow in 2010 and continuous low flow in 2012. The reason for the larger forecast errors in the high-flow and low-flow years was that the Fengman Basin was greatly affected by human activity. Many small reservoirs, dams, and pools have been formed upstream. This was the key factor causing the inaccurate quantitative forecasts in the high-flow and low-flow years. However, the qualitative forecast always could stray away from this influence. Thus, in the practical forecast, quantitative forecast and qualitative analysis should be combined to guarantee the reliability of the forecast result.
For the Baishan Reservoir, the qualitative and quantitative forecasts were both incorrect in 2017. In 2018, the qualitative and quantitative forecasts were correct for the Baishan Reservoirs. The reason for the forecast result by the classification was that the training principle of the BP network was the minimum overall error. Therefore, the network acquired more medium values but had insufficient mapping ability for large and small values. Through the classification and grouping of the samples, the BP network model overcame the problem and thereby acquired the ideal forecast result.
From a macroscopic view, astronomical factors influence basin runoff through atmospheric circulation, which ultimately has a combined effect on basin runoff together with the underlying surface. Therefore, forecasts should introduce influencing and restriction factors that can reflect the underlying conditions. It is supposed that sea temperature may be an index that can reflect such influences and possess better stability, and this is a research direction for future work.

Author Contributions

Conceptualization, analysis, writing original draft preparation, review, and editing: Y.C.; methodology, analysis, review, and editing: F.Y., H.S. and H.L.; review and modify: Y.X. All authors have read and agreed to the published version of the manuscript.

Funding

This study was supported by key R&D project funding from Jilin Province Science and Technology Department, China, 20200403070SF.

Institutional Review Board Statement

Not applicable.

Informed Consent Statement

Not applicable.

Data Availability Statement

Not applicable.

Acknowledgments

The authors would like to thank the Jilin Province Science and Technology Department for providing financial support for this research and the Baishan and Fengman Reservoirs for providing the data.

Conflicts of Interest

The authors declare no conflict of interest.

References

  1. Ma, A.S.H.; Han, X.M.; Fan, C.H.R. Predicting Floods Using Astronomical Element Indicators. Northeast. Water Power 2006, 5, 39–57. (In Chinese) [Google Scholar]
  2. Chen, S.H.Y. Theoretical Model and Method for Comprehensive Analysis of Medium- and Long-term Hydrological Forecasts. J. Hydrol. 1997, 8, 16–22. (In Chinese) [Google Scholar]
  3. Li, C.H.Y. The Change of Solar Activity and Its Impact on Earth Climate. Adv. Meteorol. Sci. Technol. 2014, 4, 6–8. (In Chinese) [Google Scholar]
  4. Liu, Q.R. Study on the Occurrence Pattern and Long-term Forecast of Flood and Drought Disasters in the Songhua River Basin. Adv. Water Sci. 1994, 4, 319–327. (In Chinese) [Google Scholar]
  5. Zhang, B.B.; Wang, P.; Zhang, H.; Wang, M.M. Correlation Analysis Between Precipitation and Sunspot Activity in Ankang Region in Recent 63a. Arid. Zone Res. 2018, 35, 1336–1343. (In Chinese) [Google Scholar]
  6. Dong, L.K.; Zhang, P.C.; Liu, J.G.; Tong, X.X.; Xie, H. Impact of Sunspots and ENSO on Hydrological Elements in the Yoshino River Basin, Japan. Adv. Water Sci. 2017, 28, 671–680. (In Chinese) [Google Scholar]
  7. Herman, J.R.; Goldberg, R.; Sun, A.; Sheng, C.H.Y. Weather, Climate; Jiang, Y.T., Xu, Z.H.T., Eds.; Meteorological Press: Beijing, China, 1984. [Google Scholar]
  8. van Loon, H.G.; Meehl, A.; Julie, M. Arblaster. A decadal solar effect in the tropics in July–August. J. Atmos. Sol.-Terr. Phys. 2004, 66, 1767–1778. [Google Scholar] [CrossRef]
  9. Lee, J.N.; Shindell, D.T.; Haneed, S. The Influence of Solar Forcing on Tropical Circulation. J. Clim. 2009, 22, 5870–5885. [Google Scholar] [CrossRef]
  10. Scafetta, N. Climate Change and Its Causes, A Discussion About Some Key Issues. Physics 2010, 4, 70–75. [Google Scholar]
  11. Verschuren, D.; Laird, K.R.; Cumming, B.F. Rainfall and drought in equatorial east Africa during the past 1100 years. Nature 2000, 403, 410–414. [Google Scholar] [CrossRef]
  12. Zhu, K.Z.H. Zhu Kezhen’s Collected Work; Science Press: Beijing, China, 1979. (In Chinese) [Google Scholar]
  13. Qu, W.Z.H.; Deng, S.H.G.; Huang, F.; Chen, L.; Zhao, X. Impact of Anomalous Changes in the Magnetic Index of the Solar Magnetic Field on Mid-latitude Climate in the Northern and Southern Hemispheres. J. Geophys. 2004, 4, 398–404. (In Chinese) [Google Scholar]
  14. Coughlin, K.T.; Tung, K.K. 11-Year solar cycle in the stratosphere extracted by the empirical mode decomposition method. Adv. Space Res. 2003, 34, 323–329. [Google Scholar] [CrossRef]
  15. Wang, Y.Z.H.; Peng, Z.F.; Xue, Y.J.; Wang, G.Q. A Preliminary Study on the Relationship Between Sunspot Activity and Yellow River Runoff and Flooding. North West Water Resour. Hydraul. Eng. 1997, 32, 40–45. (In Chinese) [Google Scholar]
  16. Ye, S.; Zhan, D. Engineering Hydrology, 3rd ed.; China Water Conservancy and Hydropower Press: Beijing, China, 1991. (In Chinese) [Google Scholar]
  17. Li, H.Y.; Tian, L.; Wu, Y.N.; Xie, M. Improvement of mid- to long-term runoff forecasting based on physical causes: Application in Nenjiang basin, China. Hydrol. Sci. J. 2013, 58, 1414–1422. [Google Scholar] [CrossRef]
  18. Li, H.; Tian, Q.; Wang, X.; Wu, Y.N. Multivariate Coupling Sensitivity Analysis Method Based on a Back-Propagation Network and Its Application. J. Hydrol. Eng. 2015, 20, 06014013. [Google Scholar] [CrossRef]
  19. Wen, X.; Zhang, X.W.; Zhu, Y.P.; Li, X. Intelligent Fault Diagnosis Techniques: MATLAB Applications; Beijing University of Aeronautics and Astronautics Press: Beijing, China, 2015. [Google Scholar]
  20. Ochoa-Rivera, J.C. Prospecting droughts with stochastic artificial neural networks. J. Hydrol. 2008, 352, 174–180. [Google Scholar] [CrossRef]
  21. Ochoa-Rivera, J.C.; García-Bartual, R.; Andreu, J. Multivariate synthetic streamflow generation using a hybrid model based on artificial neural networks. Hydrol. Earth Syst. Sci. 2002, 6, 641–654. [Google Scholar] [CrossRef]
  22. Ding, J.; Deng, Y.R.; An, X.S. Exploration of artificial neural feedforward (BP) network models for runoff prediction during the transition period. Hydropower Stn. Des. 1997, 2, 70–75. [Google Scholar]
  23. Li, H.Y.; Liu, X.L.; Bao, X.H. A finite supervised adjustment method for learning rate. J. Jilin Univ. (Eng. Ed.) 2007, 37, 846–850. [Google Scholar]
  24. Han, X.; Yan, J.; Li, M.; Wu, M. Correlation between drought and flood in liaoning province and sunspot activity. Water Soil Conserv. Bull. 2014, 34, 231–235. (In Chinese) [Google Scholar]
  25. Cao, Y.; Liu, J.; Gao, L. Study on the relationship between precipitation and sunspots in northwest liaoning in recent 54 years. Geogr. Sci. 2015, 35, 1027–1032. (In Chinese) [Google Scholar]
  26. Zheng, X.; Lu, F.; Ma, J. Study on the relationship between drought and flood in huai river basin and sunspots in the past 50 years. Hydro-Electr. Energy Sci. 2013, 31, 1–4. (In Chinese) [Google Scholar]
  27. Dou, R.; Yan, J. Correlation analysis of the activity cycle of sunspots in guanzhong plain and drought and flood disasters. Resour. Environ. Arid. Reg. 2013, 27, 76–82. (In Chinese) [Google Scholar]
  28. Xi, X.; Liu, H. Relationship between runoff and sunspot activity in the tarim river trunk stream. Adv. Geogr. Sci. 2013, 32, 880–886. (In Chinese) [Google Scholar]
  29. Zhang, X.; Zhang, Y.; Xu, H. Trends and influencing factors of runoff in the tahe river basin from 1960 to 2010. J. Lanzhou Univ. (Nat. Sci. Ed.) 2013, 49, 38–43. (In Chinese) [Google Scholar]
  30. Hong-Yan, L.; Li-Jun, X.; Xiao-Jun, W. Relationship between Solar Activity and Flood/Drought Disasters of the Second Songhua River Basin. J. Water Clim. Change 2015, 6, 578–585. [Google Scholar] [CrossRef]
  31. Zhongrui, W.; Feng, S.; Maocang, T. A relationship between solar activity and frequency of natural disasters in China. Adv. Atmos. Sci. 2003, 20, 934–939. [Google Scholar] [CrossRef]
  32. Li, H.; Liu, H.; Yuan, X.; Liu, S.H. Artificial neural network peak identification theory and its application in flood forecasting. J. Nat. Hazards 2002, 33, 15–20. [Google Scholar]
Figure 1. Reservoir sites and catchment area for the Second Songhua River.
Sustainability 14 10627 g001
Figure 2. Sensitivity of the previous period sunspot relative number to the current month’s runoff.
Sustainability 14 10627 g002
Figure 3. Runoff simulation process of September in Baishan Reservoir.
Sustainability 14 10627 g003
Figure 4. Runoff simulation process of September in the Fengman Reservoir.
Sustainability 14 10627 g004
Figure 5. Forecast runoff process of the Baishan Reservoir in flood season.
Sustainability 14 10627 g005
Figure 6. Forecast runoff process of the Fengman Reservoir in flood season.
Sustainability 14 10627 g006
Table 1. Main training parameters of BP algorithm.
GS’s ParametersBP’s Parameters
ParametersValuesParametersValues
Population size12,000Normalized maximum0.90
Selection rate0.05Normalized minimum0.10
Crossover rate0.10Momentum coefficient0.80
Variation rate0.05Learning rate adjustment factor0.80
Initial interval [−1, 1]Initial learning rate0.01
Evolutionary algebra30Number of iterations10,000
Table 2. Training samples.
Network Input/Sunspot Relative NumberNetwork Output/Runoff (m3/s)
T (3)T (2)T (1)T (0)R (3)
MarchAprilMayJuneJune
AprilMayJuneJulyJuly
MayJuneJulyAugustAugust
JuneJulyAugustSeptemberSeptember
Note: T (0) is the current month, T (1) is the previous 1st month, T (2) is the previous 2nd month, T (3) is the previous 3rd month.
Table 3. Schemes of monthly runoff of forecast factors in flood season.
Month of Sunspot Relative NumberRunoff (m3/s)Forecast Period (Month)
Scheme 1JanuaryFebruaryMarchAprilJune 1
JanuaryFebruaryMarchApril July 2
JanuaryFebruaryMarchApril August 3
JanuaryFebruaryMarchApril September4
Scheme 2JanuaryFebruaryMarch June 2
JanuaryFebruaryMarch July 3
JanuaryFebruaryMarch August 4
JanuaryFebruaryMarch September5
Table 4. Relative error of runoff simulation results for Baishan Reservoir.
YearJuneJulyAugustSeptember
Scheme 1Scheme 2Scheme 1Scheme 2Scheme 1Scheme 2Scheme 1Scheme 2
20070.320.000.000.000.000.000.590.76
20080.190.060.000.480.600.600.380.14
20090.040.000.190.230.000.100.350.00
20100.330.150.000.000.000.010.010.58
20110.340.340.000.000.030.130.000.00
20120.000.000.650.650.191.210.840.53
20130.290.290.000.000.000.000.000.00
20140.000.000.000.000.000.010.000.00
20150.000.000.760.760.790.790.710.71
Table 5. Relative error of runoff simulation results for the Fengman Reservoir.
YearJuneJulyAugustSeptember
Scheme 1Scheme 2Scheme 1Scheme 2Scheme 1Scheme 2Scheme 1Scheme 2
20070.000.000.000.000.180.070.120.13
20080.620.620.440.440.000.000.010.22
20090.550.020.000.010.000.000.310.01
20100.000.520.060.000.000.000.010.01
20110.000.490.000.000.000.010.210.30
20120.290.391.040.660.710.340.621.22
20130.530.280.000.000.000.000.260.00
20140.000.650.210.220.010.003.520.00
20150.010.000.000.000.770.770.391.85
Table 6. Results of the evaluation of the forecast runoff in the Baishan and Fengman Reservoirs.
Evaluation IndicatorsBaishan ReservoirFengman Reservoir
R20.8960.639
NSE0.8950.613
Table 7. Runoff qualitative classification standard.
ClassificationLow-Flow YearLower Flow YearNormal Flow YearHigher Flow YearHigh-Flow Year
AnomalyAnomaly < −20−20 ≤ Anomaly < −10−10 ≤ Anomaly < 1010 ≤ Anomaly < 20Anomaly ≥ 20
Note: in the Fengman Reservoir, the average monthly runoff volume in the flood season is 390 m3/s over many years, and the monthly average all year round is 228 m3/s.
Publisher’s Note: MDPI stays neutral with regard to jurisdictional claims in published maps and institutional affiliations.

