


Remote Sens. 2024, 16(9), 1574; https://doi.org/10.3390/rs16091574 (registering DOI) - 28 Apr 2024
Abstract
Cloud detection technology is crucial in remote sensing image processing. While cloud detection is a mature research field, challenges persist in detecting clouds on reflective surfaces like ice, snow, and sand. Particularly, the detection of cloud shadows remains a significant area of concern
[...] Read more.
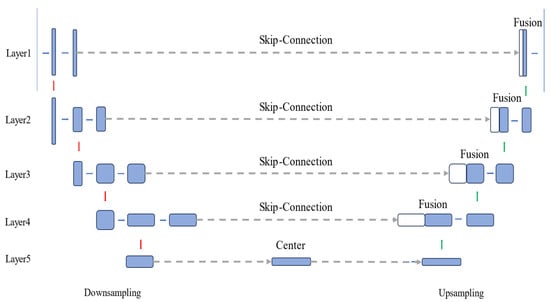
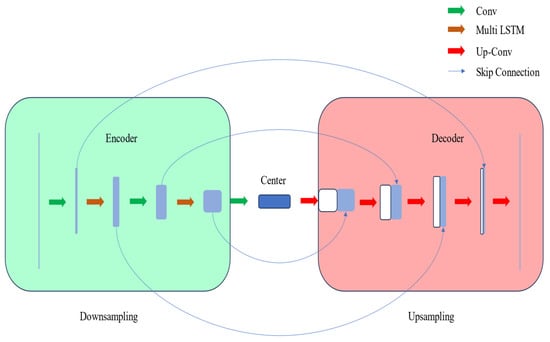
Cloud detection technology is crucial in remote sensing image processing. While cloud detection is a mature research field, challenges persist in detecting clouds on reflective surfaces like ice, snow, and sand. Particularly, the detection of cloud shadows remains a significant area of concern within cloud detection technology. To address the above problems, a convolutional self-attention mechanism feature fusion network model based on a U-shaped structure is proposed. The model employs an encoder–decoder structure based on UNet. The encoder performs down-sampling to extract deep features, while the decoder uses up-sampling to reconstruct the feature map. To capture the key features of the image, Channel Spatial Attention Module (CSAM) is introduced in this work. This module incorporates an attention mechanism for adaptive field-of-view adjustments. In the up-sampling process, different channels are selected to obtain rich information. Contextual information is integrated to improve the extraction of edge details. Feature fusion at the same layer between up-sampling and down-sampling is carried out. The Feature Fusion Module (FFM) facilitates the positional distribution of the image on a pixel-by-pixel basis. A clear boundary is distinguished using an innovative loss function. Finally, the experimental results on the dataset GF1_WHU show that the segmentation results of this method are better than the existing methods. Hence, our model is of great significance for practical cloud shadow segmentation.
Full article
(This article belongs to the Special Issue Remote Sensing Image Classification and Semantic Segmentation)


