Large-Scale Waste Bio-Remediation Using Microalgae Cultivation as a Platform


AlgaeWales Research Group, Centre for Sustainable Aquatic Research (CSAR), College of Science, Bioscience department, Swansea University, Singleton Park, Swansea SA2 8PP, UK
*
Author to whom correspondence should be addressed.
Energies 2019, 12(14), 2772; https://doi.org/10.3390/en12142772
Submission received: 11 June 2019
/
Revised: 11 July 2019
/
Accepted: 16 July 2019
/
Published: 19 July 2019
(This article belongs to the Special Issue Selected papers from the British Council Researcher Links UK-Russia Workshop "Scientific and Technical Grounds of Future Low-Carbon Propulsion")
Abstract
:Municipal and agricultural waste treatment is one of the key elements of reducing environmental impact with direct effects on the economy and society. Algal technology has been tested to enable effective recycling and valorisation of wastewater nutrients including carbon, nitrogen and phosphorus. An integrated evaluation and optimisation of the sustainability of an algal bio-refinery, including mass and energy balances, carbon, water and nutrient use and impact analysis, was assessed. A bio-refinery approach of waste remediation using algal cultivation was developed at Swansea University, focusing on nutrient recovery via algal biomass exploitation in pilot facilities. Mass cultivation (up to 1.5 m3) was developed with 99% of nitrogen and phosphorus uptake by microalgal cultures. Nannochloropsis oceanica was used as a biological model and grown on three waste sources. The compounds obtained from the biomass were evaluated for animal feed and as a potential source of energy. The bioremediation through algal biotechnology was examined and compared to alternative nutrient recovery passive and active methods in order to know the most efficient way of excess nutrient management. Conclusions emphasise the high potential of algal biotechnology for waste remediation and nutrients recovery, despite the need for further development and scalable applications of this new technology.

1. Introduction
The Water Framework Directive (WFD) was implemented in 2000 in Europe and aims to bring all inland water bodies to a standard denoted as having a ‘good ecological status’ [1]. Additionally, the Habitats Directive requires water discharged into inland water to have nutrients removed [2]. The phosphorous, nitrate and ammonium content of water bodies are the focus for water treatment regulations. EU regulation states that the maximum discharge limit of phosphorous is 2 mg L−1 for a population density less than 100,000 inhabitants and 1 mg L−1 for populations above 100,000 inhabitants. In addition, the influent phosphorous concentration levels that enter a waste water treatment plant (WWTP) must be reduced by a minimum of 80% [2]. In the Latin American countries; Chile, Bolivia and Ecuador, the water discharge limits are 40–80 mg L−1 for NH3-NH4 and 10–15 mg L−1 for TP [3,4,5,6]. In China, according to [7] and [8], the discharge limits for NH3-N are 8 mg L−1, 20 mg L−1 for TN and 1 mg L−1 for TP.
To treat these waters, methods ranging from ‘passive’ low energy forms to ‘active’ energy intensive can be implemented. Most of these biological processes are however considered as ‘under development’ and constant research and optimisation is needed to improve the nutrient uptake efficiencies of these technologies [9,10]. Wastewater treatment using microalgal cultivation (passive method) currently requires cost effective technical/biological development; for instance, using new methods such as membrane technology [11]. Algal biotechnology has been successfully used as a bioremediation method [12]; however, this research usually focuses on small scale laboratory testing with little research on growth of algae on real wastewater streams [9], this issue will be addressed in the study.
Regarding active methods to deal with N & P remediation, physicochemical approaches are currently used world-wide [13]. These methods use nutrient precipitation to obtain solids from wastewater and require additional chemicals that can cause pollution [9]. Struvite has been identified as an alternative to phosphate recovery processes [5]. Struvite is a chemical precipitation method, using additional magnesium salt that forms a crystalline P- product which can be easily dried and transported [14]. This can be used to fertilise soils and there is a fledgling market for slow release phosphorus-rich fertilisers [15]. Struvite requires an alkaline environment and the addition of elemental magnesium which is difficult to contain and a rare mineral [13]. Scale of struvite method also needs to be developed to make it an ecologically and financially effective technology [9].
It has been estimated that the cost of controlling and removing scale from wastewater treatment plants in the United States is $40,000 per million m3, per day [16]. Utilising the properties of wastewaters to naturally form scale, and creating technologies that can actively encourage and harvest this process has the potential for more cost-effective waste remediation. On an industrial scale, fluidised bed reactors are used to recover struvite; these systems provide large surface areas for crystallisation. When concentrations of magnesium, phosphate and ammonium are associated in a ratio of 1:1:1 and the pH and energy levels/mixing is optimum, between 70% and 90% uptake rates of nutrients [17] are common. The cost of building a pilot scale fluidised bed reactor is around £40,000 (Envirogen Technologies (USA)) which is around the same cost as building a pilot scale (>2000 L) bioreactor for microalgae cultivation.
Fluidised bed reactors (for the struvite method) are flow-through systems which have been developed to increase nutrient removal, but the standard systems, which are batch fed, have shown only 20–50% phosphorous removal efficiencies [18]. The majority of costs associated with recovery of nutrients via struvite is associated with increasing and maintaining the pH which can cost up to $3500/ton-P [19]; this cost is not incurred with algal production. Algal systems with higher rates of remediation efficiencies (up to 99%) can also be flow-through with a continuous growth regime with addition of nutrients and biomass harvested daily. The greatest cost associated with algal production are the artificial lighting systems (especially in the winter) when grown in photobioreactors (PBRs). This cost can be reduced greatly if the bioreactor design is optimized according to location latitude with the aim to increase natural light exposure. If algal growth facilities are colocated with flue gas producing industries or energy production, the cost of the CO2 and the artificial light support system required for algal growth has the potential to be decreased significantly. Additionally, for wastewater algal treatment, the high-rate algal ponds (HRAP) or algal turf scrubbers (ATS) are used [13,20]. These systems have low CAPEX (capital expenditure); however, water and space usage is higher in comparison with PBRs. Remediation processes in HRAP and ATS are usually less efficient in comparison with the PBR algal remediation. Furthermore, the productivity of algal cultures in PBRs are higher for monospecific biomass; this will be important for the further biomass utilisation [21].
From an ecological perspective, the water usage for PBRs needs to be reduced, especially drinking and irrigation water [22]. For this reason, Nannochloropsis oceanica (N. oceanica) was the model species in this study. This marine species can grow in seawater from the ocean [23] or waste brine water [9,24]. Brine (highly concentrated NaCl water) is the main residue produced during the desalination process through reverse osmosis. This is one of the new waste challenges that will be addressed in the near future [25].
This study aims to evaluate the bioremediation performances by N. oceanica of three sources of wastewater. N. oceanica was cultivated in a large-scale (1500 L) PBR. Nutrient (ammonium and phosphorus) uptake and retention time were assessed and compared to alternative methods. Microalgal and struvite nutrient recovery systems and their remediation efficiency were mainly investigated in this study. The potential for the development of a circular economy based on nutrient recycling from wastewaters by microalgae was investigated as well as the use of microalgal biomass as a source of energy and for product development (e.g., biofertilizer, animal feed).
2. Materials and Methods
2.1. Experimental Design
The aim of the study was to optimise the cultivation process of Nannochloropsis oceanica grown in a 1500 L PBR with waste-based media as feedstock. N. oceanica was chosen as a marine species because during media preparation for inoculation, the wastewater can be mixed with brine from a desalination plant. The initial salinity concentration for all experiments was 30 IU by adding seawater salt to the wastewater. The injected inoculum of culture (in exponential growth) was 10% of the total volume (150 L) with cell concentration ~54.1 × 10⁶ Cell mL−1; control medium was Cell-Hi F2P from Varicon aqua readymade media powder (http://www.variconaqua.com/products-services/algal-nutrients-and-culture-media/) [23]. Waste-based media was prepared by diluting the waste stream. Nitrogen as an ammonium salt was supplemented to the waste medium when sourced from aquaculture waste (trout farm waste), as the initial concentration of N was quite low (Table 1). The initial nutrient concentrations, dilution factors and final N:P ratio are shown in Table 1. Microalgae growth occurred for a total experimental duration of 15 days; biological and water chemistry samples were taken during the first three days of the experiment, followed by every other day. pH, temperature and light intensity were measured automatically with an online data collecting system.
2.2. Waste-Based Media Preparation and Characterization
2.2.1. Agriculture Waste
The agriculture wastewater derived from spent agricultural digested sludge was composed of mixed waste cattle slurry, vegetable waste and silage. This waste was collected from Farm Renewable Environmental Energy Limited (Fre), Wrexham, United Kingdom (http://www.fre-energy.co.uk/). The pretreatment and characterisation of this waste was described in Silkina et al, 2017. The pretreatment of this waste consisted of dilution, mixing, sedimentation and sieving in a 200 L stainless steel vessel. The resulting effluents were then microfiltered using a pilot scale unit equipped with a ceramic membrane (pore size < 0.2 μm) [23]. The resulting particle-free effluents were used as feedstock for microalgae cultivation.
2.2.2. Aquaculture Waste
The aquaculture bio-waste was collected from the Test Valley Trout farm (Romsey, UK), operating in a flow through mode with a settling tank for the collection of solids. The bio-waste was collected from this settling tank and stored at 4 °C to ensure stability. Pretreatment of the bio-waste consisted of 24 hours settling and filtration of the supernatant on a <500 µm pore size mesh. The bio-waste sediment was kept in the settling tank. The filtered bio-waste was characterised by measuring dry mass, total suspended solids, buffering capacity (with HCl and NaOH), particle size distribution and particle surface charge. Particle size distribution and particle surface charge were determined using a Mastersizer Hydro 2000 MU and a Zetasizer 2000 (Malvern Instruments). The particle surface charge was measured as a relation to the measured electrophoretic mobility. The buffering capacity was determined by acid titration using a 0.5 M HCl solution while continuously monitoring the pH. Dry mass (DM) and total suspended solids (TSS) were determined gravimetrically after drying at 105 °C according to standard methods [26].
2.2.3. Anaerobic Digested (AD) Municipal Waste
This waste source was supplied by Afan AD municipal waste plant, Port Talbot, Wales, UK. Following the Anaerobic Digestion (AD) process, the waste stream was pasteurised and UV treated. Membrane filtration with a pore size of 0.2 µm was also applied to remove any particles and sterilise the waste medium. The physicochemical characteristics of the three nutrient waste streams are presented in Table 2.
2.2.4. Membrane Separation Unit
The bio-waste processing unit consisted of a pilot-scale membrane filtration system operating in a cross-flow mode. The main reason was to use this unit to make the three waste streams free from particles and potential biological contaminants, as we would like to use the obtained biomass for future product development. The sludge of all three waste streams was processed by cross-flow filtration and the filtration unit contained two 100 L vessels. One vessel was used for sludge settlement while the other contained the screened suspended sludge and fed the membrane filtration system. A process flow chart of the system is shown in Figure 1. One inch stainless tubing was used to connect, via clamp fittings, two centrifugal pumps, a concentric tube heat exchanger, a pressure control valve, two stainless steel pressure gauges (before and after the filtration module) and a Membralox ceramic MF membrane fitted in stainless steel module. The membrane had a 0.20 μm pore size and an area of 0.22 m². In addition, there were two 1.5 inch clamp butterfly valves in the system. In order to avoid cavitation of the pumps, a minimum holding volume of 5.0 L was established.
2.3. Strain and Culture Medium
Nannochloropsis oceanica Suda & Miyashita (Eustigmataceae) was supplied by the CSAR culture collection, Swansea University, previously provided by Greece Hellinium Marine institute in 2011 and since cultivated in CSAR culture collection [28].
N. oceanica master culture was maintained in a controlled temperature room (18 °C) with a light intensity of 100 µmol photons m−2 s−1 and a light: dark cycle of 16:8 h. The F/2 standard media [29] was used as feedstock for the maintenance of the master culture and inoculum. The inoculum was used during the exponential phase to ensure constant and efficient growth during the experimental phase.
2.4. Cultivation System and Conditions
A vertical tubular photobioreactor (PBR), with a capacity of 1500 L was used. This PBR was based on the Greek Hellinium Marine institute design (Figure 2). The PBR was located in an outdoor greenhouse (51°36′29.1″ N 3°58′53.1″ W, Swansea, UK), at Swansea University (SU). During the day, the algal culture used natural light; at night, artificial white fluorescent lights were used providing 24 h illumination. Both light phase and dark phase (or dark tank) had a volume of 750 L. Culture mixing was achieved by a pump allowing culture movement from light phase to dark phase, the hydraulic retention time (HDT) in the light phase section was between 7 to 10 min. The temperature and pH were monitored with online probes; temperature ranged from 18 to 24 °C and pH was maintained at 7.5 to 8.5. CO2 was injected on demand when pH reached 8.1 (pH set at 8 with a hysteresis of 0.1). The CO2 was injected before the pump, using the pump propeller to allow the formation of microbubble in order to help during the CO2 uptake of the microalgae cells.
2.5. Sampling and Analysis
Every 24 h, cell concentration and bio-volume were measured using a Coulter counter (Multisizer 4, Beckman, USA) Further details are described in [30].
The growth rate was calculated according to Equation (1):
where: Ln = natural logarithm; t1 = time one (in days/h); t2 = time two (in days/h); N1 = Nutrient concentration in the medium at time one; N2 = Nutrient concentration in the medium at time two.
The doubling time was calculated from Equation (2):
where: µ is the specific growth rate, Td is the doubling time
Dry weight was measured according to [31], a known volume of algae was pelleted and washed with deionized (DI) water (three times using 25 mL of DI water each time) prior to being filtered onto a preweighed and dried filters (Whatman GF/F 47 mm Ø). The filters with algal biomass were then dried and reweighed until constant weight was reached. Dry weight (g L−1) was then calculated by subtraction of the final filter weight and the prefiltered weight.
Biomass productivity was calculated as the difference in terms of DW between the sample day and the previous day. The results are expressed in g L−1 d−1.
Water samples for nutrient analysis were sample every other day and analysed using an automated segmented flow analyser (AA3, SEAL Analytical, Germany). Ammonium and phosphate were measured. Microalgal biomass samples for biochemical analysis and dry weight were centrifuged (8000 g, 4 °C, JA-2, Beckman, Germany), suspended and washed twice with deionised water and frozen at −80 °C overnight before freeze-drying for 24 h [32].
The biomass biochemical composition was analysed for lipids using the gravimetric Folch method [33] with modification of [32], for total carbohydrates by DuBois method [34] and for protein content by multiplying the nitrogen content of dried biomass measured using a SerCon GSL elemental analyser (1000 °C combustion temperature), by a factor of 6.28 described in [35]. This approach is analogous to that based on the Kjeldahl digestion [35]. Gross energy content and calorific value (KJ g−1 and Kcal g−1) were measured by combustion of freeze dried biomass in a Parr bomb calorimeter using benzoic acid as a standard [36].
All biochemical measurements were carried out in triplicate, except for protein content, which was performed in duplicate.
2.6. Nutrient Uptake Rate Calculation.
To compare the kinetics of nitrogen and phosphorus removal, calculations were made to assess the time necessary to reach 10 mg L−1 (ΣN) and 1 mg L−1 (P–PO43−) (the most restrictive concentrations in European Union Directive 98/15/CE [27] concerning requirements of N and P in the effluents permitted from urban wastewater treatment).
Nutrient uptake rate (%) was calculated based on Equation (3) [37]:
where, R is the nutrient removal efficiency and Rt and R0 are the nutrient concentration at day t and day 0, respectively.
2.7. Statistical Analyses
Statistical analyses were carried out using the R project software on dry weight, nutrient uptake and intracellular nutrient content data. Data normality was tested using a Shapiro test. This test showed that dry weight and nutrient uptake data were not following a normal distribution (dry weight: p = 0.00105* and p = 6.955 × 10⁻⁶*** and p = 7.472 × 10⁻⁵*** respectively for ammonium and phosphorus uptake). Intracellular nitrogen and phosphorus content data were following a normal distribution (respectively, p = 0.07514 and p = 0.331). Non-normal data significance was assessed using GLMs (generalised linear models) furthered by an analysis of variance (ANOVA) on a data set not following a normal distribution. Crossed factors ANOVAS were carried out on normally distributed data. Both statistical methods tested the impact of experimental duration and waste stream (and interaction) for microalgal cultivation on the measured dry weight, nutrient uptake and intracellular nutrient content. When statistical significance was found, post hoc Tukey tests were implemented.
3. Results
3.1. Algal Waste-Based Growth Experiments
N. oceanica showed a high level of acclimation and growth performance on the three waste-based media, comparable to the control conditions which are presented in Figure 3.
After a short lag phase (2–3 days) cultures grew exponentially for 8 to 10 days, and reached a stationary phase after 15 days of cultivation. The average growth rate during the lag phase (3 days) was 0.26–0.35 day−1 (with 95% Confidence interval, C.I) for all culture conditions. In the exponential phase (8 to 10 days), the growth rate was 0.4 day−1 (95% C.I) for the agriculture waste, AD municipal waste and control. N. oceanica grown on aquaculture waste had a growth rate of 0.6 day−1 (95% C.I). It was 50% faster than the growth under control or the AD municipal waste.
Statistical analysis showed a significant effect of both experimental time and waste stream used for cultivation on the microalgae dry weight (p*** for individual factors and interaction, see supplementary material). The post hoc Tukey tests showed that there were no differences in the dry weight from day 0 to day 3 for all waste streams tested, corresponding to a lag phase at the beginning of the experiment. Dry weight was clearly different for tested feedstock for the remaining experiment and microalgae had best performances in terms of growth when cultivated on the aquaculture waste-based media. This was followed by the control medium and municipal waste (Figure 3). Finally, the agriculture waste condition presented less growth over the whole time of experiment (Figure 3).
The specific growth rate (µ) and the doubling time during the exponential phase were determined using the Equations (1) and (2) respectively. Table 3 illustrates the calculation of the maximum growth rate during the lag and exponential phases and thus the Td (doubling time). Td indicates the possible harvesting frequency of the microalgae culture after it has overcome the lag phase. This harvesting frequency represents an efficiency optimum for the remediation of nutrients by microalgae linking biomass production and water remediation. In that sense, when operating in a continuous mode with frequent harvests, after replenishing water and nutrients, harvesting cycles can take place at 36–40 h intervals for control, agriculture and AD municipal waste-based media conditions. In the case of aquaculture waste-based media every 27 h, the culture could be harvested and the waste-based media and water replenished nearly every day using AQW.
3.2. Waste Remediation Efficiency
The experiments revealed that phosphorous is more readily recovered by the microalgal biomass compared to nitrogen. Both forms of nutrients were remediated to levels below that of the water framework legislation after 10 days of culture growth for all the treatment and the control.
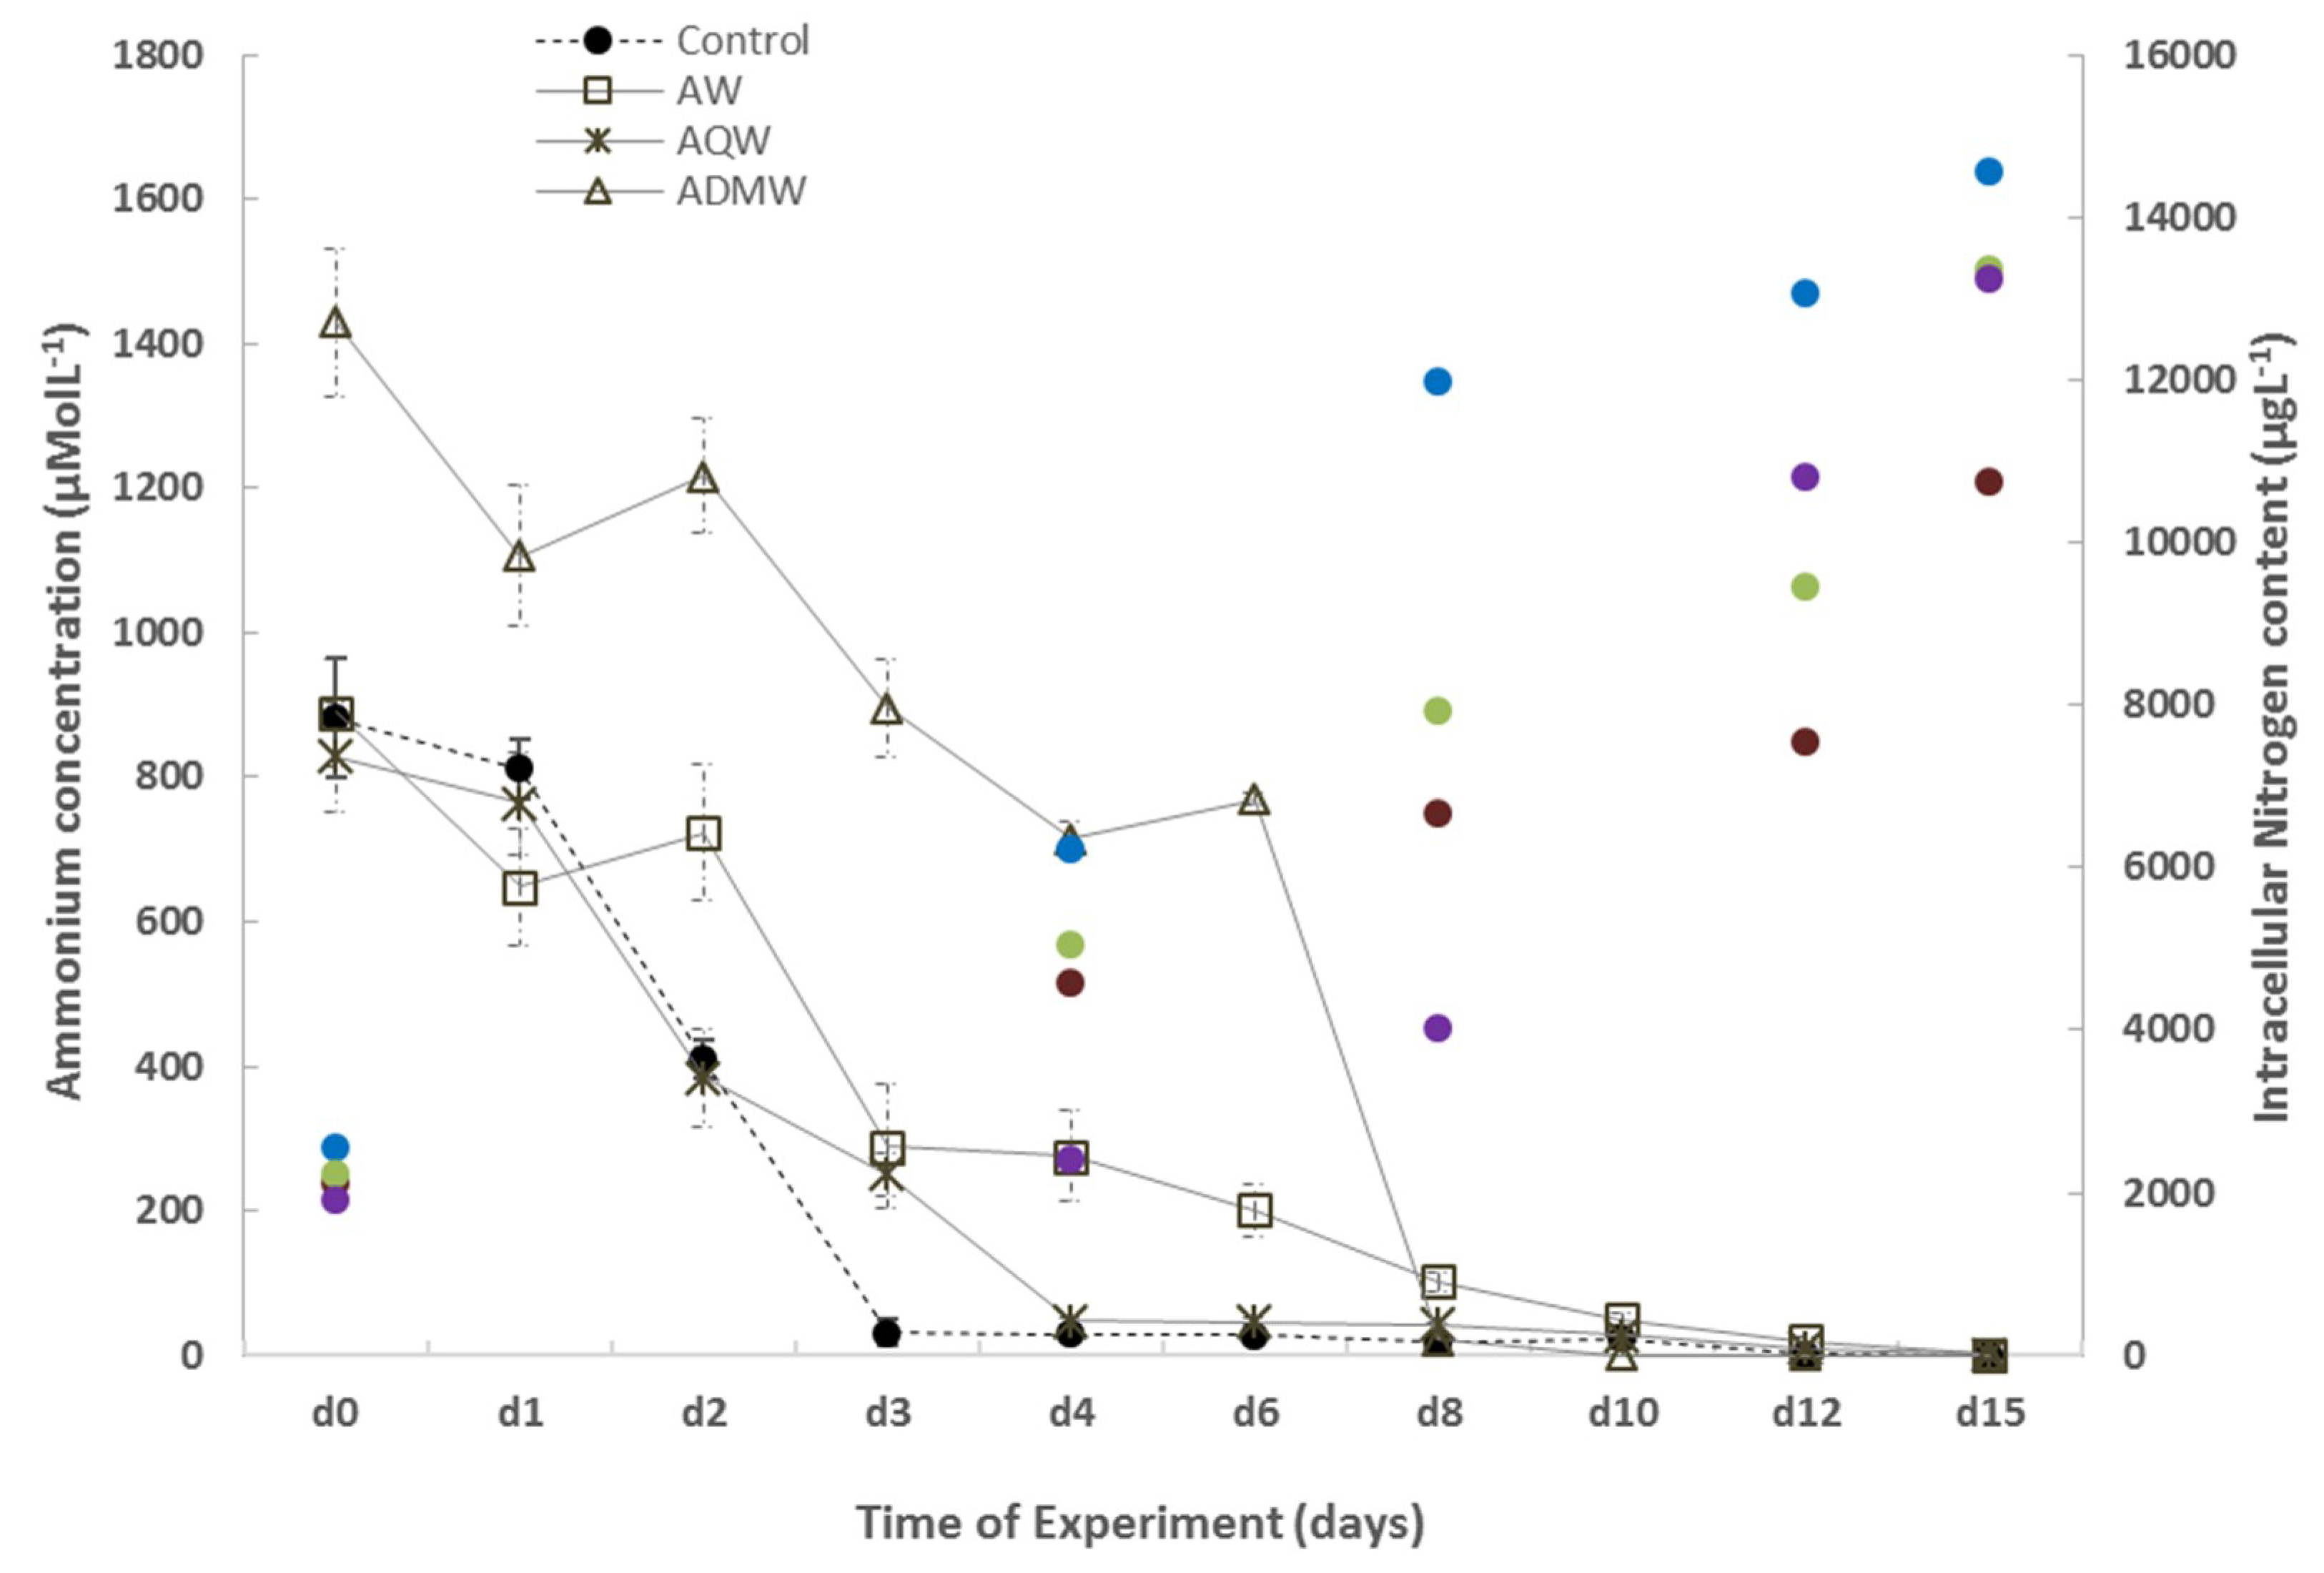
The uptake of ammonium and phosphorus from the growth medium was monitored during the entire cultivation period for the three-waste media and control; data is presented in Figure 4 and Figure 5 and summarised in Table 3. Statistical analysis showed a significant effect of both time of experiment and waste source on ammonium and phosphorus uptake (p*** for individual factors and interaction, Table S1). Results of ammonium uptake showed graphically and statistically that ammonium concentration decreased from day 0 to day 8 to reach a minimum concentration from day 8 with no significant differences between waste streams as ammonium was depleted for all tested conditions. In control condition, uptake of all N-source was achieved on day 4 by N. oceanica. By that time, cultures grown on aquaculture waste consumed 94% of ammonium. N. oceanica had remediated 70% and 50% of the agriculture and AD municipal waste, respectively. After 8 days of cultivation, 99% of ammonium was consumed for all tested treatments in the 1500 L reactor showing an efficient recovery of the ammonium present in all three waste streams.
The phosphorus (P) uptake showed a similar trend with a significant difference in concentrations between waste sources up to day 10 where the phosphorus was almost fully depleted in the tested medium (p***, Table S1). Full P-consumption for all conditions was at day 12. The aquaculture waste experienced the slowest uptake rate while the phosphorus in the control medium was depleted at day 6. Agriculture waste and AD municipal waste were not significantly different and depletion occurred at day 8 for both waste media. The P-uptake was in line with the lag phase in which most of the available P was used up by the cells. In fact, after 6 days of cultivation 60% of the available phosphorus had been consumed for all waste-based conditions. At day 8 and after the available P in the growth medium seemed to be residual with an overall consumption of 99%, P was successfully remediated by N. oceanica for all three waste-based media and the control.
The intracellular phosphorus and nitrogen content were also measured during the experiment. Graphically and statistically, both nitrogen and phosphorus cellular content were not significantly different between day 0 and day 4 (Figure 4 and Figure 5). There was a significant increase from day 8 with higher nitrogen content in N. oceanica cells in the control followed by the aquaculture waste. A similar trend was observed for the phosphorus intracellular content of N. oceanica, with a significant increase from day 8. The intracellular phosphorus content of the microalgae grown on AD municipal waste and agricultural waste was not significantly different as for the nitrogen cell content. The higher phosphorus content was found for the microalgae growing on aquaculture waste and the lowest content was found for the control. The three-fold increase in cellular phosphorus that occurred during the time of experiment was potentially linked to a more frequent cell division and end of the lag phase.
3.3. Biomass Evaluation and Characteristic for Energy and High Value Products Development
The biomass of N. oceanica grown on three waste-based media was sampled and analysed for its biochemical composition presented in Table 4.
The biochemical analysis showed similar content of proteins, carbohydrates and lipids in the biomass grown on waste-based media compared to the F/2 control (Table 4). For example, the AD municipal waste based medium biomass had highest protein content, while the biomass grown on F2 had similar protein content (~36.5%). The biomass grown on the aquaculture and agriculture waste media had protein content 1.3 and 1.7 times lower, respectively, than control. The carbohydrate content ranged from 17.3% to 27.6% with the highest amount found in N. oceanica grown on agriculture waste-based medium. Lipid concentration was the lowest for cultures grown on the AD municipal waste-based medium (~17.9%) and the highest in the aquaculture waste-based cultivation conditions (~34.8%). The results of calorific value reveal potential for the use of the biomass as an energy source for feed and other applications. The highest value of 6.43 kcal g−1 was calculated for cultures grown on aquaculture waste, followed by agriculture waste (5.97 kcal g−1). The municipal waste conditions and control had similar calorific results of 4.9 and 5.5 kcal g−1.
4. Discussion
4.1. Cultivation
Data from the algal waste remediation trials performed at a pilot plant of 1500 L at SU showed high levels of remediation capacity and a scalable approach for waste remediation. Scale of algal cultivation is very important for a successful remediation process. It is known that the results obtained in small scale could be extrapolated to the large-scale calculation, only as a modelling prediction. Unfortunately, in a real scale experiment, the same results are not always obtained [38]. For this reason, the bioremediation of three waste streams in the semi-industrial scale of 1500 L PBR was assessed in this study. In the northern latitudes such as Wales, UK, the use of a PBR is inevitable. PBRs are a closed system where algae can be cultivated in controlled conditions. Better results in terms of final production and reliable and consistent production through the year can be obtained by controlling the abiotic parameters. Additionally, the volumetric productivities in PBRs are significantly higher than in open systems and the cultivation processes are not dependent on seasonal variation [39,40]. Originally, the CAPEX cost of a PBR was extremely high and it was impossible to use these systems for waste remediation. Currently, the CAPEX cost of PBRs are reducing due to the use of new materials. With new PBR technology development, the cost has dropped and the implementation of a biorefinery approach with bio-remediation and the use of the obtained biomass for several end users (bio-fertiliser, agroindustry among others) shows that an effective use of these closed systems can be implemented all year around.
Microfiltration using membrane technology is being used in microalgae biotechnology for many years, mainly for downstream processing [14], but can also be used for upstream processing by preparing the wastewater to be used during the microalgae growth [12]. Membrane technology is a mature method than has been successfully applied in others sectors such as desalination plants, because the energetic cost of small microfiltration units are low, microfiltration in combination with microalgae cultures can be considered in future WWTP as natural and more environmentally friendly technology than mechanical oxygenation in WWTP.
4.2. Waste Remediation
The bioremediation data from this study was compared with the literature, specifically focused on remediation trials using alterative P-recovery struvite methods, HRAP and ATS technologies (Table 5). Algal remediation trials at SU achieved higher levels of nutrient recovery comparable to the struvite remediation method, ATS and HRAP. Algal bioremediation in the PBR is more efficient in a shorter time in comparison with HRAP and ATS. The struvite method is faster; however, the environmental drawbacks need to be considered [9]. Data collected at SU’s 1500 L pilot suggests that using any nutrient source (waste or chemical nutrients) provides efficient growth of microalgae. In addition, within 6 days the ammonium and phosphorous was reduced by more than 80%, which reduced the phosphorous levels to below 1 mg L−1, meaning the water is of dischargeable quality.
In total, 45 g of phosphorous was removed from the bioreactor in batch mode in 4 days, which could be repeated every 4 days. This resulted in 3.7 kg of dried algal biomass being produced in 1500 L PBR in 15 days of cultivation. Forty-five grams of phosphorous is worth less than 5 p (struvite value ~$765/ton [19], whereas 1 kg of algae can retail for >$50 as a food supplement and >$12 as shrimp feed [41]. Additionally, the use of this product as a bio-fertiliser in high concentration requires removal of magnesium as a precipitation agent as it will provide an environmental pollution. This additional removal technology would make this process environmentally unsustainable and increase overall process complexity and costs [13].
Due to the considerable volumes and flow rates involved in the wastewater industry, systems tend to be large-scale. Scalability is one of the major challenges faced by the algal biotechnology industry [50]. The experiments performed in this study took place in a pilot scale (1500 L) bioreactor. This is not a suitable scale for full wastewater treatment, only as a pilot. In the future, the PBR capacity needs to be increased. However, this scale of cultivation is superior to other studies presented in the literature. Nevertheless, direct comparisons with struvite precipitation are difficult. Nutrient recovery via active controlled struvite production is better developed. Phosphate and nitrogen can be removed at a faster rate and, in some cases, largely using struvite systems. This may be the only viable sustainable nutrient recovery option with respect to the large volumes and flow rates in the wastewater industry. In terms of valorisation of the products recovered, microalgae are a more favourable solution. In addition, the running costs of a struvite recovery system are high compared to a microalgal system especially if natural lighting is used and a flue gas source is utilised for CO2.
The obtained results showed high remediation capacity and high microalgae biomass production. Additionally, this remediation study highlights the treatment of wastewater to dischargeable levels in scalable, controllable technology. These investigations were limited by the adopted cultivation nature of batch-mode. At this stage, we could predict the dynamic nature of re-supply of nutrients as the culture would be harvested at 2–3.3 day intervals, which would maximise both biomass and the remediation of P and N. The consideration based on 50% of the culture’s volume could be harvested at the beginning of the exponential phase every 3.3 days. This represented roughly 1500 L of culture at 2.5 g L−1 and a supply of 0.585 mg P L−1 of culture. Table 5 and Table 6 summarises the potential for microalgae production whilst remediating three bio-waste streams (based on P). Based on a simple mass balance for N. oceanica biomass production and remediation of P, 91.3 kg biomass may be produced annually, which remediated 98.3 g of P using a 1500 L PBR. Seemingly, higher bioreactor volumes will have higher yields of P remediation and biomass production.
4.3. Product Development, Fertilisers and Feed Development.
Nutrient budget calculations with regards to nitrogen and phosphorus for fish farms have been carried out mainly with salmonids in marine and freshwater, but also in the Mediterranean Sea for European Sea Bass and Gilthead Sea Bream to estimate their impact on the eutrophication of the water body [36]. Due to strict governmental regulations on aquaculture, especially in Scandinavia, the trend has been to lower nitrogen and phosphorus levels in the fish feeds and/or to increase their digestibility [51]. Phosphorus and nitrogen are limited nutrients for plants and algae, especially as the dissolved fractions of these nutrients are biologically readily available, whereas the particulate fraction will accumulate on the sediment.
Algal biomass could be used in many ways. Firstly, it is a very good ingredient for feed formulation. Based on the results produced by [52] and [53] (Table 6), our algal biomass presented a good alternative for aquaculture and poultry feed development. N. oceanica contains essential omega 3 fatty acids, which are very important components of human and animal diet. Additionally, fish oil supplement production is limited, and fatty acid production from marine algae is considered as an alternative source of this valuable compound. Algae grown using municipal waste can be used as a component of shrimp/fish feed [54]. This represents a significant valorisation of phosphorous recovered as microalgal biomass as opposed to struvite. In addition, the use of microalgae as a waste bio-remediation technology is highly advisable when a circular economy approach is needed [35].
Secondly, the use of algal biomass as a fertilizer could be also considered [55], the biomass contains a high level of nitrogen and phosphorus. It is biodegradable and could be easily used on the land. However, we propose that the produced algal biomass is more valuable in its alternative use as animal feed or extracted compounds for human supplements. Future research needs to be done to evaluate the potential presence of toxic compounds and heavy metals in the algal biomass obtained from bioremediation trials for food and feed consumption. The regulations also need to be complied with for this algal biomass application.
5. Conclusions
In this study, bioremediation of three waste streams at a scale of 1500 L was done using N. oceanica. These trials highlighted high level of adaptation of this species to the waste-based media with a high nutrient uptake rate (above 90% at the day 4). The produced biomass was evaluated for product development and based on biochemical composition it would be used as bio-fertiliser and/or potentially suitable for aquaculture feed development, if the biomass heavy metal and biological contaminants analysis comply with regulations. The remediation uptake was compared to the struvite method and algal bioremediation was longer; however, the valorisation of the produced biomass was much higher and algal biotechnology could be used in circular economy. The results further demonstrate the potential for semicontinuous or continuous cultivation in pilot scale with continuous biomass production.
Supplementary Materials
The following are available online at https://www.mdpi.com/1996-1073/12/14/2772/s1, Table S1: Results of GLM+ANOVA test on crossed factors (time of experiment and waste stream) on the variables; dry weight, ammonium and phosphorus uptake and intracellular N and P. Significance is shown by; ***: p < 0.001, **: p < 0.01 and *: p < 0.05. Results of post hoc Tukey tests indicating levels of significance. C: Control; AQW: Aquaculture Waste; ADMW: AD Municipal Waste; AW: Agricultural Waste.
Author Contributions
A.S. and N.E.G. conceived, designed and performed the waste water-based experiments and samples analysis; F.F. and C.F.G. contributed to data analysis; all authors wrote the paper.
Funding
This research was funded by FP7 BioAlgaeSorb, grant number 243752-2, INTERREG EnAlgae, grant number NEW 215G and ALG-AD, grant number NEW 520.
Acknowledgments
The authors are also grateful to Kevin J. Flynn, Michael Gerardo, Bethan Kultschar and Ingrid Lupatsch for their helpful suggestions during manuscript preparation.
Conflicts of Interest
The authors declare no conflict of interest
References
- European Commision. Directive 2000/60/EC of the European Parliament and of the Council Establishing a Framework for the Community Action in the Field of Water Policy. Available online: https://eur-lex.europa.eu/legal-content/EN/TXT/?uri=celex%3A32000L0060 (accessed on 10 July 2019).
- UKTI. Water and Treated Water. Available online: https://www.gov.uk/government/publications/water-and-treated-water/water-and-treated-water (accessed on 10 July 2019).
- Ministerio de Obras Públicas. Norma de emision para la regulacion de contaminantes asociados a las descargas de residuos industriales liquidos a sistemas de alcantarillado; Ministerio de Obras Públicas: Santiago, Chile, 1998; Available online: https://www.leychile.cl/Navegar?idNorma=121486 (accessed on 16 July 2019).
- Ministerio de Desarrollo Sostenible y Medio Ambiente. Reglamentación de la Ley n° 1333 del medio ambiente: Reglamento en materia de contaminación hídrica; Ministerio de Desarrollo Sostenible y Medio Ambiente: La Paz, Bolivia, 1992. Available online: http://biblioteca.unmsm.edu.pe/redlieds/Recursos/archivos/Legislacion/Bolivia/reglamento_contaminacion.pdf (accessed on 16 July 2019).
- Ministerio de Vivienda, Construcción y Saneamiento. Aprueban límites máximos permisibles (lmp) a las descargas de aguas residuales en los sistemas de recolección de alcantarillado sanitario; Ministerio de Vivienda, Construcción y Saneamiento: Lima, Perú, 2010. Available online: https://www.oefa.gob.pe/?wpfb_dl=7827 (accessed on 16 July 2019).
- Ministerio de Salud y del Ambiente. Ley de Prevencion y Control de la Contaminación Ambiental; Ministerio de Salud y del Ambiente: Quito, Ecuador, 2004. Available online: http://www.ambiente.gob.ec/wp-content/uploads/downloads/2012/09/LEY-DE-PREVENCION-Y-CONTROL-DE-LA-CONTAMINACION-AMBIENTAL.pdf (accessed on 16 July 2019).
- Zhou, Y.; Duan, N.; Wu, X.; Fang, H. Cod discharge limits for urban wastewater treatment plants in china based on statistical methods. Water 2018, 10, 777. [Google Scholar] [CrossRef]
- Ministry of Environment Protection of China: Beijing, China. Discharge standard of pollutants for municipal wastewater treatment plant (gb 18918-2002). Available online: http://english.mee.gov.cn/Resources/standards/water_environment/Discharge_standard/200710/t20071024_111808.shtml (accessed on 15 May 2018).
- Perin, G.; Yunus, I.S.; Valton, M.; Alobwede, E.; Jones, P.R. Sunlight-driven recycling to increase nutrient use-efficiency in agriculture. Algal Res. 2019, 41, 101554. [Google Scholar] [CrossRef]
- Rodero, M.d.R.; Lebrero, R.; Serrano, E.; Lara, E.; Arbib, Z.; García-Encina, P.A.; Muñoz, R. Technology validation of photosynthetic biogas upgrading in a semi-industrial scale algal-bacterial photobioreactor. Bioresour. Technol. 2019, 279, 43–49. [Google Scholar] [CrossRef] [PubMed]
- Gerardo, M.L.; Van Den Hende, S.; Vervaeren, H.; Coward, T.; Skill, S.C. Harvesting of microalgae within a biorefinery approach: A review of the developments and case studies from pilot-plants. Algal Res. 2015, 11, 248–262. [Google Scholar] [CrossRef]
- Tolboom, S.N.; Carrillo-Nieves, D.; de Jesús Rostro-Alanis, M.; de la Cruz Quiroz, R.; Barceló, D.; Iqbal, H.M.N.; Parra-Saldivar, R. Algal-based removal strategies for hazardous contaminants from the environment – a review. Sci. Total. Environ. 2019, 665, 358–366. [Google Scholar] [CrossRef] [PubMed]
- Bunce, J.T.; Ndam, E.; Ofiteru, I.D.; Moore, A.; Graham, D.W. A review of phosphorus removal technologies and their applicability to small-scale domestic wastewater treatment systems. Front. Environ. Sci. 2018, 6, 8. [Google Scholar] [CrossRef]
- Capodaglio, A.G.; Hlavínek, P.; Raboni, M. Physico-chemical technologies for nitrogen removal from wastewaters: A review. Rev. Ambiente Agua 2015, 10, 481–498. [Google Scholar]
- Rahman, M.M.; Salleh, M.A.M.; Rashid, U.; Ahsan, A.; Hossain, M.M.; Ra, C.S. Production of slow release crystal fertilizer from wastewaters through struvite crystallization—A review. Arabian J. Chem. 2014, 7, 139–155. [Google Scholar] [CrossRef]
- Neethling, J.B.; Benisch, M. Struvite control through process and facility design as well as operation strategy. Water Sci. Technol. 2004, 49, 191–199. [Google Scholar] [CrossRef]
- Forrest, A.L.; Fattah, K.P.; Mavinic, D.S.; Koch, F.A. Optimizing struvite production for phosphate recovery in wwtp. J. Environ. Eng. 2008, 134, 395–402. [Google Scholar] [CrossRef]
- Cusick, R.D.; Ullery, M.L.; Dempsey, B.A.; Logan, B.E. Electrochemical struvite precipitation from digestate with a fluidized bed cathode microbial electrolysis cell. Water Res. 2014, 54, 297–306. [Google Scholar] [CrossRef] [PubMed]
- Doyle, J.D.; Parsons, S.A. Struvite formation, control and recovery. Water Res. 2002, 36, 3925–3940. [Google Scholar] [CrossRef]
- Mehrabadi, A.; Craggs, R.; Farid, M.M. Wastewater treatment high rate algal ponds (wwt hrap) for low-cost biofuel production. Bioresour. Technol. 2015, 184, 202–214. [Google Scholar] [CrossRef] [PubMed]
- Azubuike, C.C.; Chikere, C.B.; Okpokwasili, G.C. Bioremediation techniques-classification based on site of application: Principles, advantages, limitations and prospects. World J. Microbiol. Biotechnol. 2016, 32, 180. [Google Scholar] [CrossRef] [PubMed]
- Seelen, L.M.S.; Flaim, G.; Jennings, E.; De Senerpont Domis, L.N. Saving water for the future: Public awareness of water usage and water quality. J. Environ. Manag. 2019, 242, 246–257. [Google Scholar] [CrossRef]
- Silkina, A.; Zacharof, M.-P.; Hery, G.; Nouvel, T.; Lovitt, R.W. Formulation and utilisation of spent anaerobic digestate fluids for the growth and product formation of single cell algal cultures in heterotrophic and autotrophic conditions. Bioresour. Technol. 2017, 244, 1445–1455. [Google Scholar] [CrossRef] [PubMed] [Green Version]
- Menke, S.; Sennhenn, A.; Sachse, J.H.; Majewski, E.; Huchzermeyer, B.; Rath, T. Screening of microalgae for feasible mass production in industrial hypersaline wastewater using disposable bioreactors. Clean-Soil Air Water 2012, 40, 1401–1407. [Google Scholar] [CrossRef]
- Vane, L.M. Review: Water recovery from brines and salt-saturated solutions: Operability and thermodynamic efficiency considerations for desalination technologies. J. Chem. Technol. Biotechnol. 2017, 92, 2506–2518. [Google Scholar] [CrossRef] [PubMed]
- APHA. Standard Methods for the Examination of Water and Wastewater, 20th ed.; Amer Public Health Assn: Washington, DC, USA, 1998. [Google Scholar]
- Gerardo, M.L.; Zacharof, M.P.; Lovitt, R.W. Strategies for the recovery of nutrients and metals from anaerobically digested dairy farm sludge using cross-flow microfiltration. Water Res. 2013, 47, 4833–4842. [Google Scholar] [CrossRef]
- Xiao, Y.; Zhang, J.; Cui, J.; Feng, Y.; Cui, Q. Metabolic profiles of nannochloropsis oceanica imet1 under nitrogen-deficiency stress. Bioresour. Technol. 2013, 130, 731–738. [Google Scholar] [CrossRef]
- Guillard, R.R.L. Culture of phytoplankton for feeding marine invertebrates. In Culture of Marine Invertebrate Animals; Smith, W.L., Chanley, M.H., Eds.; Plenum Press: New York, NY, USA, 1975; pp. 26–60. [Google Scholar]
- Mayers, J.J.; Flynn, K.J.; Shields, R.J. Influence of the n:P supply ratio on biomass productivity and time-resolved changes in elemental and bulk biochemical composition of Nannochloropsis sp. Bioresour. Technol. 2014, 169, 588–595. [Google Scholar] [CrossRef] [PubMed]
- Fuentes-Gruenewald, C.; Bayliss, C.; Zanain, M.; Pooley, C.; Scolamacchia, M.; Silkina, A. Evaluation of batch and semi-continuous culture of porphyridium purpureum in a photobioreactor in high latitudes using fourier transform infrared spectroscopy for monitoring biomass composition and metabolites production. Bioresour. Technol. 2015, 189, 357–363. [Google Scholar] [CrossRef] [PubMed]
- Mayers, J.J.; Flynn, K.J.; Shields, R.J. Rapid determination of bulk microalgal biochemical composition by fourier-transform infrared spectroscopy. Bioresour. Technol. 2013, 148, 215–220. [Google Scholar] [CrossRef] [PubMed]
- Folch, J.; Lees, M.; Stanley, G.H.S. A simple method for the isolation and purification of total lipides from animal tissues. J. Biol. Chem. 1957, 226, 497–509. [Google Scholar]
- Dubois, M.; Gilles, K.A.; Hamilton, J.K.; Rebers, P.A.; Smith, F. Colorimetric method for determination of sugars and related substances. Anal. Chem. 1956, 28, 350–356. [Google Scholar] [CrossRef]
- Safi, C.; Charton, M.; Pignolet, O.; Silvestre, F.; Vaca-Garcia, C.; Pontalier, P.-Y. Influence of microalgae cell wall characteristics on protein extractability and determination of nitrogen-to-protein conversion factors. J. Appl. Phycol. 2013, 25, 523–529. [Google Scholar] [CrossRef]
- Lupatsch, I.; Kissil, G.W.; Sklan, D.; Pfeffer, E. Energy and protein requirements for maintenance and growth in gilthead seabream (sparus aurata l.). Aquac. Nutr. 1998, 4, 165–173. [Google Scholar] [CrossRef]
- Bougaran, G.; Bernard, O.; Sciandra, A. Modeling continuous cultures of microalgae colimited by nitrogen and phosphorus. J. Theor. Biol. 2010, 265, 443–454. [Google Scholar] [CrossRef] [PubMed] [Green Version]
- Béchet, Q.; Plouviez, M.; Chambonnière, P.; Guieysse, B. 21 - Environmental impacts of full-scale algae cultivation. In Microalgae-Based Biofuels and Bioproducts; Gonzalez-Fernandez, C., Muñoz, R., Eds.; Woodhead Publishing: Cambridge, UK, 2017; pp. 505–525. [Google Scholar]
- Delrue, F.; Álvarez-Díaz, P.D.; Fon-Sing, S.; Fleury, G.; Sassi, J.F. The environmental biorefinery: Using microalgae to remediate wastewater, a win-win paradigm. Energies 2016, 9, 132. [Google Scholar] [CrossRef]
- Van Den Hende, S. Microalgal bacterial flocs for wastewater treatment: From concept to pilot scale. Ph.D. Thesis, Ghent University, Ghent, Belgium, February 2014. [Google Scholar]
- Yi, D.; Reardon, T.; Stringer, R. Shrimp aquaculture technology change in indonesia: Are small farmers included? Aquaculture 2018, 493, 436–445. [Google Scholar] [CrossRef]
- Yilmazel, Y.D.; Demirer, G.N. Removal and recovery of nutrients as struvite from anaerobic digestion residues of poultry manure. Environ. Technol. 2011, 32, 783–794. [Google Scholar] [CrossRef] [PubMed]
- Chong, N.M.; Thai, Q.M. Optimization and kinetics of nutrient removal from wastewater by chemical precipitation of struvite. Desalin. Water Treat. 2015, 54, 3422–3431. [Google Scholar] [CrossRef]
- Li, Z.; Ren, X.; Zuo, J.; Liu, Y.; Duan, E.; Yang, J.; Chen, P.; Wang, Y. Struvite precipitation for ammonia nitrogen removal in 7-aminocephalosporanic acid wastewater. Molecules 2012, 17, 2126–2139. [Google Scholar] [CrossRef] [PubMed]
- Van Den Hende, S.; Carré, E.; Cocaud, E.; Beelen, V.; Boon, N.; Vervaeren, H. Treatment of industrial wastewaters by microalgal bacterial flocs in sequencing batch reactors. Bioresour. Technol. 2014, 161, 245–254. [Google Scholar] [CrossRef] [PubMed]
- Gutiérrez, R.; Ferrer, I.; González-Molina, A.; Salvadó, H.; García, J.; Uggetti, E. Microalgae recycling improves biomass recovery from wastewater treatment high rate algal ponds. Water Res. 2016, 106, 539–549. [Google Scholar] [CrossRef] [PubMed] [Green Version]
- Passos, F.; Gutiérrez, R.; Brockmann, D.; Steyer, J.-P.; García, J.; Ferrer, I. Microalgae production in wastewater treatment systems, anaerobic digestion and modelling using adm1. Algal Res. 2015, 10, 55–63. [Google Scholar] [CrossRef]
- Bohutskyi, P.; Chow, S.; Ketter, B.; Fung Shek, C.; Yacar, D.; Tang, Y.; Zivojnovich, M.; Betenbaugh, M.J.; Bouwer, E.J. Phytoremediation of agriculture runoff by filamentous algae poly-culture for biomethane production, and nutrient recovery for secondary cultivation of lipid generating microalgae. Bioresour. Technol. 2016, 222, 294–308. [Google Scholar] [CrossRef]
- Craggs, R.J.; Adey, W.H.; Jessup, B.K.; Oswald, W.J. A controlled stream mesocosm for tertiary treatment of sewage. Ecol. Eng. 1996, 6, 149–169. [Google Scholar] [CrossRef]
- Khan, M.I.; Shin, J.H.; Kim, J.D. The promising future of microalgae: Current status, challenges, and optimization of a sustainable and renewable industry for biofuels, feed, and other products. Microb. Cell Fact. 2018, 17, 36. [Google Scholar] [CrossRef]
- Lindland, K.M.; Gjerstad, B.; Krøvel, A.V.; Ravagnan, E. Governing for sustainability in the norwegian aquaculture industry. Ocean Coast. Manag. 2019, 179, 104827. [Google Scholar] [CrossRef]
- Stiles, W.A.V.; Styles, D.; Chapman, S.P.; Esteves, S.; Bywater, A.; Melville, L.; Silkina, A.; Lupatsch, I.; Fuentes Grünewald, C.; Lovitt, R.; et al. Using microalgae in the circular economy to valorise anaerobic digestate: Challenges and opportunities. Bioresour. Technol. 2018, 267, 732–742. [Google Scholar] [CrossRef] [PubMed]
- Gbadamosi, O.K.; Lupatsch, I. Effects of dietary nannochloropsis salina on the nutritional performance and fatty acid profile of nile tilapia, oreochromis niloticus. Algal Res. 2018, 33, 48–54. [Google Scholar] [CrossRef]
- Van Den Hende, S.; Claessens, L.; De Muylder, E.; Boon, N.; Vervaeren, H. Microalgal bacterial flocs originating from aquaculture wastewater treatment as diet ingredient for litopenaeus vannamei (boone). Aquac. Res. 2016, 47, 1075–1089. [Google Scholar] [CrossRef]
- Alobwede, E.; Leake, J.R.; Pandhal, J. Circular economy fertilization: Testing micro and macro algal species as soil improvers and nutrient sources for crop production in greenhouse and field conditions. Geoderma 2019, 334, 113–123. [Google Scholar] [CrossRef]
Figure 1.
Diagram of microfiltration membrane filtration modified from Gerardo et al, 2015 [27]. P1 and P2—pressure gauges; A and B—centrifugal pumps.
Figure 1.
Diagram of microfiltration membrane filtration modified from Gerardo et al, 2015 [27]. P1 and P2—pressure gauges; A and B—centrifugal pumps.

Figure 2.
Vertical tubular photobioreactor (PBR, total capacity of 1500 L) used in this experimental study.
Figure 2.
Vertical tubular photobioreactor (PBR, total capacity of 1500 L) used in this experimental study.

Figure 3.
Dry weight of N. oceanica (in g L−1) growing on control medium F/2; AW: Agricultural Waste; AQW: Aquaculture Waste; ADMW: Anaerobically Digested Municipal Waste. Error bars represent standard deviation for three biological replicates.
Figure 3.
Dry weight of N. oceanica (in g L−1) growing on control medium F/2; AW: Agricultural Waste; AQW: Aquaculture Waste; ADMW: Anaerobically Digested Municipal Waste. Error bars represent standard deviation for three biological replicates.

Figure 4.
Ammonium uptake (in µMol L−1); lines with markers) and intracellular nitrogen content of N. oceanica (in µg L−1; scatter) for Control medium F/2; AW: Agricultural Waste; AQW: Aquaculture Waste; ADMW: Anaerobically Digested Municipal Waste. Error bars represent standard deviation for three biological replicates.

Figure 5.
Phosphorus uptake (in µMol L−1); lines with markers) and intracellular phosphorus content of N. oceanica (in µg L−1; scatter) for Control medium F/2; AW: Agricultural Waste; AQW: Aquaculture Waste; ADMW: Anaerobically Digested Municipal Waste. Error bars represent standard deviation for three biological replicates.


Table 1.
Nutrient concentrations of selected waste-based media before and after dilution.
| Media Formulation | mMol L−1 N | mMol L−1 P | N:P Ratio | Dilution Factor mL L−1 | Final N Concentration µMol L−1 | Final P Concentration µMol L−1 | N:P Ratio |
|---|---|---|---|---|---|---|---|
| Agricultural waste | 55.4 | 4.3 | 12.7 | 15.9 | 880.8 | 69.3 | 12.7 |
| Aquaculture waste | 8.8 | 57.4 | 24.5 | 1.92 | 17 (+882) * | 110.3 | 8.15 |
| AD municipal waste | 71.4 | 4.5 | 15.9 | 20 | 1428 | 89.7 | 15.9 |
| F/2 | 1 | 882 | 36.2 | 24.5 |
* The additional Ammonium salt was added to the aquaculture waste, as the original waste-stream did not have enough N-source.
Table 2.
Physicochemical characteristics of the three waste sources used as media for N. oceanica cultivation (the data presented with S.D).
Table 2.
Physicochemical characteristics of the three waste sources used as media for N. oceanica cultivation (the data presented with S.D).
| Parameters | Agriculture Waste | Aquaculture Waste | AD Municipal Waste |
|---|---|---|---|
| PH Value | 8.5 ± 0.02 | 8.5 ± 0.2 | 8.7 ± 0.015 |
| BOD (mg L−1) | 421 ± 16 | 405 ± 14 | 433 ± 12 |
| COD (mg L−1) | 2500 ± 256 | 2786 ± 385 | 2766 ± 410 |
| Ammonium (mg L−1) | 360 ± 15 | 26 ± 1.5 | 890 ± 30 |
| TSS (total suspended solids) (mg L−1) | 210 ± 6.8 | 472 ± 9 | 1060 ± 12.1 |
| Phosphorus (mg L−1) | 36.5 ± 0.6 | 418 ± 2.8 | 63 ± 0.5 |
| Magnesium (mg L−1) | 5.9 ± 0.8 | 29 ± 2.6 | 8.55 ± 1.65 |
| Dissolved iron (mg L−1) | 2.64 ± 0.06 | 5.93 ± 0.2 | 2.61 ± 0.03 |
| Conductivity (mS cm−1) | 5.16 ± 0.02 | 0.858 ± 0.006 | 4.89 ± 0.2 |
Table 3.
Summary of growth and nutrients uptake parameters of N. oceanica grown on three waste-based media.
Table 3.
Summary of growth and nutrients uptake parameters of N. oceanica grown on three waste-based media.
| Waste-Based Media | NH4 Uptake Rate (µMol L−1) | P Uptake Rate (µMol L−1) | Max Biomass Concentration (g L−1) | µ at Exp. Phase (day−1) | Doubling Time | |
|---|---|---|---|---|---|---|
| (day−1) | (H) | |||||
| Agriculture waste | 186 | 8.1 | 1.3 | 0.41 | 1.68 | 40.39 |
| AD municipal waste | 36 | 0.74 | 1.78 | 0.45 | 1.53 | 36.80 |
| Aquaculture waste | N/A | 2.73 | 2.5 | 0.62 | 1.11 | 26.71 |
| Control | 192 | 9.6 | 1.99 | 0.42 | 1.64 | 39.43 |
Table 4.
Biochemical composition of Nannochloropsis oceanica grown on three waste based formulated media and on F2 (presented per dry matter).
Table 4.
Biochemical composition of Nannochloropsis oceanica grown on three waste based formulated media and on F2 (presented per dry matter).
| Waste-Based Media | Protein % | Lipids % | Ash % | Carbohydrates % | Energy kcal g−1 |
|---|---|---|---|---|---|
| Agriculture waste | 28 ± 1.3 | 21.4 ± 1.5 | 23.0 ± 0.23 | 27.6 ± 1.6 | 5.9 ± 0.1 |
| Aquaculture waste | 21.3 ± 1.2 | 34.8 ± 1.8 | 23.4 ± 0.17 | 19.7 ± 1.5 | 6.4 ± 0.3 |
| Municipal waste | 36.6 ± 1.7 | 17.9 ± 0.4 | 23.9 ± 0.18 | 23.5 ± 1.8 | 4.9 ± 0.2 |
| F2 | 36.5 ± 1.8 | 24.5 ± 1.5 | 21.8 ± 0.16 | 17.3 ± 1.5 | 5.5 ± 0.4 |
Table 5.
Bioremediation data (in mMol L−1) from literature [42,43,44,45,46,47,48,49] and from this current study, presenting efficiency of nutrient uptake by algal cultivation, compared with struvite nutrient recovery, HRAP and ATS.
| Author | Effluent Type | Parameter | Influent | Effluent | % Recovered | RT (Retention Time) |
|---|---|---|---|---|---|---|
| STRUVITE METHOD | ||||||
| Yilmazel & Demirer, 2011 | Poultry Manure | Ammonia | 3.6 | Unknown | 86% | 60 Min |
| Phosphate | 1.2 | Unknown | 31% | 60 Min | ||
| Chong & Thai, 2014 | Synthetic WW | Phosphate | 0.3 | 54 ± 2 | 84% | 120 Min |
| Li et al., 2012 | Swine WW | Ammonia | 4.9 | Unknown | 88% | 60 Min |
| HRAP | ||||||
| Van Den Hende, et al., 2014 | Manure | TN | 4.3 | 0.2 | 43% | 4 days |
| TP | 3.9 | 1.3 | 65% | 4 days | ||
| Gutierrez et al., 2016 | Urban WW | N-NH4+ | 1.5 | 0.2 | 95% | 1 month |
| Passos et al., 2015 | Municipal WW | N-NH4+ | 1.05 | 0.02 | 95% | 1 month |
| ATS | ||||||
| Bohutskyi et al., 2016 | Agriculture WW | TP | 0.004 | 0.003 | 22% | 1 month |
| TN | 0.07 | 0.05 | 6% | 1 month | ||
| Craggs et al., 1996 | Secondary sewage | TP | 2.9 | 1.4 | 20% | 1 day |
| TN | 21.13 | 5.28 | 40% | 1 day | ||
| ALGAL PBR | ||||||
| Current study | Agriculture WW | TON | 0.8 | 0.0006 | 99.5% | 5 days |
| Nitrate | 0.181 | 0.0005 | 99.9% | 5 days | ||
| N-NH4+ | 0.802 | 0.0003 | 99.9% | 5 days | ||
| T P | 0.007 | 0.0002 | 99.9% | 4 days | ||
| Aquaculture WW | TP | 0.11 | 0.00011 | 99.9% | 4 days | |
| AD municipal WW | N-NH4+ | 0.001 | 0.00012 | 99.9% | 5 days | |
| TP | 0.089 | 0.00016 | 99.9% | 4 days | ||
Table 6.
Composition of commercially available feed ingredients and selected algal species (per dry matter) (modified from [52]).
Table 6.
Composition of commercially available feed ingredients and selected algal species (per dry matter) (modified from [52]).
| Results from [52] | % Crude Protein | % Crude Lipid | % Crude Carbohydrate | % Ash | Gross Energy MJ/kg |
|---|---|---|---|---|---|
| Fish meal | 63.0 | 11.0 | – | 15.8 | 20.1 |
| Poultry meal | 58.0 | 11.3 | – | 18.9 | 19.1 |
| Spirulina | 58.0 | 11.6 | 10.8 | 13.4 | 20.1 |
| Chlorella | 52.0 | 7.5 | 24.3 | 8.2 | 19.3 |
| Tetraselmis | 27.2 | 14.0 | 45.4 | 11.5 | 18.0 |
| Nannochloropsis | 42.8 | 16.6 | 33.9 | 6.7 | 22.6 |
| Results from the current study | |||||
| Nannochloropsis oceanica | 21–36 | 17–34 | 19–27 | 23 | 4–6.5 |
© 2019 by the authors. Licensee MDPI, Basel, Switzerland. This article is an open access article distributed under the terms and conditions of the Creative Commons Attribution (CC BY) license (http://creativecommons.org/licenses/by/4.0/).
Share and Cite
MDPI and ACS Style
Silkina, A.; Ginnever, N.E.; Fernandes, F.; Fuentes-Grünewald, C. Large-Scale Waste Bio-Remediation Using Microalgae Cultivation as a Platform. Energies 2019, 12, 2772. https://doi.org/10.3390/en12142772
AMA Style
Silkina A, Ginnever NE, Fernandes F, Fuentes-Grünewald C. Large-Scale Waste Bio-Remediation Using Microalgae Cultivation as a Platform. Energies. 2019; 12(14):2772. https://doi.org/10.3390/en12142772
Chicago/Turabian StyleSilkina, Alla, Naomi E. Ginnever, Fleuriane Fernandes, and Claudio Fuentes-Grünewald. 2019. "Large-Scale Waste Bio-Remediation Using Microalgae Cultivation as a Platform" Energies 12, no. 14: 2772. https://doi.org/10.3390/en12142772
Note that from the first issue of 2016, this journal uses article numbers instead of page numbers. See further details here.