Article

The Effect of OPV Module Size on Stability and Diurnal Performance: Outdoor Tests and Application of a Computer Model

1
School of Computer Science and Electronic Engineering, Bangor University, Dean Street, Bangor LL57 1UT, UK
2
Faculty of Science and Engineering, Swansea University, Fabian Way, Swansea SA1 1EP, UK
3
James Watt School of Engineering, University of Glasgow, Glasgow G12 8QQ, UK
*
Author to whom correspondence should be addressed.
Energies 2021, 14(19), 6324; https://doi.org/10.3390/en14196324
Submission received: 13 August 2021 / Revised: 13 September 2021 / Accepted: 29 September 2021 / Published: 3 October 2021
(This article belongs to the Section A2: Solar Energy and Photovoltaic Systems)

Abstract

:
The outdoor performance of large area Organic Photovoltaics (OPVs) is investigated in this work. Initially, the diurnal performance of the three modules is determined and found to be similar. Subsequently module degradation is monitored, and it is found that the larger area module displays a significantly greater stability as compared to the smallest area module; in fact the larger module displays a T50% (time to fall to 50% of its original value) of 191 days whilst the smallest module displays a T50% of 57 days. This is attributed to an increased level of water infiltration due to a larger perimeter-to-area ratio. These findings are then used to verify a computer simulation model which allows the model parameters, series and shunt resistances, to be calculated. It is determined that the series resistance is not an obvious obstruction at these module sizes. The findings of this work provide great promise for the application of OPV technology on a larger scale.

1. Introduction

The development and laboratory testing of organic photovoltaic (OPV) devices has been rapid over the past 20 years. However, the stability of OPV devices remains a key issue [1], that can be assessed through a variety of indoor laboratory tests. Data acquired through these methodologies led to the enhancement of stability of the latest generations of OPV cells [2]: by performing indoor stability studies, the isolated effects of various stress factors can be determined, and the physical and chemical degradation pathways involved in the degradation process can be understood in detail. Nevertheless, to fully understand and mitigate the degradation of OPV devices, the combined effect of several stress factors must be studied simultaneously [3]. Outdoor monitoring provides the perfect platform to simultaneously test the effect of various stress factors and determine their impact on the stability of devices and modules.
In addition, outdoor monitoring allows failure modes to be verified and confirmed in real-world conditions; these are the conditions under which the technology will, ultimately, be deployed and OPVs must be able to tolerate them. Furthermore, outdoor monitoring allows to observe behaviours and characteristics which may not be evident from tests conducted in a laboratory environment. For example, the response of OPV devices to low and fluctuating light levels can be assessed. This response cannot be determined from 1-Sun Standard Test Conditions (STC). Silverman et al. have reported on the effect of shading on the performance of thin film solar cells and panels [4]. These reports demonstrate how temporary, partial cloud obstruction will lead to the formation of shunts within thin-film devices which can lead to the rapid deterioration of the solar panel. Furthermore, several other characteristics of OPV devices have been discovered via outdoor testing: for example, [5] shows that OPV devices display a slower rise in performance as a function of irradiance when compared with conventional silicon modules [5]. Outdoor testing work also showed that OPV devices possess a positive temperature coefficient for efficiency [6], which is not observed in many other technologies.
Implementation of OPV technologies for power generation means that modules should be large in scale [7] and versatile such that they can be deployed in a wide range of scenarios, such as integration into buildings [8]. Outdoor monitoring allows large area module tests to be conducted: this would not be possible in typical laboratory setups where the light source cannot illuminate the entire module. To our knowledge, only a handful of works [9,10,11,12,13] show the impact of scaling modules size on the OPV performance and stability. Furthermore, advanced mathematical models are required for system design and integration studies. These models will allow the system designers to determine the behaviour of large modules, their electrical characteristics and their impact on the electrical grid.
The work presented here demonstrates the application of large-area, flexible OPV modules in outdoor conditions. The effect of module size on the outdoor degradation of the devices is studied. The diurnal performance of the modules is assessed, and the degradation of the modules is monitored over the course of six months. The primary causes of degradation are determined and the effect of module size on degradation is identified. A computer simulation model, described in [14], is employed, verified using the experimental data and used to quantify the variation of the module parameters. To our knowledge, this is one of the first reports describing large area module testing and providing an assessment of how module sizes impact on the performance and stability of OPVs, and the first attempt to model OPV module degradation through a computer model.

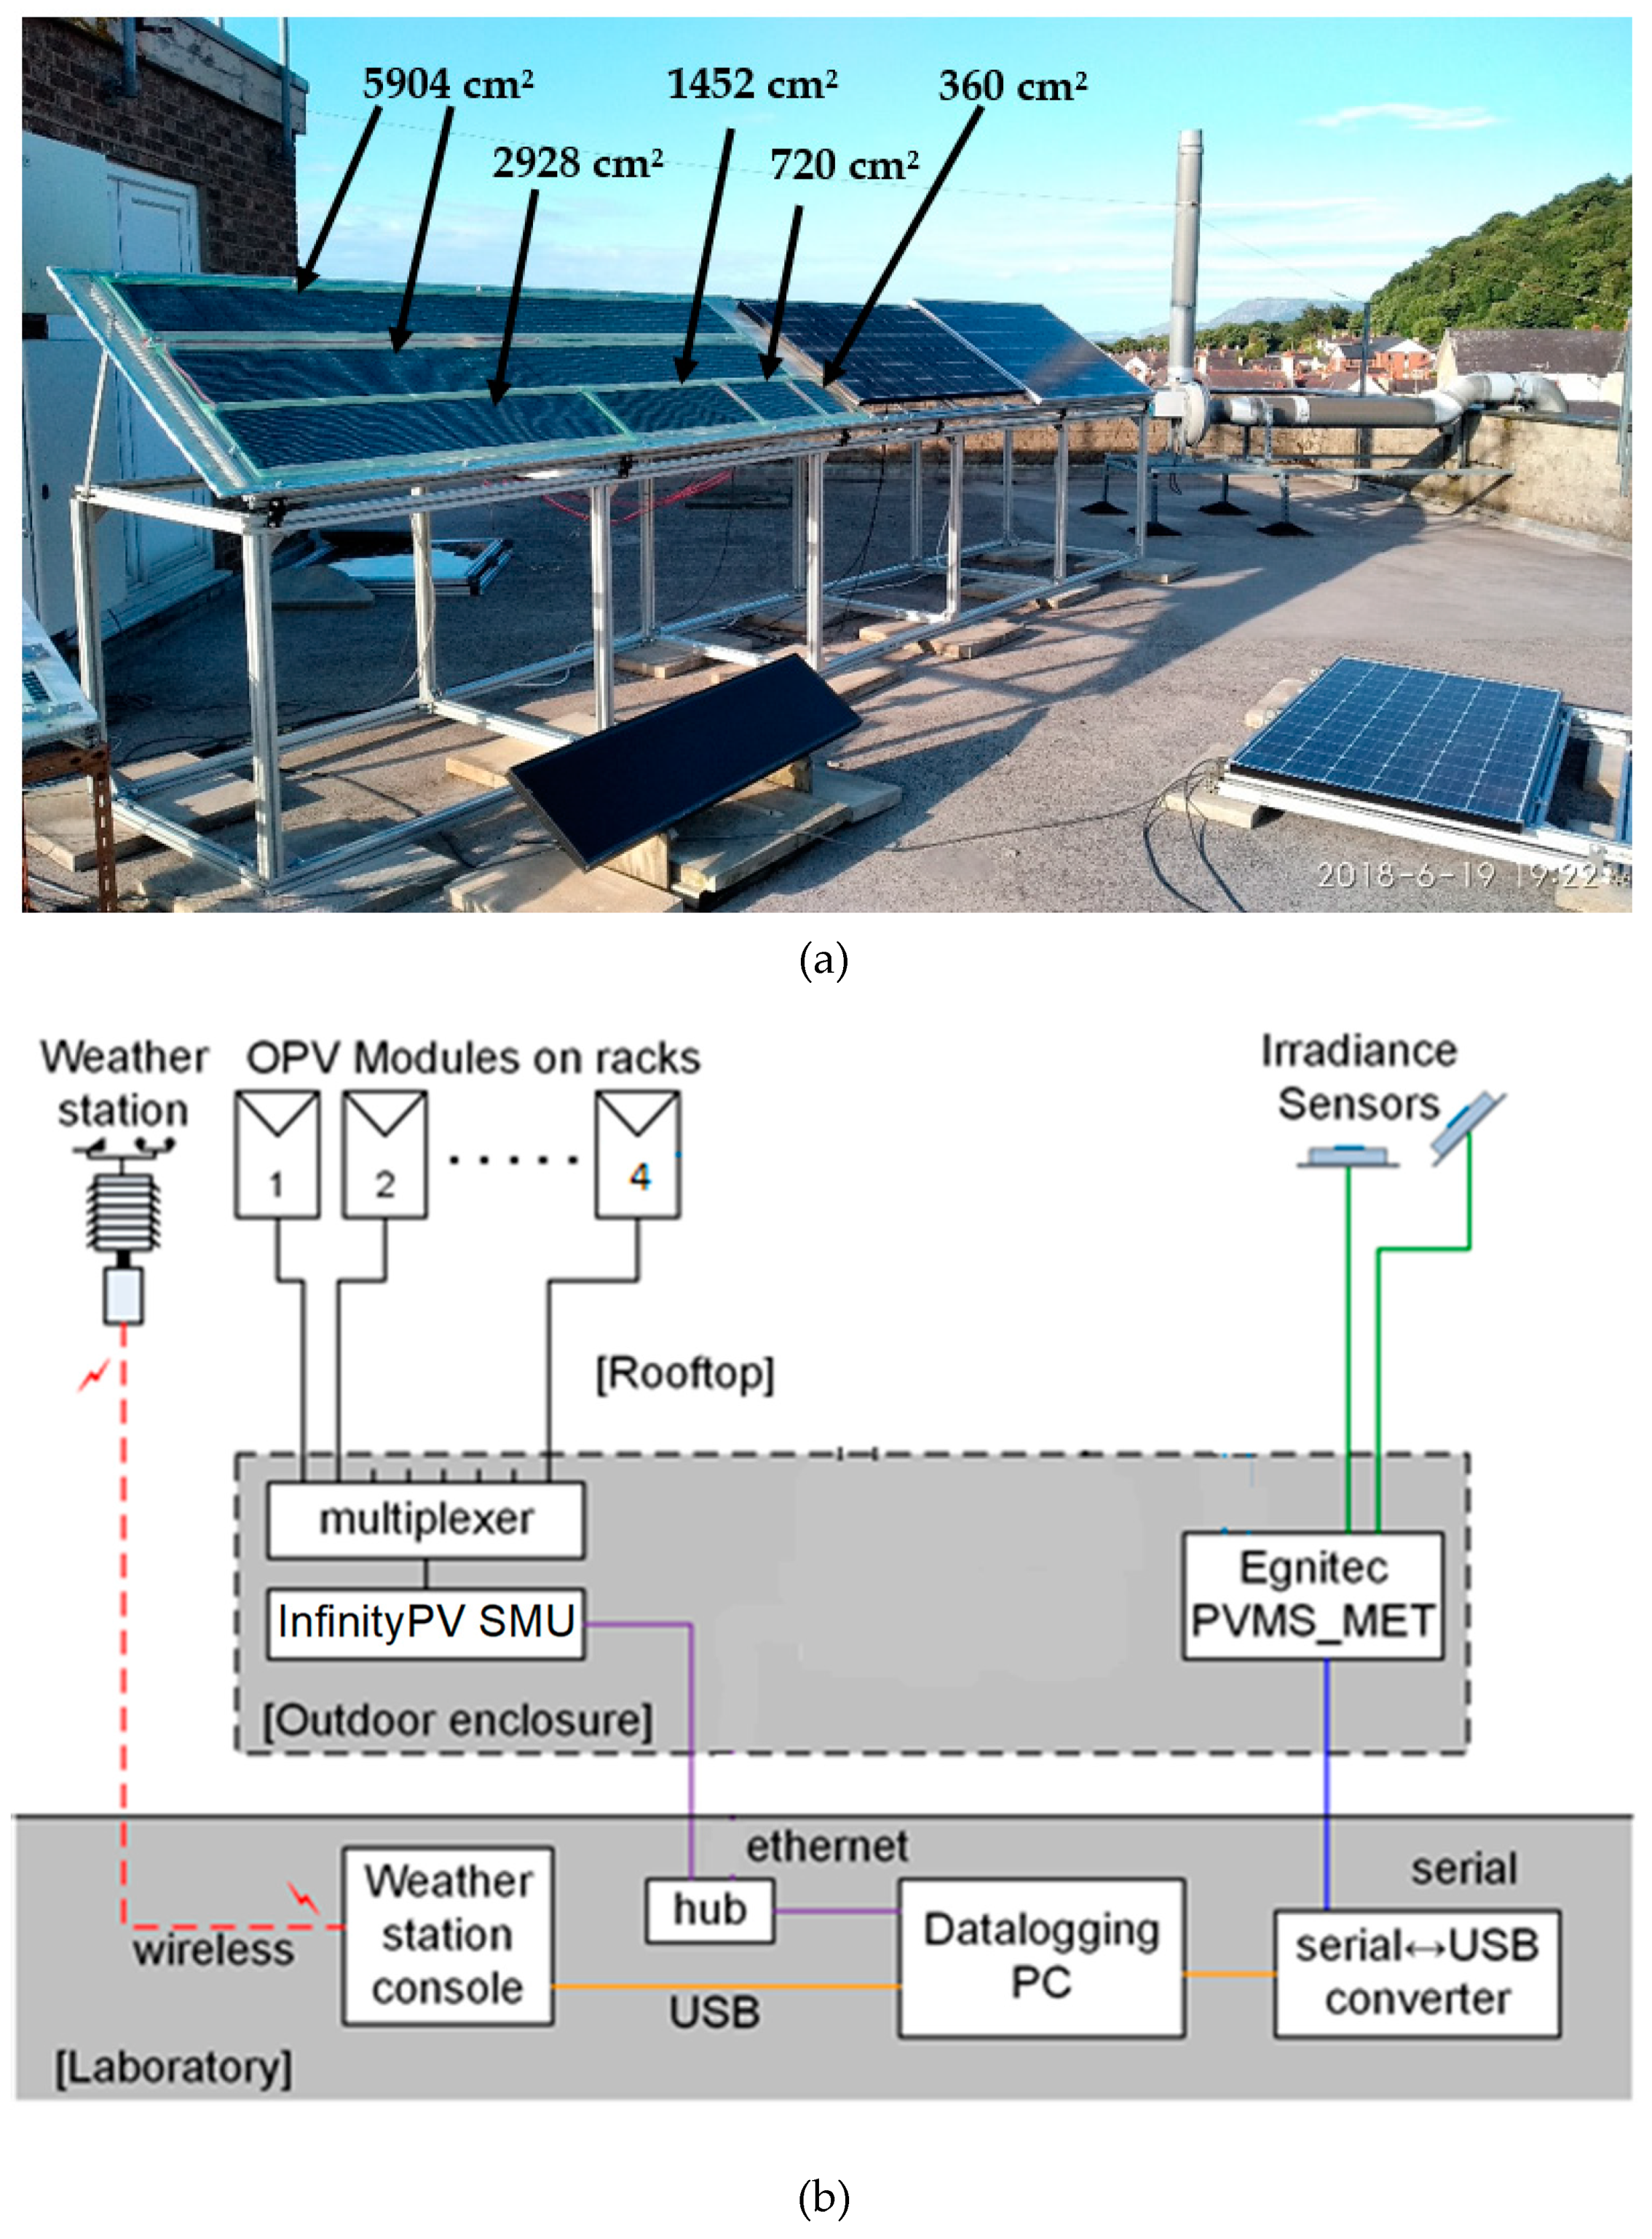
2. Materials and Methods

Three large area monolithically connected OPV modules were bonded onto rigid polycarbonate substrates and mounted at an inclination angle of 35° and orientated southwards. The edges of the flexible modules were sealed with pressure sensitive adhesive tape to minimise the effect of water infiltration. The modules were elevated to avoid shadowing effects. The modules were manufactured by InfintiyPV in Denmark and their active areas are 360 cm2, 2928 cm2 and 5904 cm2, respectively. Low resistance cables were soldered onto the contact points and were fed to an InfinityPV high voltage source measure unit (HV-SMU, 16-MUX). A schematic of the setup is given in Figure 1: a fourth module with Area 720 cm2 is shown here, but measurements from this module are not included in this paper because the module experienced a failure within two months of operation.
The performance of the modules was monitored with current-voltage (I-V) sweeps recorded at 10-min intervals. The irradiance levels were monitored using an Igenieurburo solar irradiance sensor (SiS-13TC). The weather conditions were monitored using a Davis Vantage Pro 2 weather station. Module panel temperature was not measured, but was calculated based on the ambient temperature, the irradiance and the Ross coefficient. The methods for obtaining the Ross coefficient and module temperature are described in [5].

3. Results

3.1. Diurnal Performance of Large Area OPVs

Analysis of the diurnal performance allowed the response of the modules to be tested over a wide range of irradiances from 0 W/cm2 (at night) up to around 1100 W/cm2 (which is the maximum for this geographic location). In Figure 2, it is evident that the OPV starts operating at sunrise and reaches a maximum value of 980 W/cm2. Figure 2 illustrates the variation in (a) power conversion efficiency (PCE), (b) short-circuit current density (JSC), (c) open circuit voltage (VOC) and (d) fill factor (FF) over the course of a sunny day with little or no cloud obstruction (5 August 2018). The irradiance curve for this day can be seen in Figure 2 e, with a peak irradiance of approximately 1000 W/m2 around 1:30 pm. There are some fluctuations as a result of partial clouding.
For all quantities monitored, the performance appears to be relatively stable, irrespective of module size. PCE, JSC and FF are relatively similar across all module sizes, with the only major variations being in VOC, due to the different number of cells connected in series within each module. It is quite surprising that the module performance is so similar; ordinarily one would expect the series resistance of large modules to moderately reduce the power output and energy yield, yet in this work, no discernible differences were noted. The PCE is seen to rise steadily over the course of the day: we explain this result with the moderately positive temperature coefficient in OPVs [6]. Slight fluctuations can be observed in JSC and these can be attributed to minor cloud shading, that explains the oscillations seen in the irradiance curve. The PCE displays significant enhancement in the early morning and late in the evening, correlating strongly with the FF. This suggests that the low irradiance levels experienced at these times result in an increase in the FF for all modules. Overall, the different modules show relatively similar PCE and characteristics irrespective of module sizes.

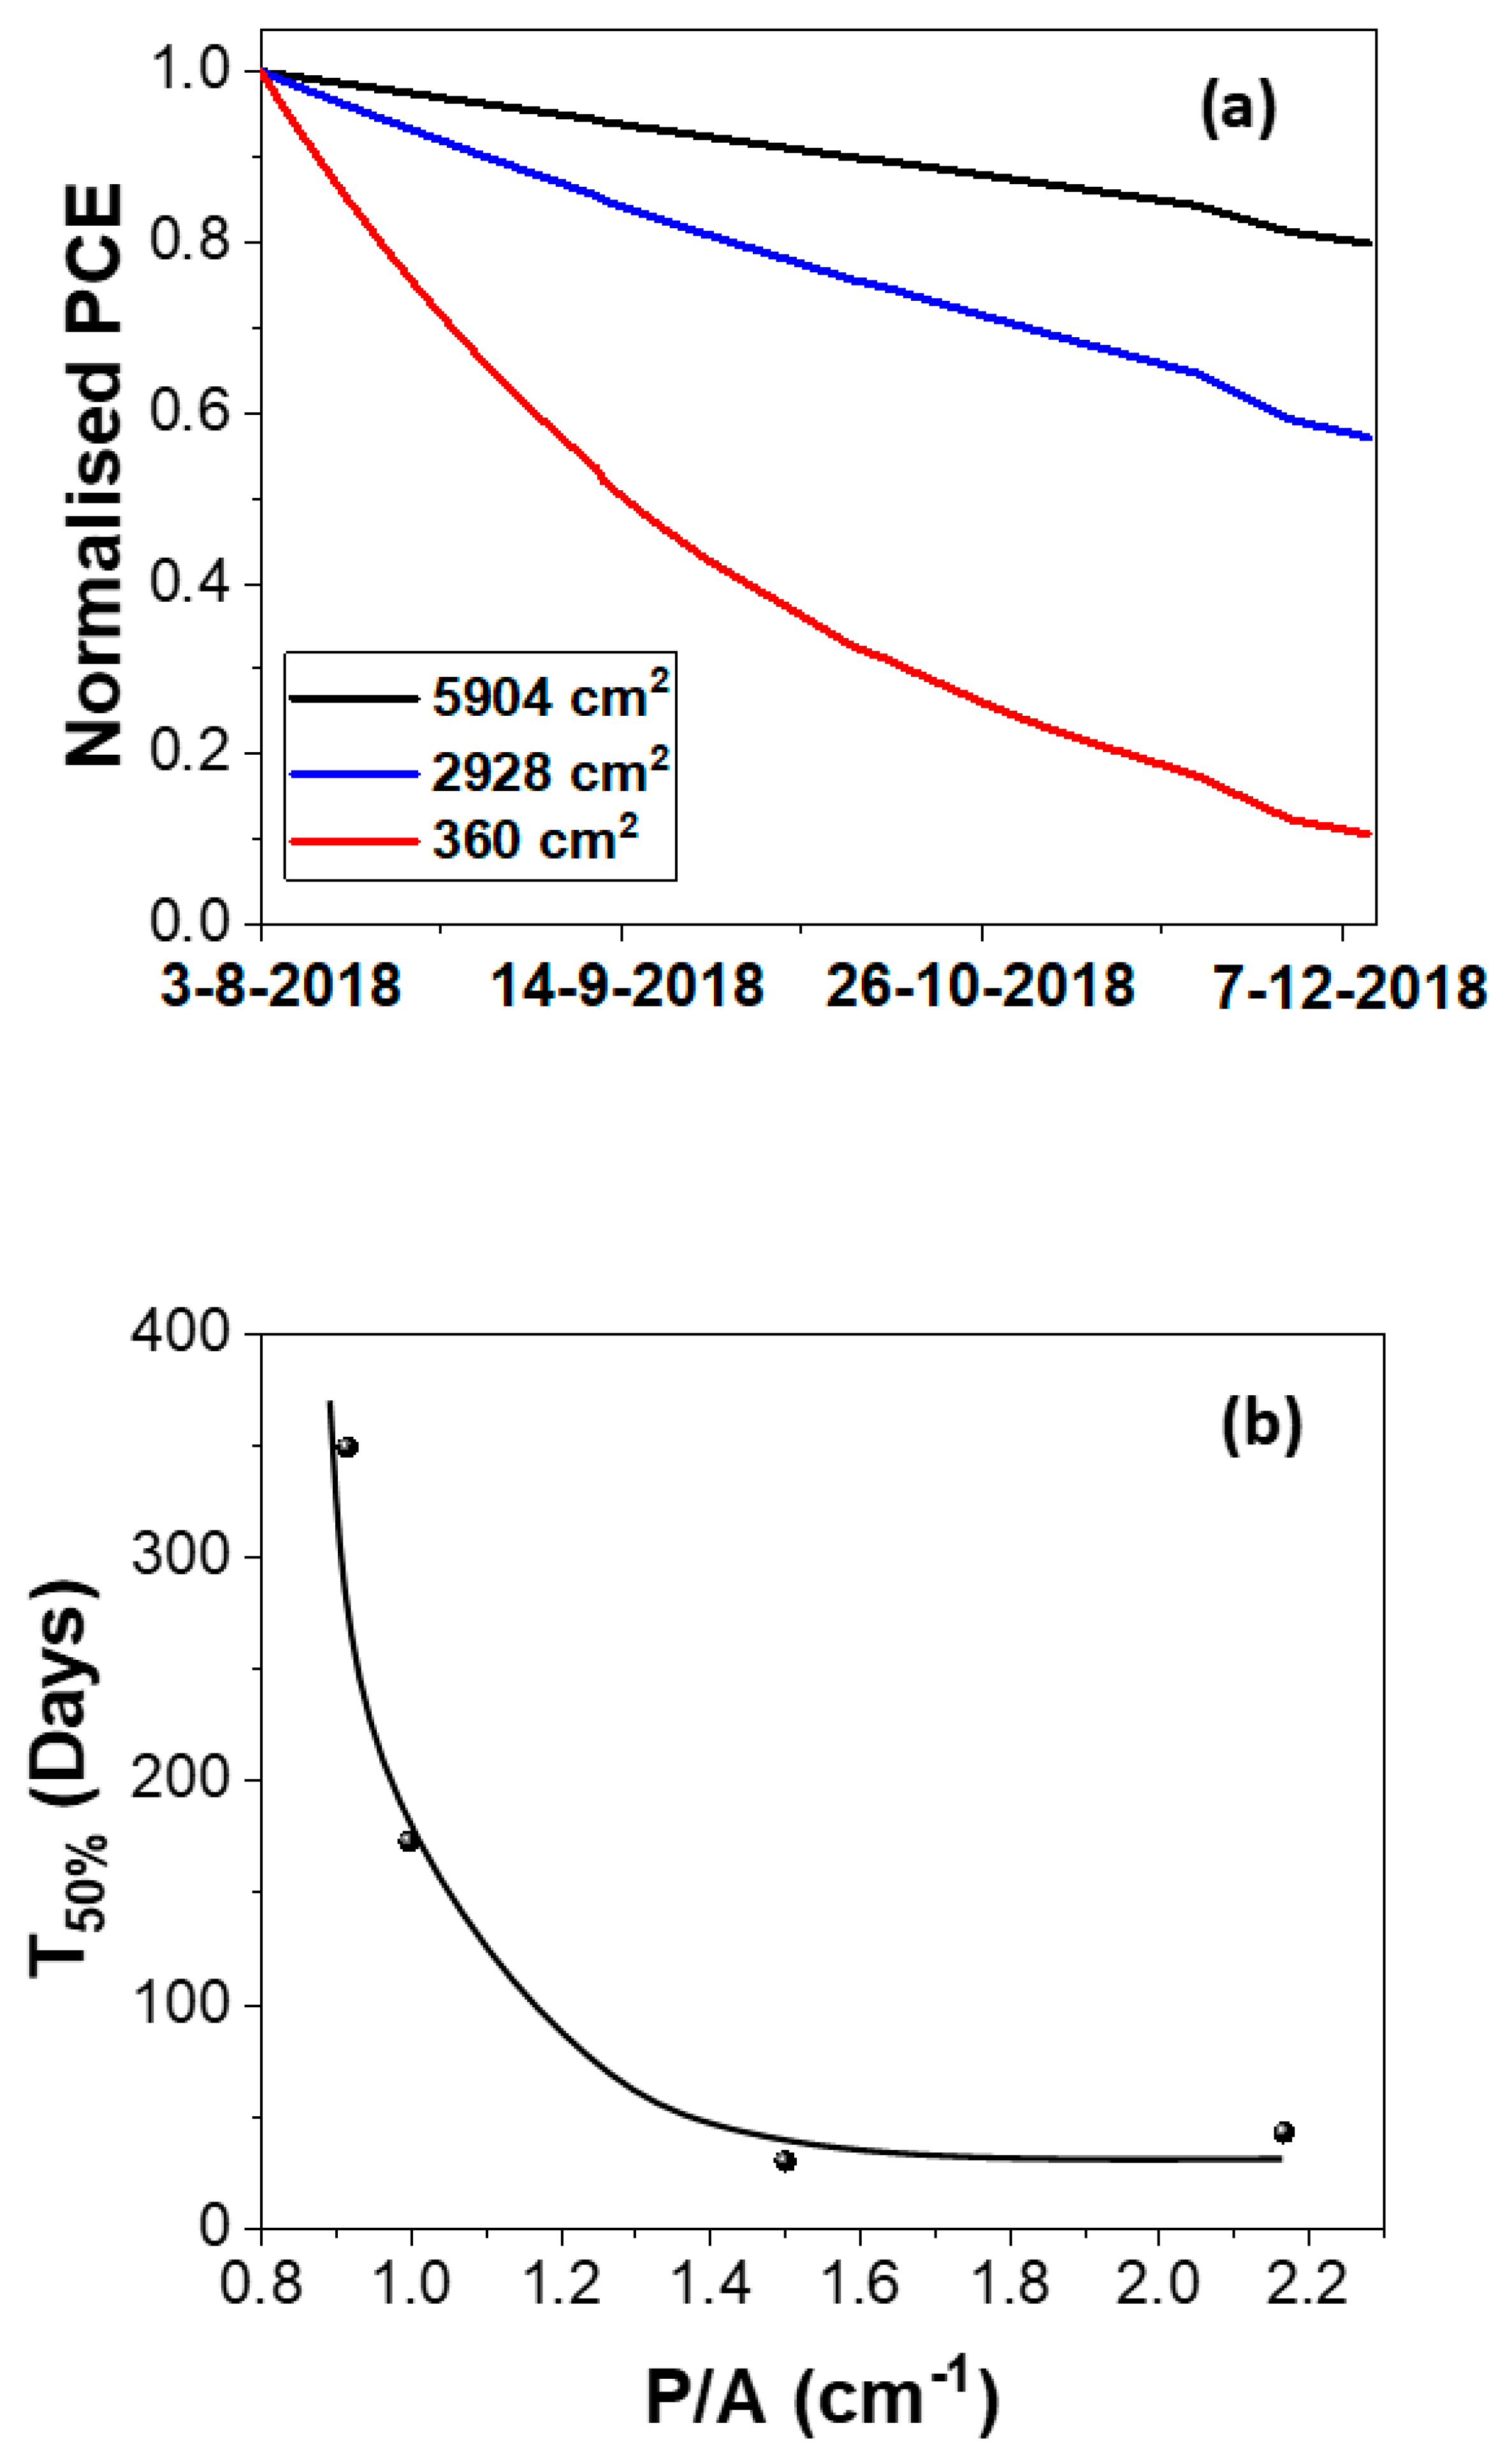
3.2. Stability of Large Area OPVs

In addition to the diurnal performances, degradation over the course of six months is monitored by tracking the PCE at a specific irradiance of 300 ± 10 Wm−2. This irradiance is selected to maximise the available data during both summer and winter months. Figure 3a illustrates the degradation curves for the modules between August 2018 and December 2018. The raw data is fitted using trend lines for clarity and to facililate the comparison between modules. The fastest rate of degradation is observed for the smallest area module, which began degrading from the outset of the testing period. The module with an area of 5904 cm2 is associated with a T50% (the time taken to reach 50% of the initial efficiency) of approximately five months, whereas the module with an area of 360 cm2 reaches T50% in only two months. On inspection, degradation was primarily due to water infiltration at the edges of the module, resulting in degradation of both the silver electrode grid and the solder bonds. Water and oxygen could then further infiltrate, ultimately leading to degradation of the OPV stack.
The faster rate of degradation of the smaller modules can probably be attributed to the varying perimeter to active area ratio (P/A). From our data, the OPV module appears to degrade at the edges by delamination first of all, leading to water and oxygen can ingress into the OPV module. This is likely to be greater than any ingress from the top and bottom surfaces as these are both coated in a barrier layer. Further studies are required to confirm this, but our visible inspection during these tests suggest this is likely. The P/A signifies how much of the active area can be reached by water infiltration through the perimeter of the module. Larger area modules possess a smaller P/A when compared to with smaller area modules. For the largest area module, the P/A is 0.91 cm−1 whilst for the smallest area module, the P/A is 2.2 cm−1. As water infiltration occurs along the perimeter, this phenomenon will lead to a faster rate of water infiltration for the smaller area devices. Figure 3b illustrates the variation in T50 lifetime plotted as a function of P/A for each module size. From this plot it is evident that larger area modules display higher T50% lifetimes as a result of a smaller P/A, most likely due to less exposure to water and oxygen infiltration.
Figure 4 shows images of the modules before and after degradation. Figure 4a illustrates the colour of the centre strip of the active material at the beginning of the test period and Figure 4b–e illustrate the state of each module at the end of the test period on 15/12/2018 (b = 5904 cm2, c = 2928 cm2, d = 720 cm2 and e = 360 cm2). The colour change in the active material of the modules can clearly be seen when comparing Figure 4a and Figure 4b–e. It was apparent that the edges of the OPV panel degraded initially. In the case of the large module, after around one month, the edges became frayed indicating a loss of adhesion at the edges of the module. The delamination became worse as time progressed. For the large module, degradation of the active layer occurred at delamination points, where photobleaching was evident. The colour gradation between Figure 4b–e can supports the hypothesis stated above, i.e., that there is greater degradation of the active material for the smaller area modules than for the larger area modules. Each image shows the cells at the centre of each module. The edges of the smallest module can also be observed in Figure 4e and the effect of contact tarnishing can be seen (illustrated by the arrow), further demonstrating the infiltration of water into the module through solder joints and contacts. With improved encapsulation and edge sealants, this could be dramatically reduced.

3.3. Computer Simulation

3.3.1. Model Description

The use of computer models is essential in power system design and in integration studies. Therefore, the acquired data was used to build a computer module that allows representing the OPV module characteristics measured in real world tests, and to forecast the effect of degradation on module performance. The diode approximation-based model is based upon earlier work conducted in [14] where a good match between the computer model and the experimental data from small modules was shown. The computer model is therefore adopted in this work to quantify the performance and degradation of large area OPV modules.
The equivalent circuit of the OPV modules is shown in Figure 5: it includes a current source I p h , a diode I D , a shunt resistor R s h and a series resistor R s . The PV output current is represented by I p v . The equations that describe the model are as follows [14,15]:
I p h = [ I s c + I s c R s R s h + k i ( T c T r e f ) S S r e f ]
I D = I o [ ( e q ( V p v + I p v R s ) n k N s T c ) 1 ]
I o = I s c e q V o c n k N s T c 1
I s h = V p v + I p v R s R s h
I p v = I p h I D I s h
I p v = I s c + k i ( T c T r e f ) S S r e f I o [ ( e q ( V p v + I p v R s ) n k N s T c ) 1 ] V p v + ( I p v I s c ) R s R s h
where I p h is the PV material generated current; I s c is the short circuit current at the reference temperature; k i is the temperature coefficient of the photon current; T c is the actual PV module temperature; T r e f is the reference PV module temperature; S is the actual PV module irradiance; S r e f is the reference PV module irradiance; I D is the diode current; I o is the reverse saturation current; q is the electron charge; V o c is the open circuit voltage; V p v is the terminal voltage; n is the junction ideality factor; k is the Boltzmann constant; N s is the number of cells in series per module; I s h is the current flowing through the shunt resistance.
The model shown in Figure 5 was built in MATLAB/Simulink. The model is build using parameters that can be adjusted in order to represent various modules and technologies. Screenshots of the computer model are shown in [14].

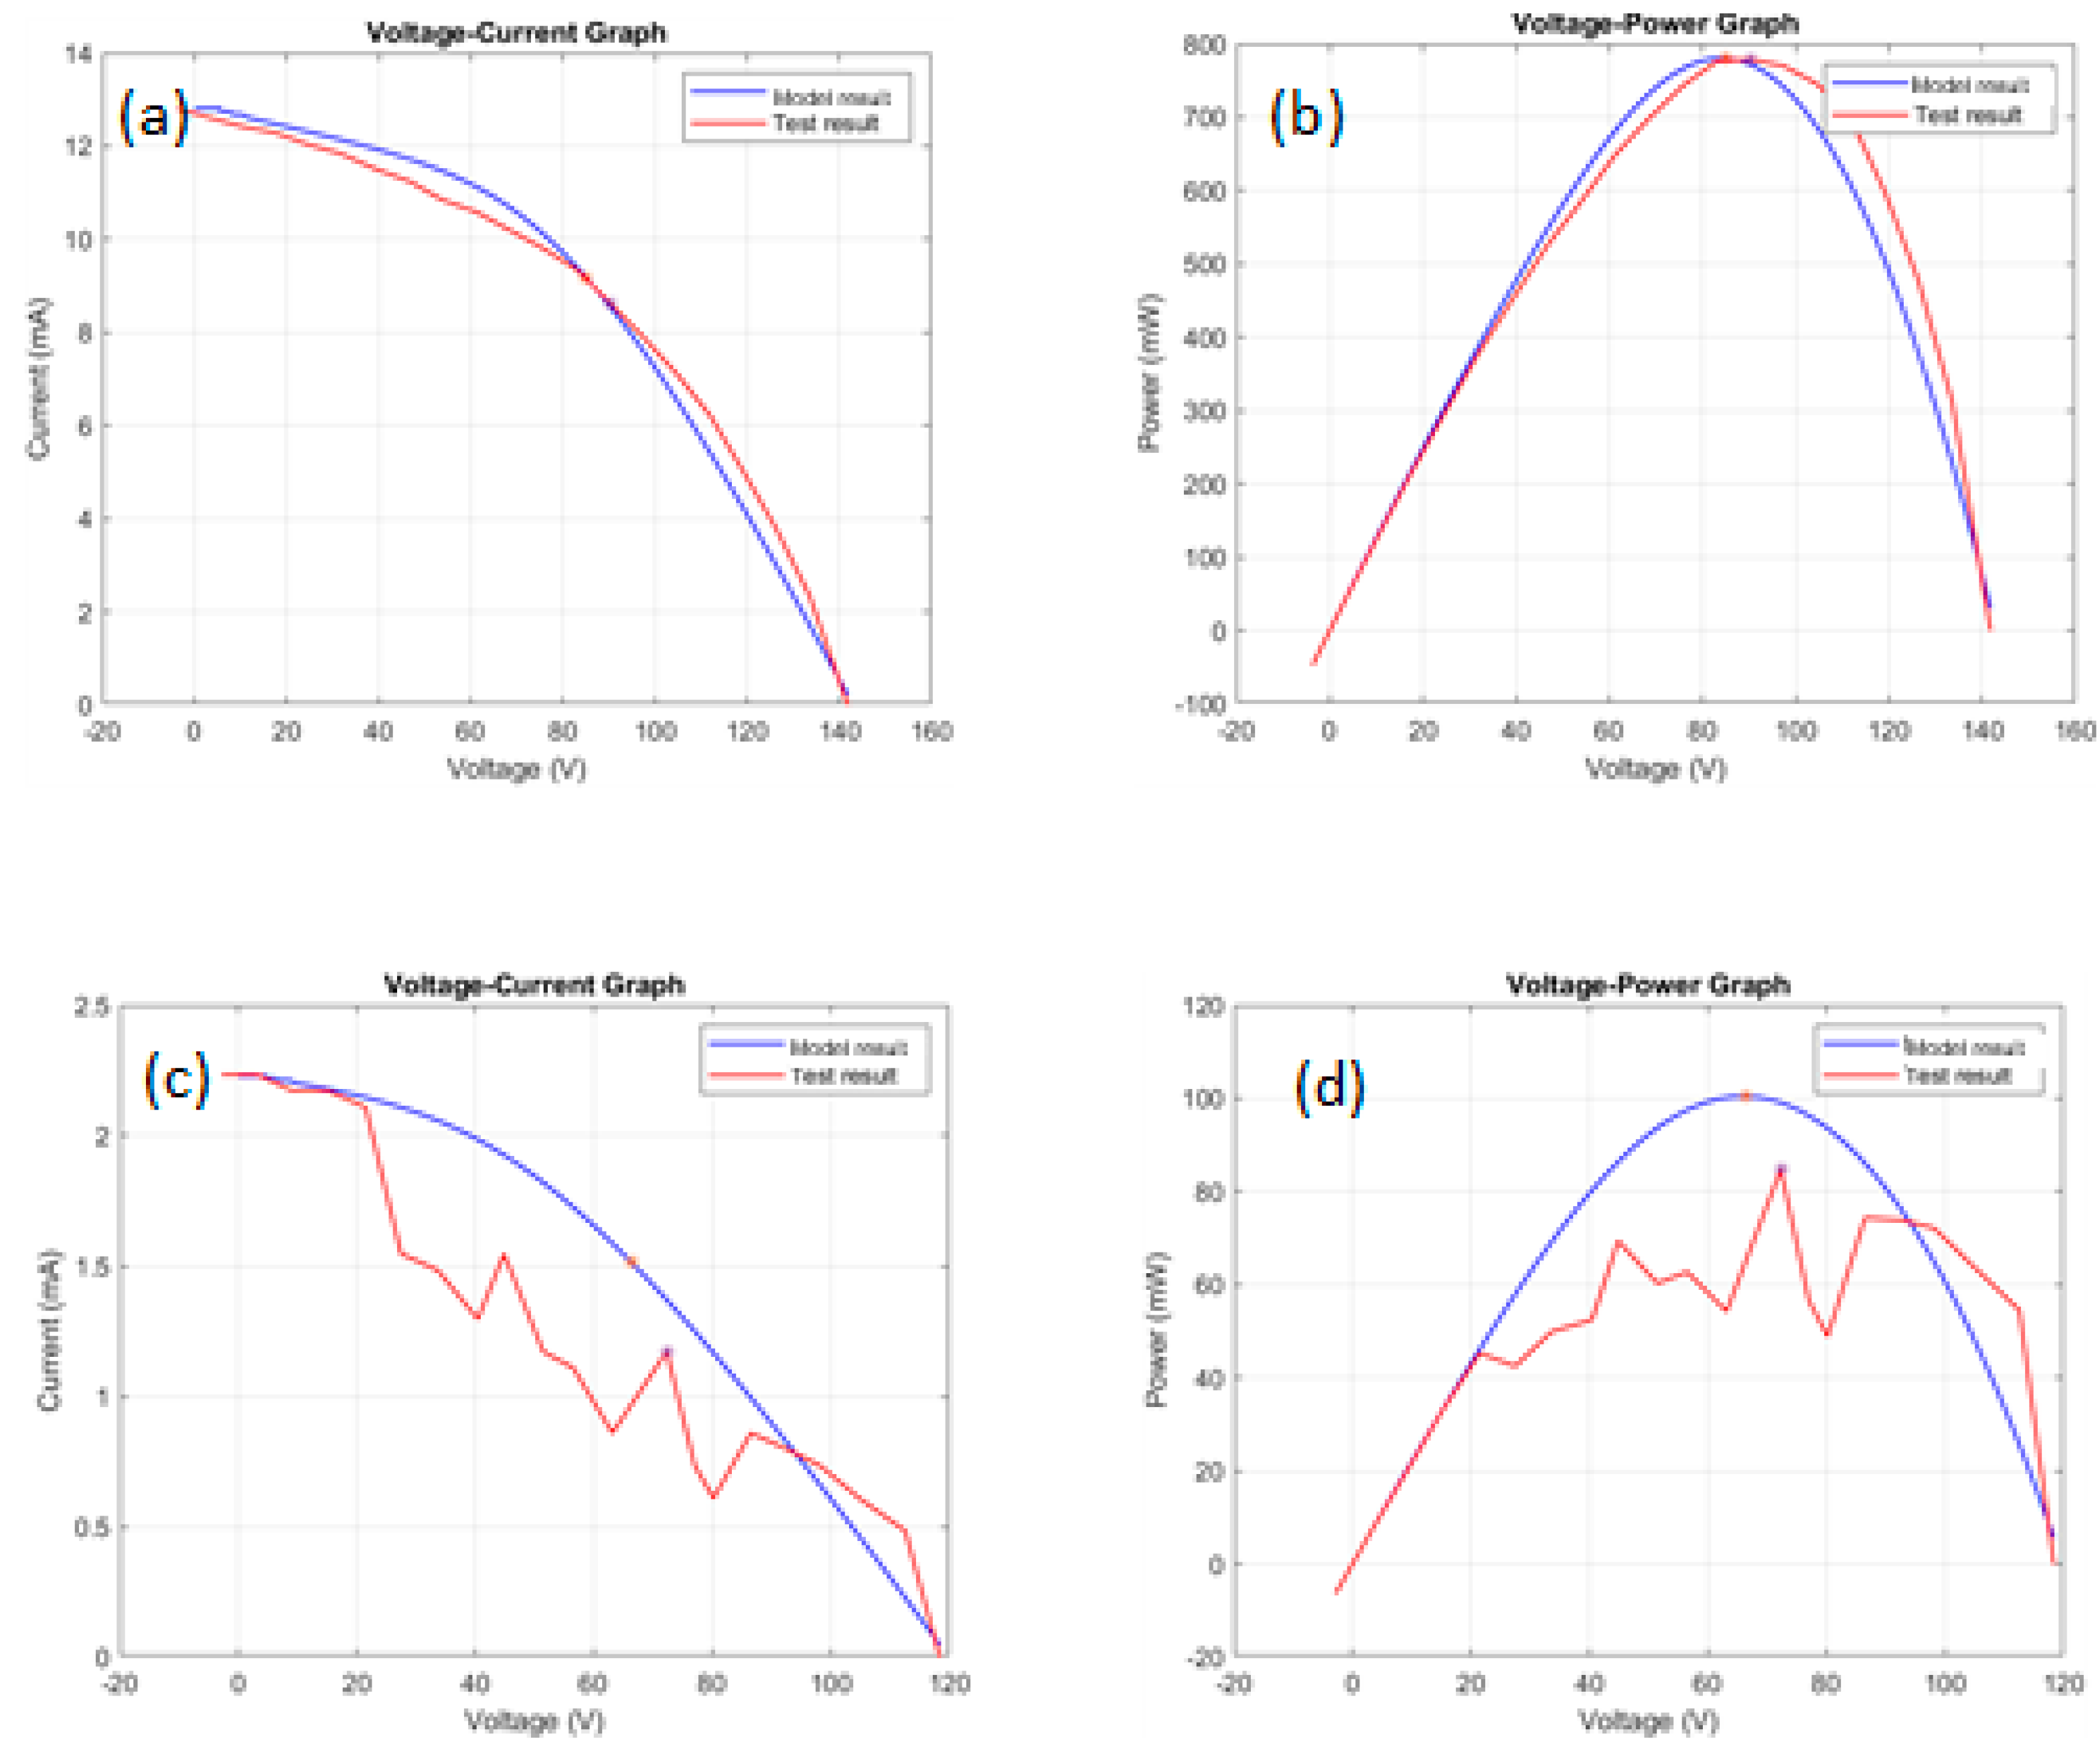
3.3.2. Comparison between Measurements and Computer Simulation Result

The outdoor measurement results of 5904 cm2, 2928 cm2 and 360 cm2 modules are compared with the simulation results obtained from the computer model described in Section 3.3.1. Figure 6, Figure 7 and Figure 8 show the I-V and P-V curves of each module. For all figures, the solar irradiance is set as 300 Wm−2: (a) and (b) indicate the results referring to August 2018, (c) and (d) refer to results in October or November 2018. These two days were chosen because they illustrate well the effect of degradation across several months. The irradiance levels on both days were similar, allowing for like for like comparison. The degradation of the modules is modelled by considering the variation in the values of the series resistance and parallel resistance which were obtained as fitting parameters for the model. Currently, the values for these parameters are calculated from the measurement results. When more test data becomes available, it will be possible to forecast degradation for various OPV technologies by adjusting the series resistance and parallel resistance.
The open circuit voltage decreases from approximately 300 V to 140 V and 12 V with smaller module sizes (from 5904 cm2 to 2928 cm2 and 360 cm2), as shown in Figure 6, Figure 7 and Figure 8. The simulated results match the measurements quite well for all three modules in August, but the difference between experimental results and model are evident for the October and November dataset. In Figure 6, the maximum power error between simulation and test results is 2.66% on 24 August but increases to 7.93% on 29 October (5904 cm2 module); in Figure 7, the error increases from 0.22% to 18.57% from 3 August to 29 October (2928 cm2 module); in Figure 8, the errors are 1.36% on 28 August and 5.80% on 8 November (360 cm2 module). All measurement result curves show oscillations for data collected in October or November, which means the modules degraded. However, the 5904 cm2 module I-V and P-V curves are still quite stable when compared to the other two modules, hence it is the least affected.
Figure 9 compares the maximum power errors between simulation results and measurements. It is evident that the error between simulation/experimental of the three modules are all below 10% in August, but the 2928 cm2 and 360 cm2 module errors increase sharply from late October. The figure also shows that the 5904 cm2 error fluctuates the least while the 360 cm2 fluctuates the most, which means a larger sized module can generate more stable results.

4. Conclusions

Large area OPV modules with areas 5904 cm2, 2928 cm2 and 360 cm2 have been tested in outdoor conditions. During the outdoor test, the I-V characteristics and the irradiance have been monitored. A significant variation in power output has been observed in OPVs with their performance drastically affected by the irradiance.
In addition, the degradation of the OPV modules was monitored via I-V scanning in outdoor conditions over the course of five months. Larger area modules were found to be more stable in outdoor conditions. For example, the largest tested module had a T50% lifetime of 191 days whilst the smallest area module has a T50% lifetime of only 57 days. This extension in the lifetime for larger area modules has been attributed to the slower rate of water and oxygen infiltration due to a smaller P/A ratio.
A computer model has been used to replicate the behaviour observed above: the tests carried out above shows that the computer model allows quantifying OPV module degradation by means of specific parameters and allows representing the degradation of these cells within a computer simulation.

Author Contributions

Conceptualization, G.T. and J.K.; experimental work and methodology, T.W.D., V.S., N.B.; software, H.H.; writing T.W.D. All authors have read and agreed to the published version of the manuscript.

Funding

T.W.D., N.B., H.H., G.T. and J.K. acknowledge the support by the Solar Photovoltaic Academic Research Consortium II (SPARC II) project, gratefully funded by WEFO. We would like to thank the PEARL PV COST Action, supported by COST (European Cooperation in Science and Technology, CA1625).

Institutional Review Board Statement

Not applicable.

Informed Consent Statement

Not applicable.

Data Availability Statement

The data that support the findings of this study are available from the corresponding author upon reasonable request.

Conflicts of Interest

The authors declare no conflict of interest.

References

  1. Grossiord, N.; Kroon, J.M.; Andriessen, R.; Blom, P.W. Degradation mechanisms in organic photovoltaic devices. Org. Electron. 2012, 13, 432–456. [Google Scholar] [CrossRef] [Green Version]
  2. Gevorgyan, S.A.; Heckler, I.M.; Bundgaard, E.; Corazza, M.; Hösel, M.; Søndergaard, R.R.; Benatto, G.A.D.R.; Jørgensen, M.; Krebs, F.C. Improving, characterizing and predicting the lifetime of organic photovoltaics. J. Phys. D Appl. Phys. 2017, 50, 103001. [Google Scholar] [CrossRef] [Green Version]
  3. Stoichkov, V.; Kumar, D.; Tyagi, P.; Kettle, J. Multistress Testing of OPV Modules for Accurate Predictive Aging and Reliability Predictions. IEEE J. Photovolt. 2018, 8, 1058–1065. [Google Scholar] [CrossRef] [Green Version]
  4. Silverman, T.J.; Deceglie, M.G.; Sun, X.; Garris, R.L.; Alam, M.A.; Deline, C.; Kurtz, S. Thermal and Electrical Effects of Partial Shade in Monolithic Thin-Film Photovoltaic Modules. IEEE J. Photovolt. 2015, 5, 1742–1747. [Google Scholar] [CrossRef]
  5. Bristow, N.; Kettle, J. Outdoor organic photovoltaic module characteristics: Benchmarking against other PV technologies for performance, calculation of Ross coefficient and outdoor stability monitoring. Sol. Energy Mater. Sol. Cells 2018, 175, 52–59. [Google Scholar] [CrossRef] [Green Version]
  6. Bristow, N.; Kettle, J. Outdoor performance of organic photovoltaics: Diurnal analysis, dependence on temperature, irradiance, and degradation. J. Renew. Sustain. Energy 2015, 7, 013111. [Google Scholar] [CrossRef]
  7. Krebs, F.C.; Tromholt, T.; Jørgensen, M. Upscaling of polymer solar cell fabrication using full roll-to-roll processing. Nanoscale 2010, 2, 873–886. [Google Scholar] [CrossRef] [PubMed]
  8. Chemisana, D.; Moreno, A.; Polo, M.; Aranda, C.; Riverola, A.; Ortega, E.; Lamnatou, C.; Domènech, A.; Blanco, G.; Cot, A. Performance and stability of semitransparent OPVs for building integration: A benchmarking analysis. Renew. Energy 2019, 137, 177–188. [Google Scholar] [CrossRef] [Green Version]
  9. Manor, A.; Katz, E.A.; Tromholt, T.; Hirsch, B.; Krebs, F.C. Origin of size effect on efficiency of organic photovoltaics. J. Appl. Phys. 2011, 109, 74508. [Google Scholar] [CrossRef] [Green Version]
  10. Liao, C.-Y.; Chen, Y.; Lee, C.-C.; Wang, G.; Teng, N.-W.; Lee, C.-H.; Li, W.-L.; Chen, Y.-K.; Li, C.-H.; Ho, H.-L.; et al. Processing Strategies for an Organic Photovoltaic Module with over 10% Efficiency. Joule 2020, 4, 189–206. [Google Scholar] [CrossRef]
  11. Hong, S.; Kang, H.; Kim, G.; Lee, S.; Kim, S.; Lee, J.H.; Lee, J.; Yi, M.; Kim, J.; Back, H.; et al. A series connection architecture for large-area organic photovoltaic modules with a 7.5% module efficiency. Nat. Commun. 2016, 7, 10279. [Google Scholar] [CrossRef] [PubMed]
  12. Zhang, T.; Zeng, G.; Ye, F.; Zhao, X.; Yang, X. Efficient Non-Fullerene Organic Photovoltaic Modules Incorporating As-Cast and Thickness-Insensitive Photoactive Layers. Adv. Energy Mater. 2018, 8, 1801387. [Google Scholar]
  13. Mori, S.; Oh-Oka, H.; Nakao, H.; Gotanda, T.; Nakano, Y.; Jung, H.; Iida, A.; Hayase, R.; Shida, N.; Saito, M.; et al. Organic photovoltaic module development with inverted device structure. MRS Online Proc. Libr. 2014, 1737, 26–31. [Google Scholar] [CrossRef]
  14. Todeschini, G.; Huang, H.; Bristow, N.; David, T.W.; Kettle, J. A Novel Computational Model for Organic PV Cells and Modules. Int. J. Smart Grid 2020, 4, 157–163. [Google Scholar]
  15. Dhass, A.D.; Natarajan, E.; Ponnusamy, L. Influence of shunt resistance on the performance of solar photovoltaic cell. In Proceedings of the 2012 International Conference on Emerging Trends in Electrical Engineering and Energy Management (ICETEEEM), Chennai, India, 13–15 December 2012; pp. 382–386. [Google Scholar]
Figure 1. (a) Image of mounted OPV modules positioned due South at the School of Electronic Engineering, Bangor University and (b) a schematic of the experimental setup.
Energies 14 06324 g001
Figure 2. Diurnal variation in solar module parameters (a) PCE, (b) JSC, (c) VOC, (d) FF and (e) irradiance variation over the course of a sunny day with peak irradiance of approximately 1 Sun for OPVs with three differing module sizes on the 5 August 2018.
Energies 14 06324 g002
Figure 3. (a) Degradation curves of modules tested outdoors over the course of 4 months at a fixed irradiance of 300 ± 10 Wm−2; fitted degradation trend lines shown, and (b) variation in time to reach 50% of the original efficiency (T50% lifetime) as a function of the Perimeter-to-area ratio (P/A) ratio.
Energies 14 06324 g003
Figure 4. (a) Active material at beginning of test period. (b) 5904 cm2 module, (c) 2928 cm2 module, (d) 720 cm2 module and (e) 360 cm2 modules after test period. Images taken at centre of each module.
Energies 14 06324 g004
Figure 5. Equivalent circuit of the PV cell used to validate the experimental results.
Energies 14 06324 g005
Figure 6. (a) I-V curve and (b) P-V curve comparisons of 5904 cm2 module tested on 24 August 2018; (c) I-V curve and (d) P-V curve comparisons of 5904 cm2 module tested on 29 October 2018. The maximum power point in each I-V/P-V waveform is highlighted as red or purple point, respectively.
Energies 14 06324 g006
Figure 7. (a) I-V curve and (b) P-V curve comparisons of 2928 cm2 module tested on 3 August 2018; (c) I-V curve and (d) P-V curve comparisons of 2928 cm2 module tested on 29 October 2018. The maximum power point in each I-V/P-V waveform is highlighted as red or purple point, respectively.
Energies 14 06324 g007
Figure 8. (a) I-V curve and (b) P-V curve comparisons of 360 cm2 module tested on 28 August 2018; (c) I-V curve and (d) P-V curve comparisons of 360 cm2 module tested on 8 November 2018. The maximum power point in each I-V/P-V waveform is highlighted as red or purple point, respectively.
Energies 14 06324 g008
Figure 9. Maximum power errors between simulation results and measurements.
Energies 14 06324 g009
Publisher’s Note: MDPI stays neutral with regard to jurisdictional claims in published maps and institutional affiliations.

