Assessing the Dynamic Performance of Thermochemical Storage Materials
by
 , and
, and
Sara Walsh
, 
Jack Reynolds
,
Bahaa Abbas
, 
Rachel Woods
,
Justin Searle
,
Eifion Jewell
and
Jonathon Elvins
* Specific IKC, Baglan Bay Innovation Centre, Swansea University, Central Avenue, Port Talbot SA12 7AX, UK
*
Author to whom correspondence should be addressed.
Energies 2020, 13(9), 2202; https://doi.org/10.3390/en13092202
Submission received: 31 March 2020
/
Revised: 15 April 2020
/
Accepted: 22 April 2020
/
Published: 2 May 2020
(This article belongs to the Special Issue Hybrid Storage Technologies in Solar Energy Based Smart Cities)
Abstract
:Thermochemical storage provides a volumetric and cost-efficient means of collecting energy from solar/waste heat in order to utilize it for space heating in another location. Equally important to the storage density, the dynamic thermal response dictates the power available which is critical to meet the varied demands of a practical space heating application. Using a laboratory scale reactor (127 cm3), an experimental study with salt in matrix (SIM) materials found that the reactor power response is primarily governed by the flow rate of moist air through the reactor and that creating salt with a higher salt fraction had minimal impact on the thermal response. The flowrate dictates the power profile of the reactor with an optimum value which balances moisture reactant delivery and reaction rate on the SIM. A mixed particle size produced the highest power (22 W) and peak thermal uplift (32 °C). A narrow particle range reduced the peak power and peak temperature as a result of lower packing densities of the SIM in the reactor. The scaled maximum power density which could be achieved is >150 kW/m3, but achieving this would require optimization of the solid–moist air interactions.
1. Introduction
Heating constitutes almost 50% of the UK energy consumption [1,2] and accounts for a quarter of all greenhouse production [3]. Continued reductions in CO2 emissions must therefore be addressed through the energy requirement of buildings, particularly the mismatch between summer and winter and day and night availability of solar energy and the demand requirements which are greatest when solar input is low. Thermochemical storage provides a convenient means by which this mismatch could be overcome and there has been significant research effort to develop suitable materials and systems. A thermochemical storage unit, utilizing either direct solar thermal energy or excess photovoltaic electrical power as a heat source, would allow the direct heating of the air to a within the building through a conventional air distribution. It could also serve to pre-warm air into an air source heat pump.
There are many options for thermochemical storage [4,5,6,7], with the hydration of salts being one of the leading contenders. A number of salts have been investigated, including MgCl2 [8], MgSO4 [9], LiNO3 [10] and SrBr2 [11], with the primary considerations being hydration/dehydration temperature range, enthalpy of formation of the hydrated state, rate of hydration as well as other practical issues such as safety, cost and ease of handling [5]. One attractive material is CaCl2 [10,12,13], which benefits from being low cost, applicable to low temperature thermal charging and readily reacting with moisture in the air to release energy. As a result, it has been widely examined in the literature. In hydrating from the dihydrate state to the hexahydrate state, 1204 kJ/mol are released [12]. Reported assessments of the storage density of CaCl2 varied considerably, from those which were based on simple scaled fundamental chemical properties at 2.8 GJ/m3 [13] (778 kWh/m3), to measured values 1.85 GJ/m3 (583 kWh/m3) [14] to (508.33 kWh/m3) [13] and 1.12 GJ/m3 (350 kWh/m3) [12], 0.65 GJ/m3 (205 kWh/m3) [15]. In each instance, there was a reduction in the real storage densities from those quoted from simple scaling of analytical laboratory results.
If thermal storage is to be the sole provider of heat in a building, then its dynamic performance (particularly from an “off” to “on” state) is critical to its deployment [16]. Intermittent occupation demands a fast response as inhabitants arrive at the building. While storage density is an important factor, the dynamic performance of the heating system is equally important where activity, outside temperature and occupancy vary [16,17,18]. Thus, as well as the storage density, any engineering thermodynamic characterization needs to consider the maximum power output since it is this dynamic response of any stored thermal energy system which is a key factor which determines suitability [19]. This requires consideration of the material, operational envelope and reactor design [20,21]. The primary parameter which is relevant to the dynamic response is the temperature rise which can be obtained within a short period of time and this in turn is related to the power and power density (kW/m3). There is a dearth of information on the dynamic discharge response of thermochemical systems, although it will be critical to understand operational practices, uptake and consumer acceptance.
The aim of this investigation is to study the impact of energy storage material properties and reactor operation on the dynamic power response of a thermal storage unit with particular reference to the specification and performance of the system. This will provide a unique data set for the heat power output of such a system.
The strategy deployed utilized a laboratory scale (127 g) thermal reactor filled with salt in matrix (SIM) (CaCl2/vermiculite) where the salt concentration, air flow rate and particle size were varied in order to investigate the material and operational parameters on reactor performance. This allowed operational limits and best practice to be identified and also developed insight into the fundamental mass and heat transfer mechanisms occurring during the discharge cycle.
2. Materials and Methods
The vermiculite was sourced commercially from a supplier to the horticultural industry and was characterized in terms of particle diameter and the internal volume by water absorption to be 7.2 mL/g. The CaCl2 was purchased from Sigma Aldrich in its dehydrated state and saturated solutions were made at 20 °C. The SIM materials were manufactured using the insipient wetness method [22], where a fixed volume (defined by the salt: vermiculite ratio) of CaCl2 saturated solution is sprayed in an interrupted fashion at 10 min intervals onto a fixed quantity of vermiculite and gently stirred. The interval between additions allows for absorption onto the vermiculite lamellae. The process is repeated until all the solution has been absorbed into the vermiculite. Batches of 500 g of dry vermiculite laid on 300 × 300 tray were found to provide the correct balance between maintaining SIM evenness and limiting damage to the wet SIM from excessive stirring.
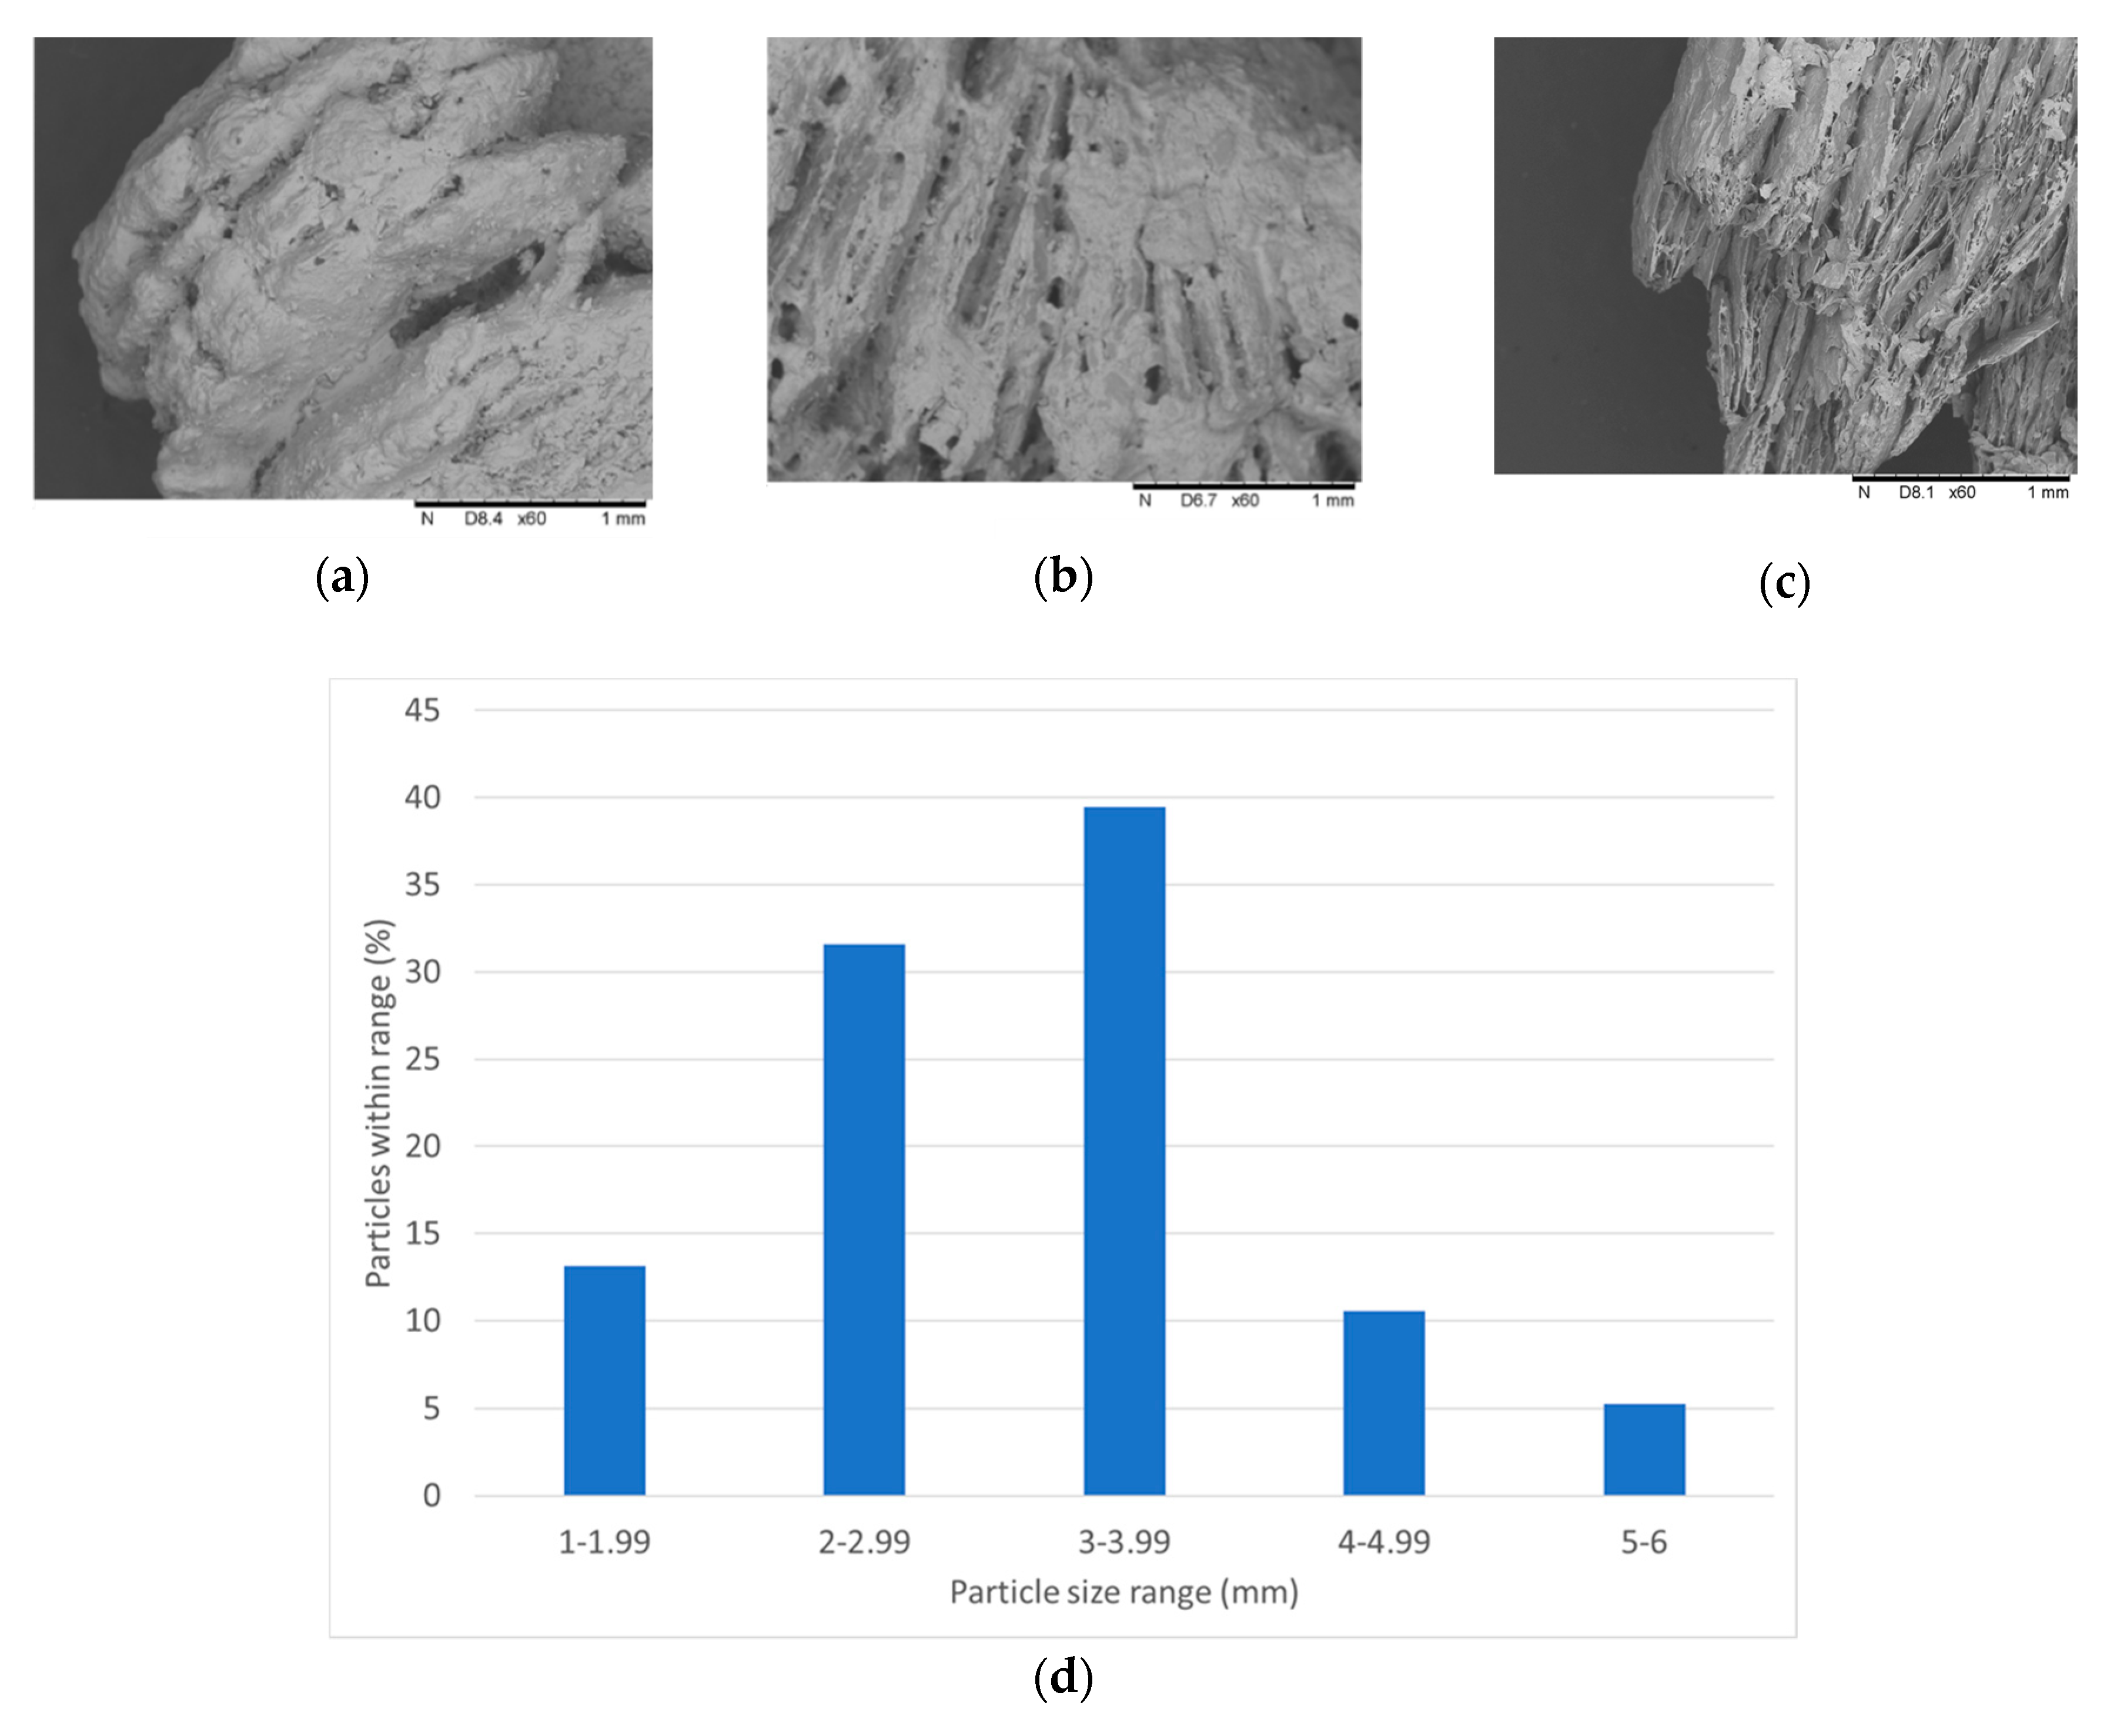
The SIM was then dried at 120 °C for 24 h to ensure that the material was dry and at the dehydrate state. The resultant dry SIM material at three salt to vermiculite ratios are shown in Figure 1a–c. The presence of the additional salt on the SIM is clear with the 3:1 (a) vermiculite particles being wholly encrusted with salt on the inner and outer surfaces with inter lamella regions being entirely filled with salt. With the 1:1 SIM, the salt is seen sparingly at the inter lamella regions. The 2:1 ratio SIM has surface salt and the majority of the lamella remain open. Particles were not initially sieved and observed to be of SIM particle sizes between 1 and 6 mm with a distribution as shown in Figure 1d.
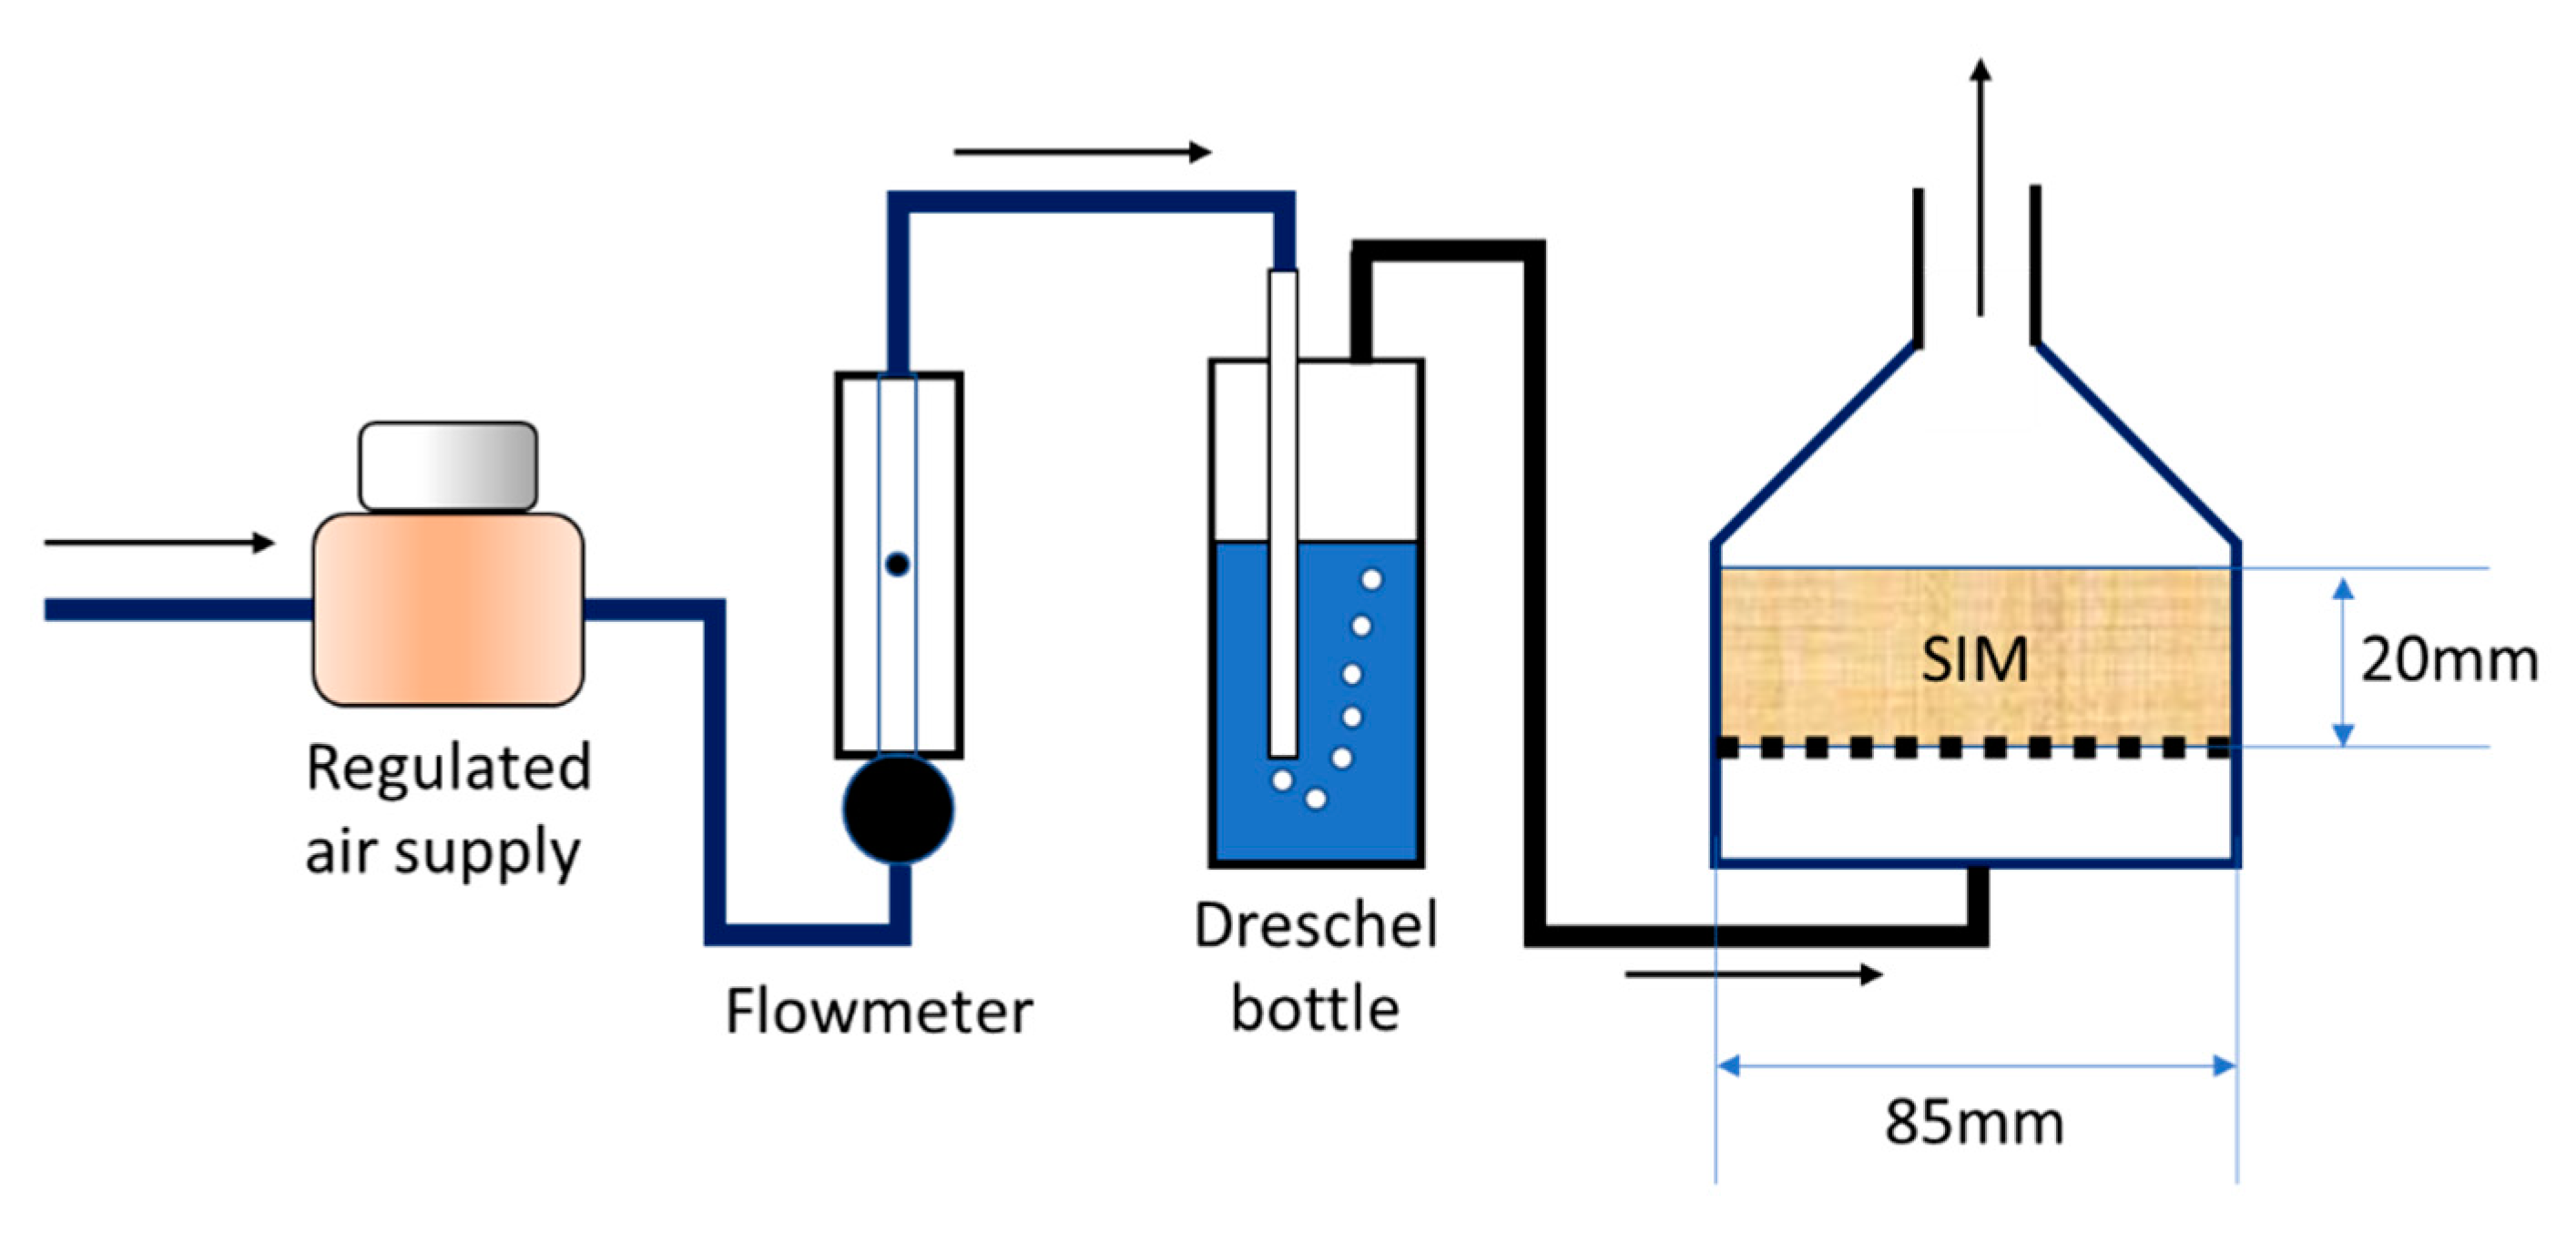
Moist air was generated by passing dry compressed air through a Dreschel bottle via a flowmeter, and this was passed directly to the base of the reactor containing the SIM—a schematic is shown in Figure 2. This allowed a consistent input air moisture level of 17 g/m3. The flow rate of the moist air is referred to in litres per minute (L/min), and represents additional water input of 0.08 to 0.67 g/min of water for the 5 to 40 L/min range. The absolute humidity level was held constant at a high enough level to produce a reaction rate but beneath a level where condensation would occur within the reactor which would promote deliquescence and provide erroneous moisture absorption results. During the experimental rig commissioning, it was found that the moisture level in the air entering the reactor could be controlled within +/− 0.5 g/m3 provided the Dreschel bottle water depth was maintained above 150 mm.
The reactor consisted of an 85 mm diameter acrylic dish fitted with a permeable mesh 10 mm above the point of entry of the moist air. A fixed volume of SIM was added above the permeable base to a depth of 20 mm (the equivalent of ~30 g for the 2:1 CaCl2:VM SIM). A depth of 20 mm was chosen as this provided sufficient material to provide a measurable thermal uplift while minimizing the impact of variations in reactions which had been observed in larger volumes [23]. Virgin SIM was used for all experiments in order to eliminate degradation which can occur during previous discharge [24]. The temperature was measured at the entrance and exit using type K thermocouples while the air moisture content was measured using a TE-HPP805C031 RH sensor. Data from all sensors were logged at 1 second intervals. A full factorial approach was initially taken with SIM at CaCl2:VM ratios of 1:1, 2:1 and 3:1 being subjected to flowrates of 5, 10, 20, 30 and 40 L/min. Upon analysis of the results, further investigations of particle size were conducted with the 2:1 CaCl2:VM material. Each experiment was repeated 3 times and the mean results were reported. The measured temperatures of the repeated tests were found on average to be within +/− 0.5 °C when operating with the reference material and +/− 1 °C when particle size was varied. The increased variability was associated with the hand sampling of sizes.
3. Results and Discussion
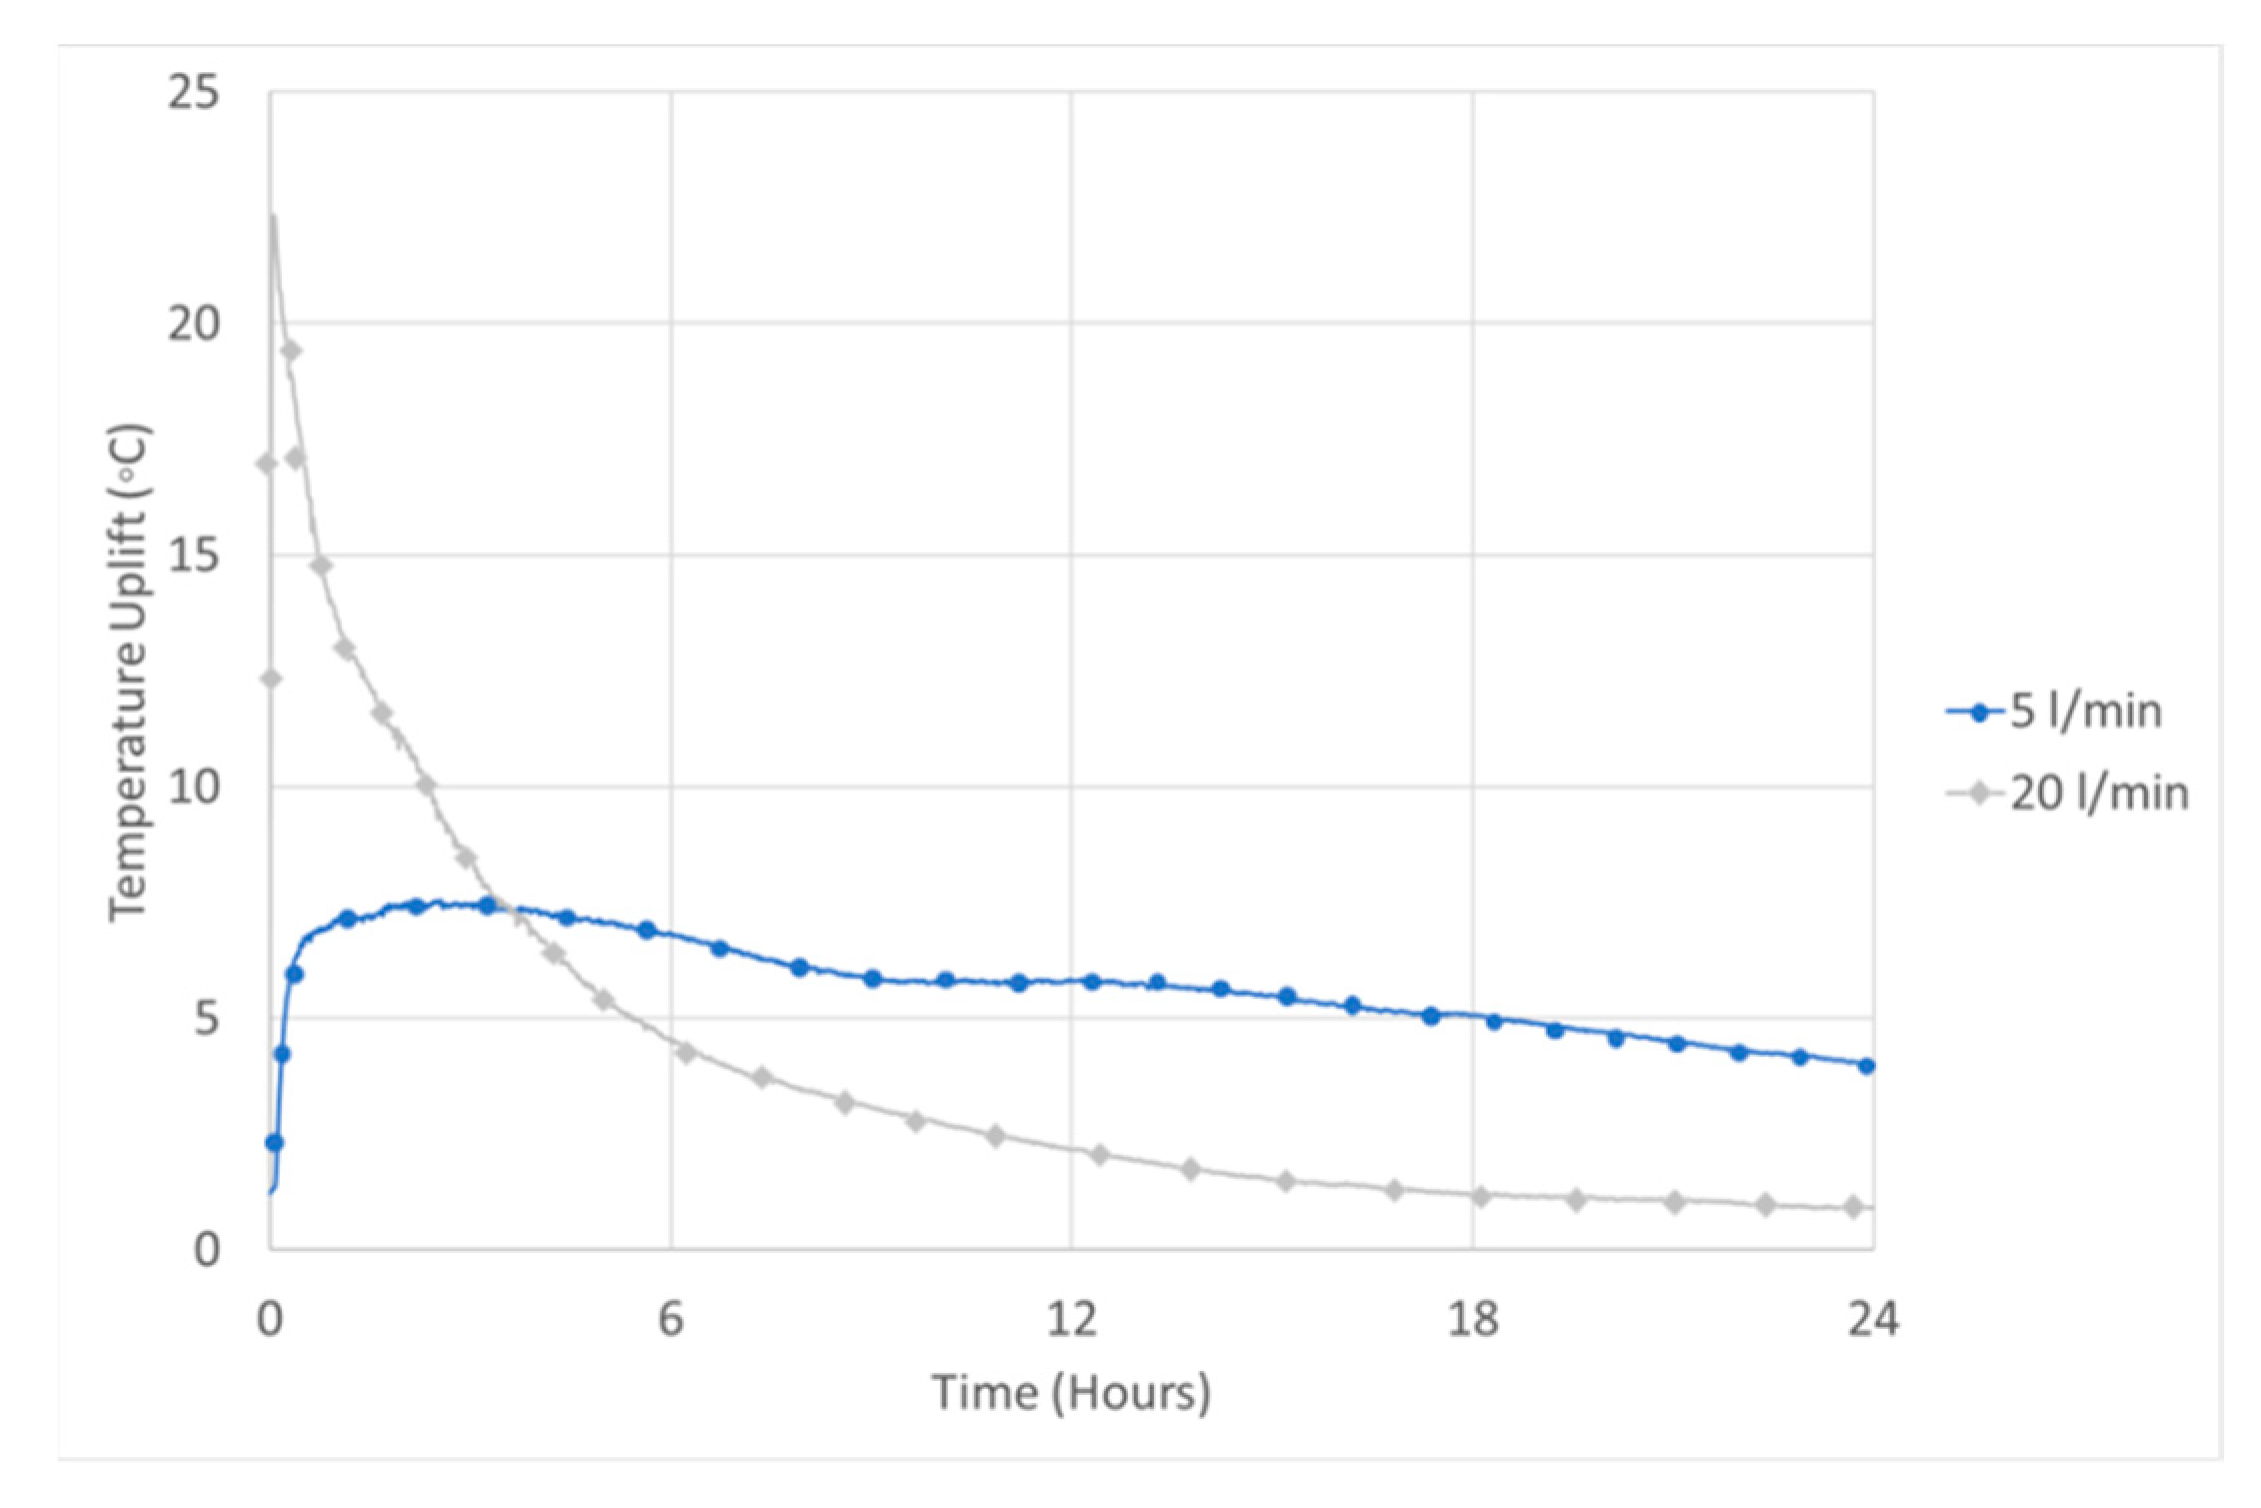
Typical reactor exit temperature profiles over an extended discharge period follow one of two characteristics. Under higher flow rates (20 L/min), there is rapid temperature increase of greater than 20 °C within 10 min of exposure to the moist air. This is followed by a slow exponential reduction in temperature to a lower temperature uplift which is less than 2 °C within 13 h (Figure 3). At a lower flow rate the response is more gradual over the first hour and settles at a level where a modest temperature rise of around 8 °C is obtained, which gradually reduces with time. Over the 24-h experimental duration, the total energy evolved during the 20 L/min experimentation is 136 kJ (~298 kWh/m3) compared with 51 kJ (~111 kWh/m3) for the 5 L/min experiment. This highlights that by varying the rate of delivery of moist air into the materials, there is potential for both short term, rapid thermal uplift or a longer term, supplementary background heating. At 5 L/min, there is still a temperature uplift visible at the end of the 24 h period, indicating that the reaction is still occurring; however, extending the reaction time to attempt a direct comparison is problematic due to the heat losses and gain over such a time frame and small delta T involved. Therefore, experiments have been time fixed and the power output used for comparison.
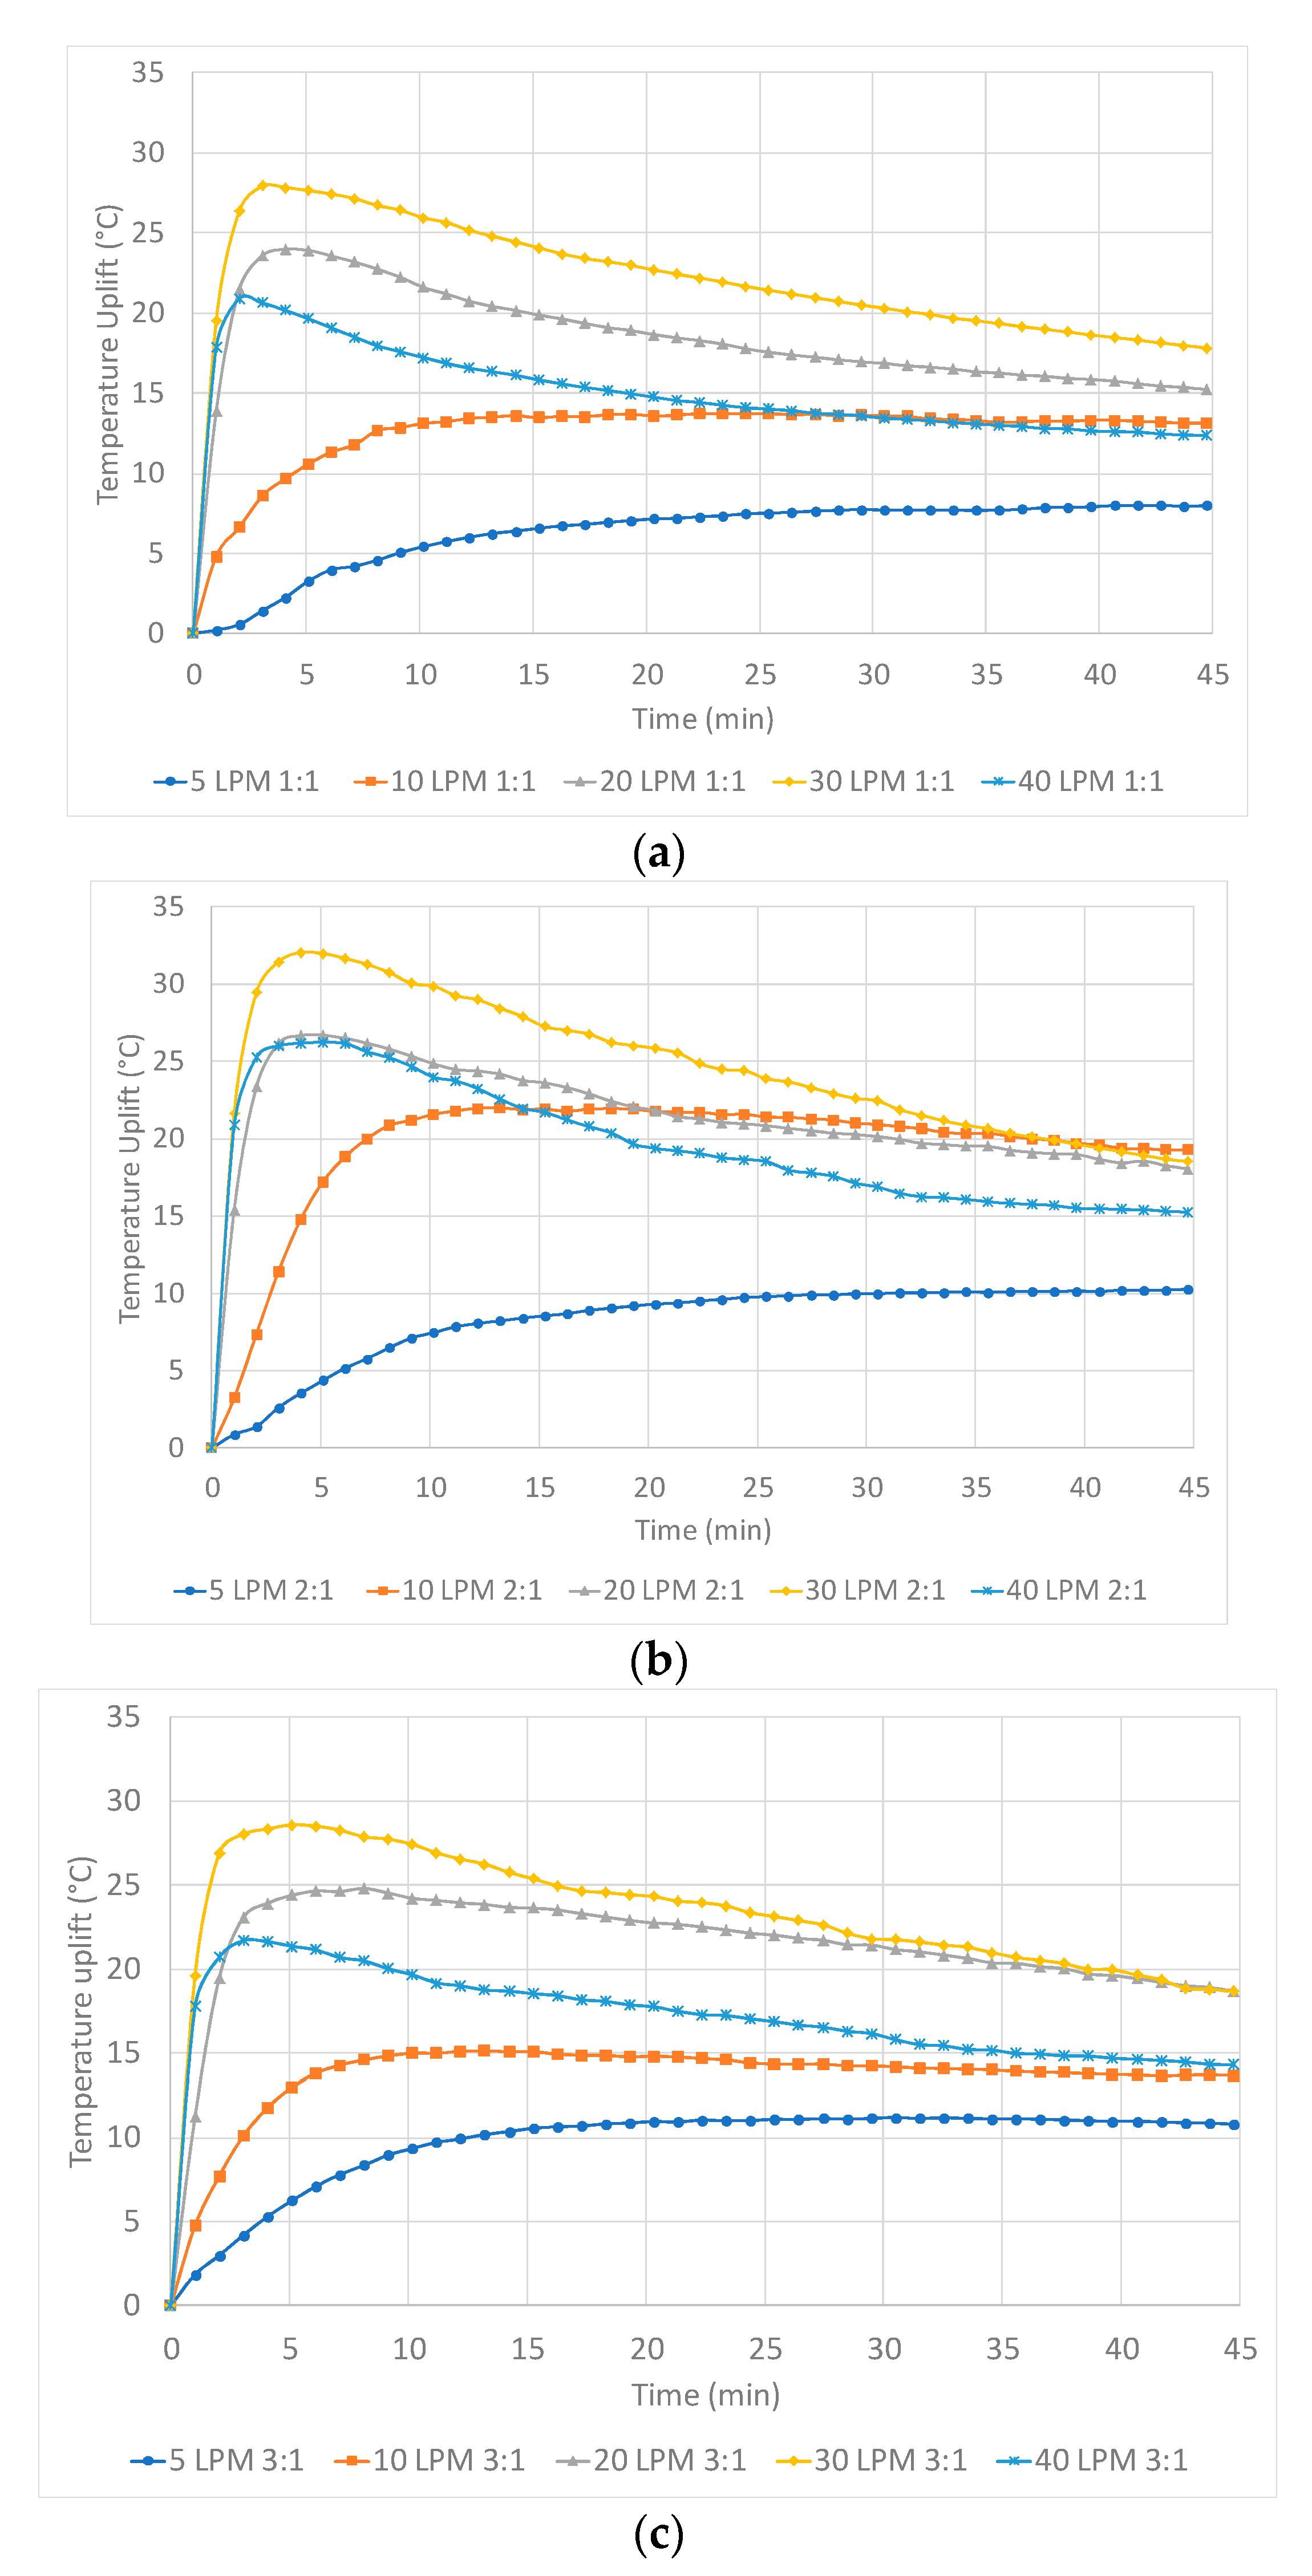
It is possible to examine the power characteristics of the reactor by examining the dynamic response during the initial 45 min of the discharge. The response follows a similar pattern, irrespective of the quantity in the salt in the SIM (Figure 4). At an optimized flow rate and salt concentration, temperature uplifts of 32 °C are obtained within 3 min (30 L/min @ 2:1 CaCl2:VM ratio). At higher flow rates, the rate of temperature uplift is initially rapid, reaches a peak within 5 min and then reduces gradually over the next hour. At the highest flowrate, the peak temperature reduces and the rate of temperature loss following the peak is faster. At lower flow rates (5 and 10 L/min) the evolution of temperature lift is initially more gradual and plateaus during the latter experimental stages. The strong relationship between the flow rate and temperature profile follows the same pattern for each of the CaCl2:VM ratios, although the absolute temperature uplift profile and peak temperature reached differs in each instance. The impact of CaCl2:VM ratio is secondary with similar peak temperatures being obtained with each CaCl2:VM ratio.
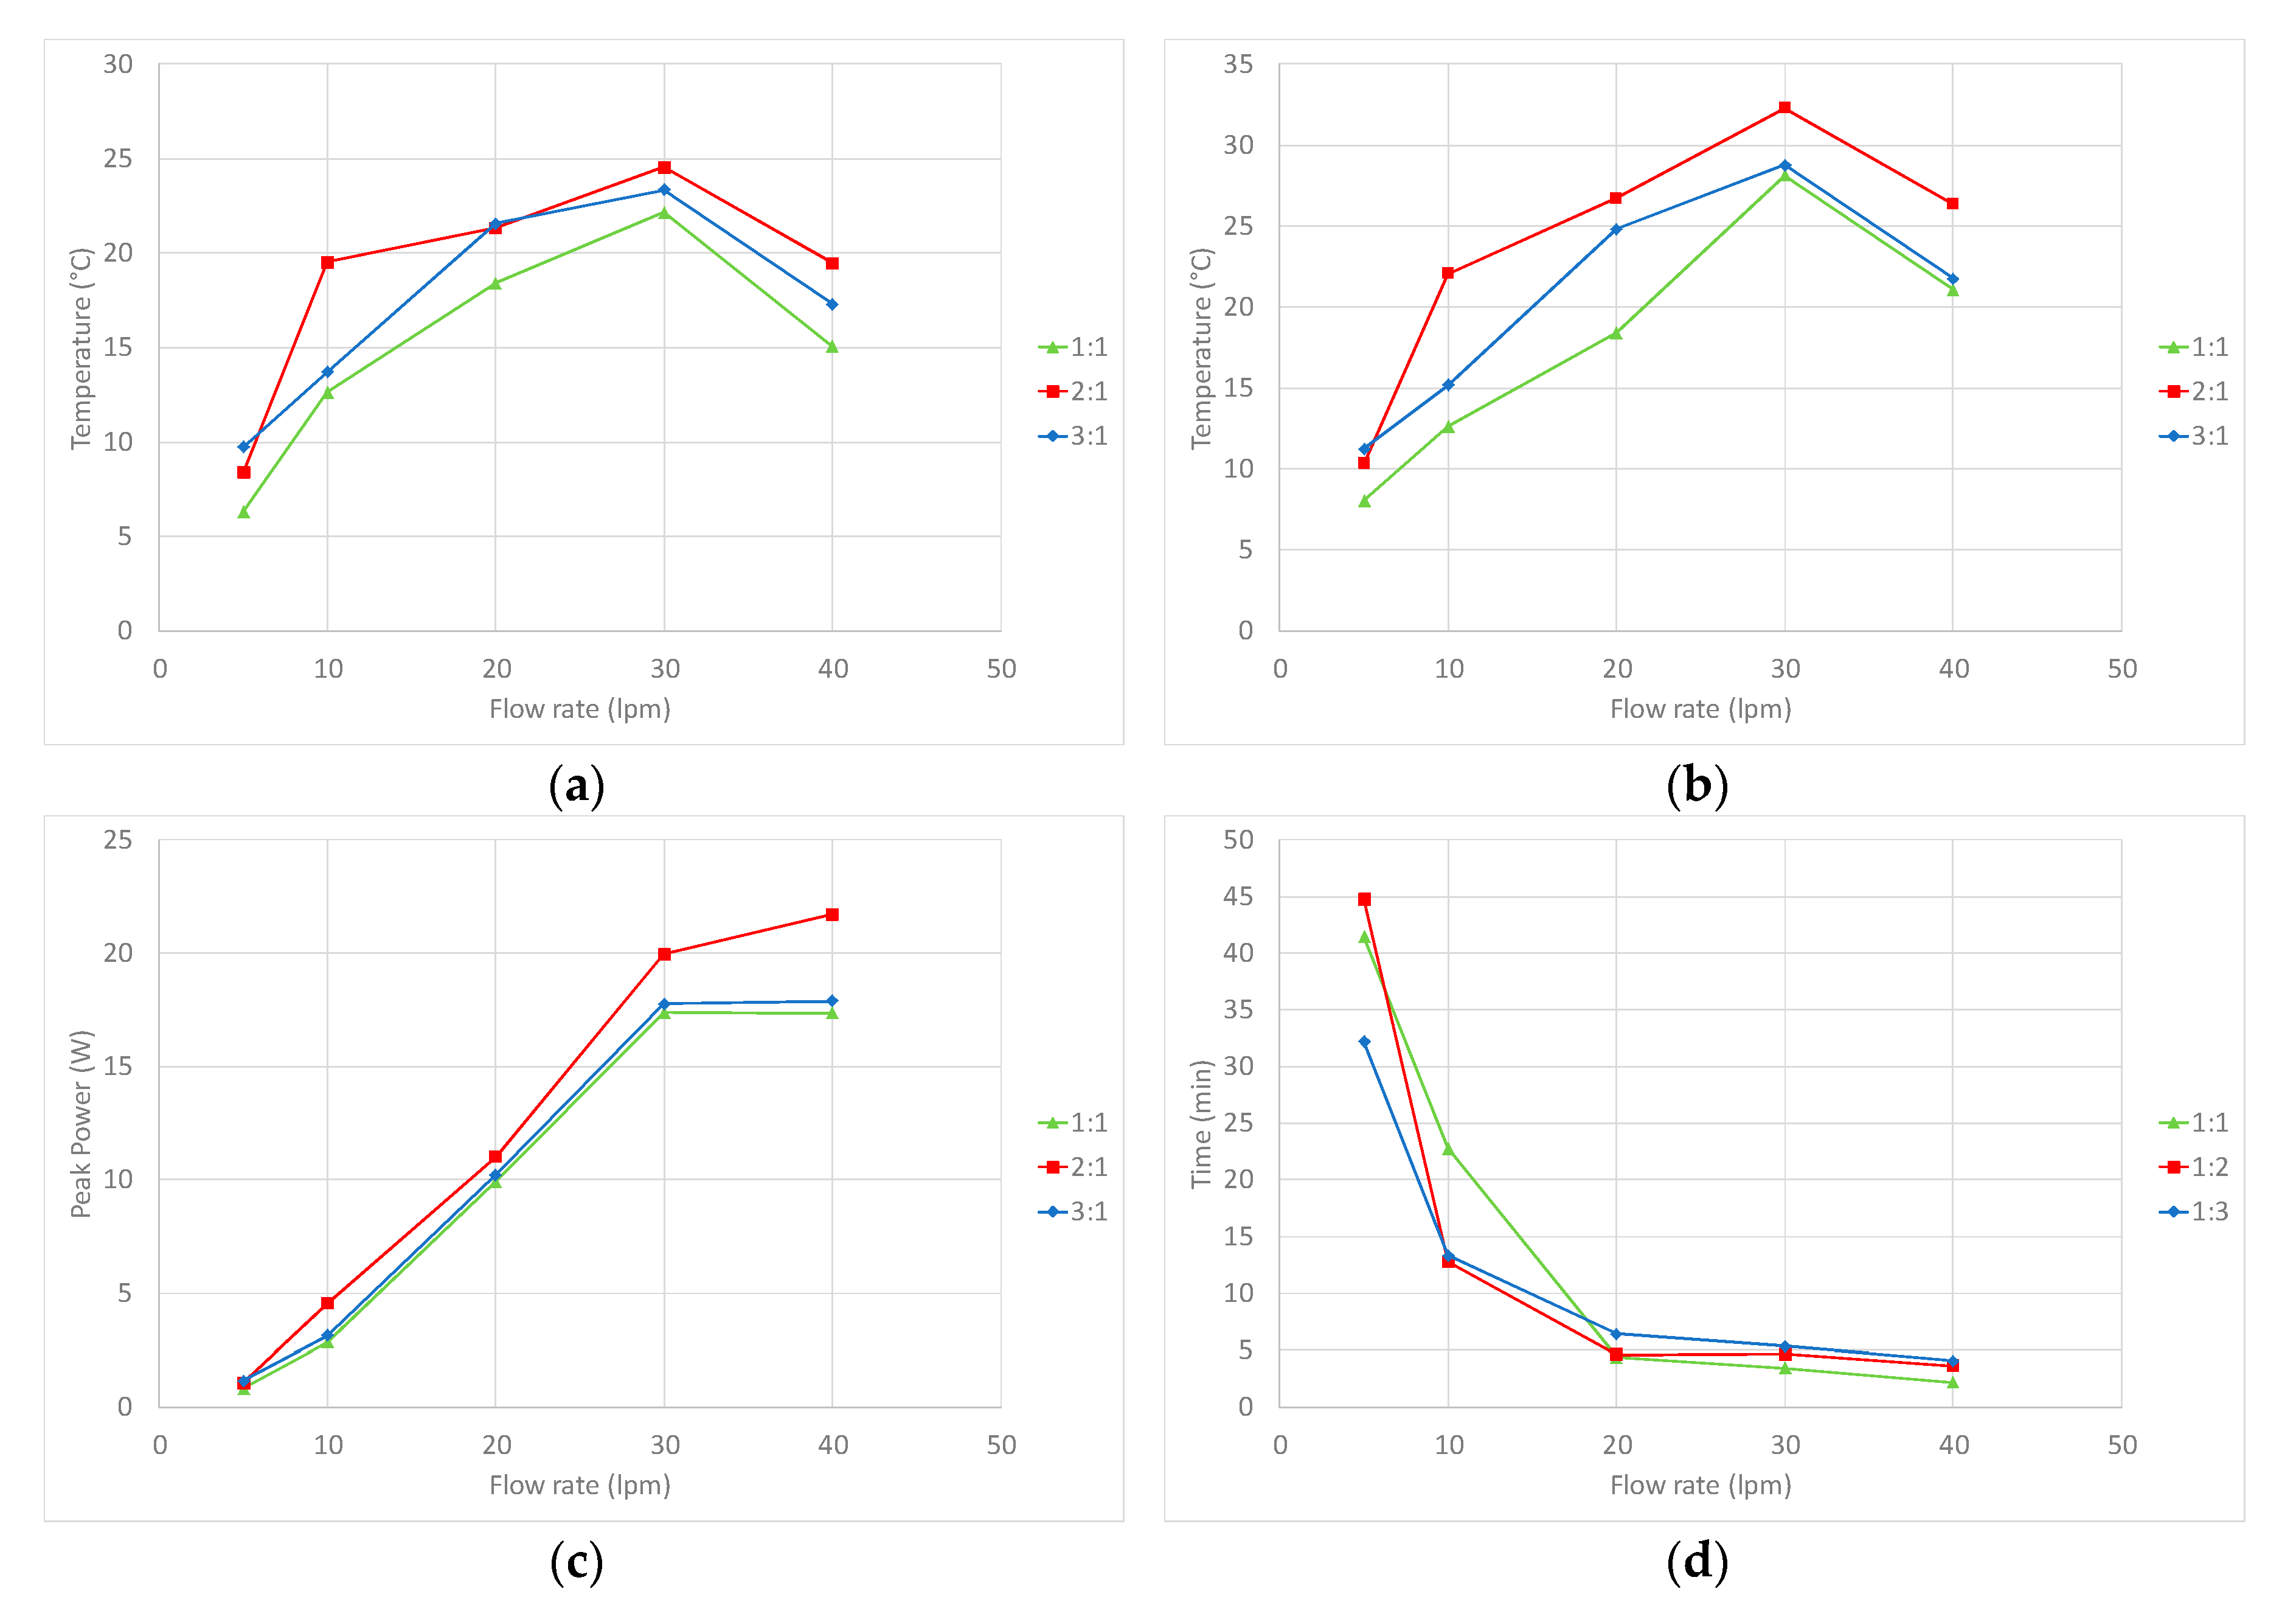
Further analysis of the data shows that the mean temperature uplift (Figure 5a) and peak temperature uplift (Figure 5b) follow a trend of increasing temperature with an increase in flow rate up to a peak at 30 L/min. A further increase in flow rate results in a reduced temperature uplift. From the exit air temperature profile, it is possible to calculate the rate of energy liberation (Figure 5c), which increases in a stepwise manner with flow rate before the rate begins to plateau at 30 L/min. The time taken to reach peak temperature, which is essential for a rapid dynamic response, reduces significantly as the flow rate increases beyond 5 L/min, and plateaus between 30 and 40 L/min (Figure 5d). The maximum power output of the reactor can be achieved in around 3 to 4 min under favourable conditions highlighting a system with excellent dynamic response when operated at the optimized conditions.
The mechanisms dictating the relationship between the dynamic behaviour of reactor and air flow can be explained by considering the responses and performance characteristics of Figure 4 and Figure 5. Increasing the moist air flow has two impacts: it increases the quantity of energy liberating reactant entering the reactor (water) and it increases the flow of heat transport medium (air). If sufficient energy is liberated in the particle, then increasing the flow rate would increase the heat transfer (and hence the exit reactor temperature) from the particle in the air flow [25]. Up to 30 L/min the moisture supply has a positive impact on energy release in that the water reacts exothermically with CaCl2 and this liberated energy is transported out of the reactor. Above 30 L/min, two possible mechanisms are postulated. The net reaction rate does not increase above the maximum achieved at 30 L/min and therefore the energy liberated must increase the temperature of a larger volume of air. The second mechanism is that the additional moisture is deposited on the SIM, resulting in hydration to the endothermic heptahydrate and further hydration to a deliquescent state. This deliquescence increases the thermal mass of the SIM (reducing the temperature uplift from a given energy liberation) and reduces the net thermal energy liberation due to its endothermic nature.
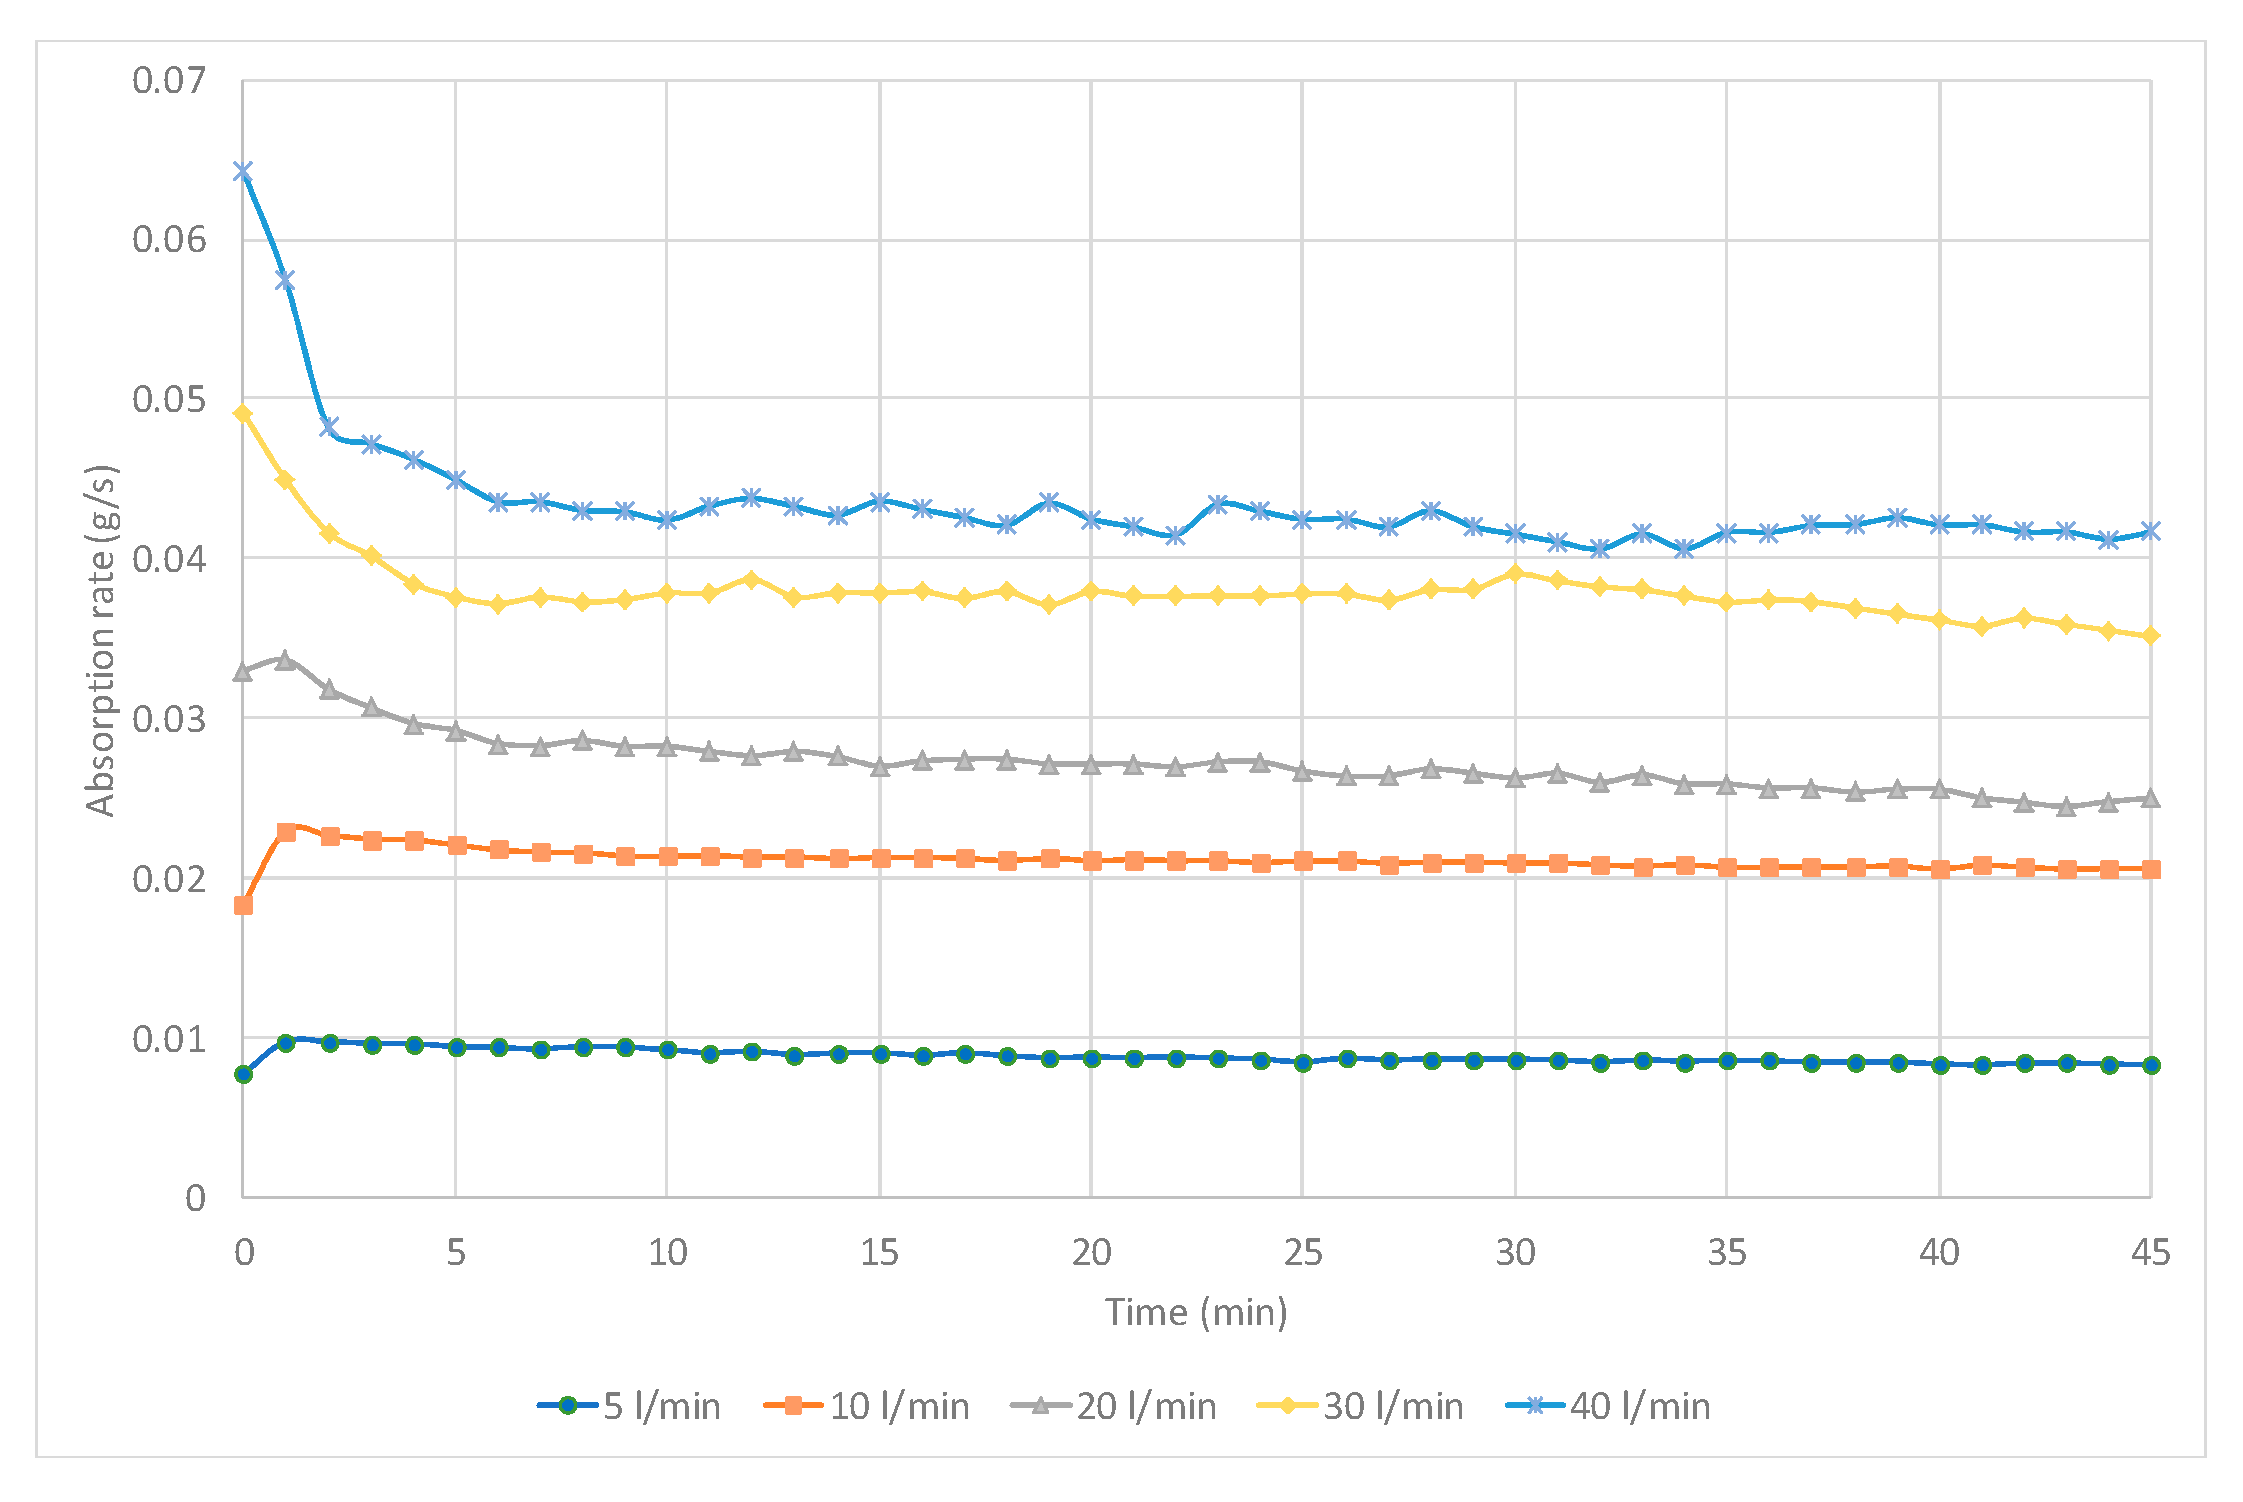
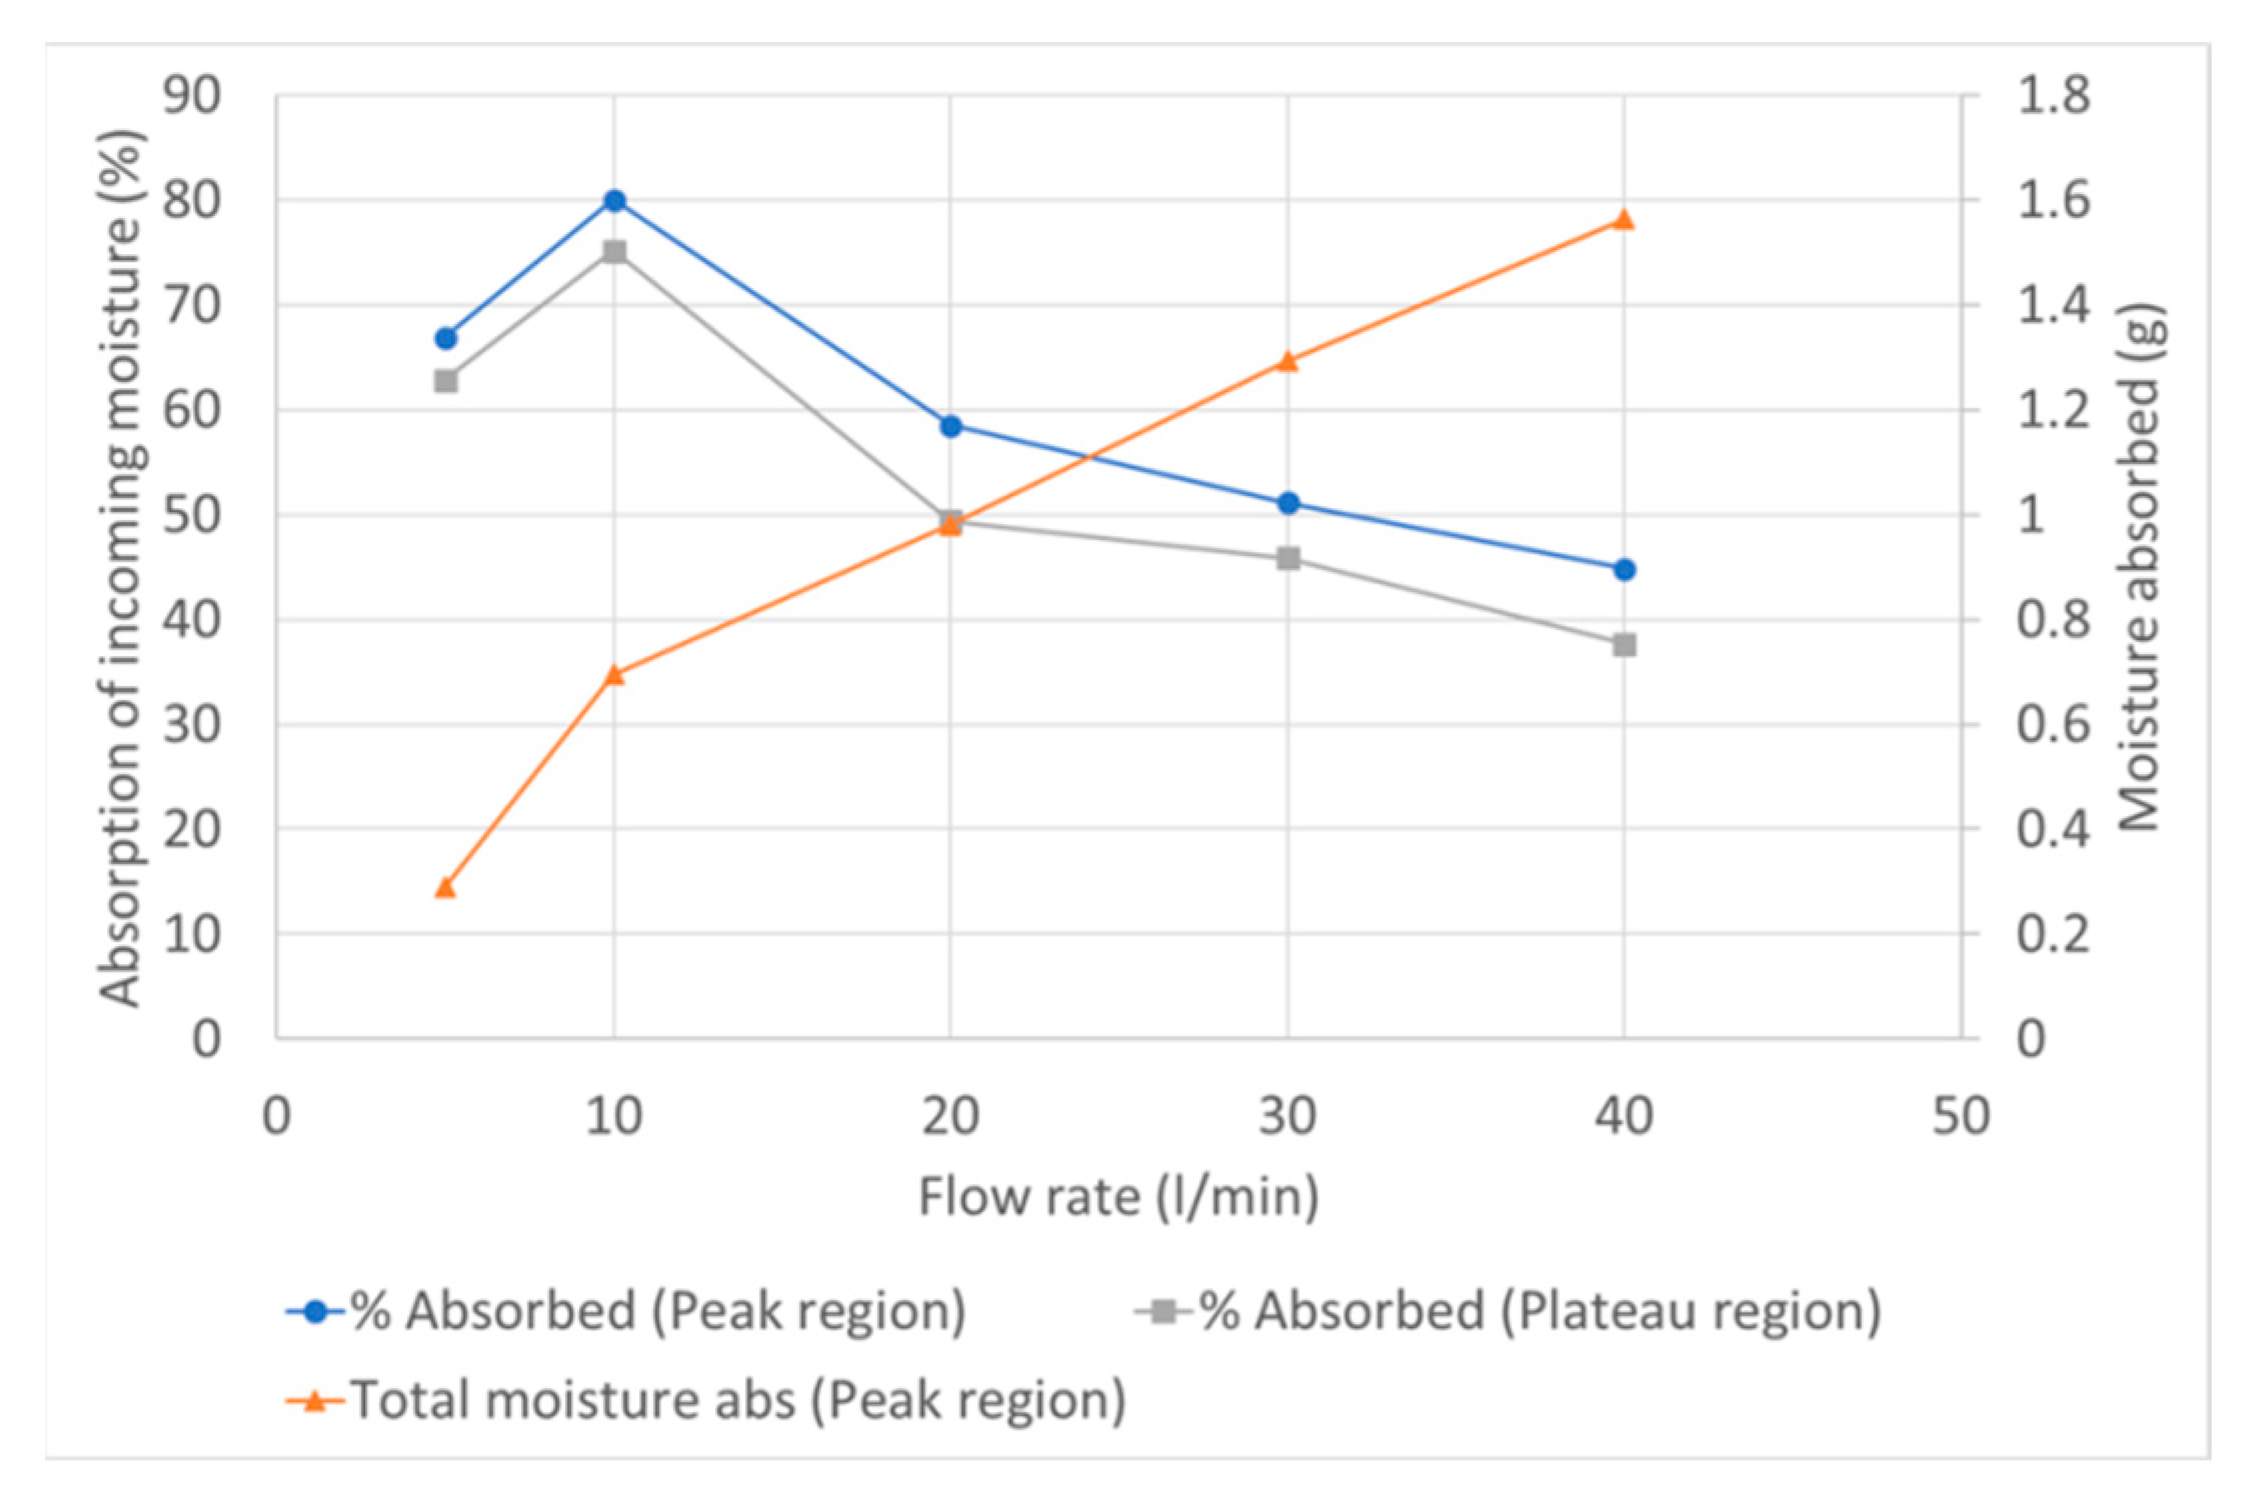
Further evidence as to the mechanism can be obtained by examining the thermal response and moisture absorption rate (calculated from the difference between the input supply moisture concentration and the exit concentration) (Figure 6). For all flow rates, there is an initial high absorption rate between 0.010 (5 L/min) and 0.065 g/s (40 L/min) which reduces by 13% (5 L/min) to 33% (40 L/min) during the first 5 min before stabilising for the remainder of the experiment where the average reduction is typically only 0.0025 g/s over the next 40 min. The rate of moisture absorption is higher for the higher flow rates, which is indicative of a greater water capture by the SIM at the higher flow rates, which is further evidenced in Figure 7 where the absolute values of moisture absorbed in the initial 5 min are five times higher at 40 than at 5 L/min. Also, from Figure 7 it can be confidently hypothesized that it is the negative impact of the “excess” water which is the dominant mechanism by which the thermal response is retarded at higher rates (as shown in Figure 4 after the peak temperature is achieved). In the region of peak temperature achievement, the percentage of moisture absorbed at 20–40 L/min is lower than that at 5 and 10 L/min; however, the absolute value is much greater. The SIM materials located proximal to the inlet stream will be hydrated beyond the heptahydrate state and therefore have a retarding effect upon the thermal response.
The mechanism proposed for the results is that there is a balance between the quantity of SIM mass/surface area present and the air flow. In order to investigate this relationship, further particles of SIM were selected according to size and filled to the same volumetric quantities as previously used. Particles were banded in four bands in accordance with the ranges defined in Table 1, with SIMRef brought forward from the initial studies, and represents a mixed particle size. To achieve this, fresh vermiculite samples were obtained from the same supplier and subsequently gently filtered to achieve the required range. SIM was synthesised as previously described, although it was observed that the uptake of salt onto the larger particles was less efficient than the smaller variants. The volume of material was kept constant in the reactor with the particles being gently agitated and lightly pressed in order to achieve a tap density without any compression of the individual particles. Due to the change in packing density associated with the geometric size of the particles, a change in the calculated stored energy occured. The maximum predicted energy density is achieved when there is a wide ranges of particle sizes, which enables denser packing [26].
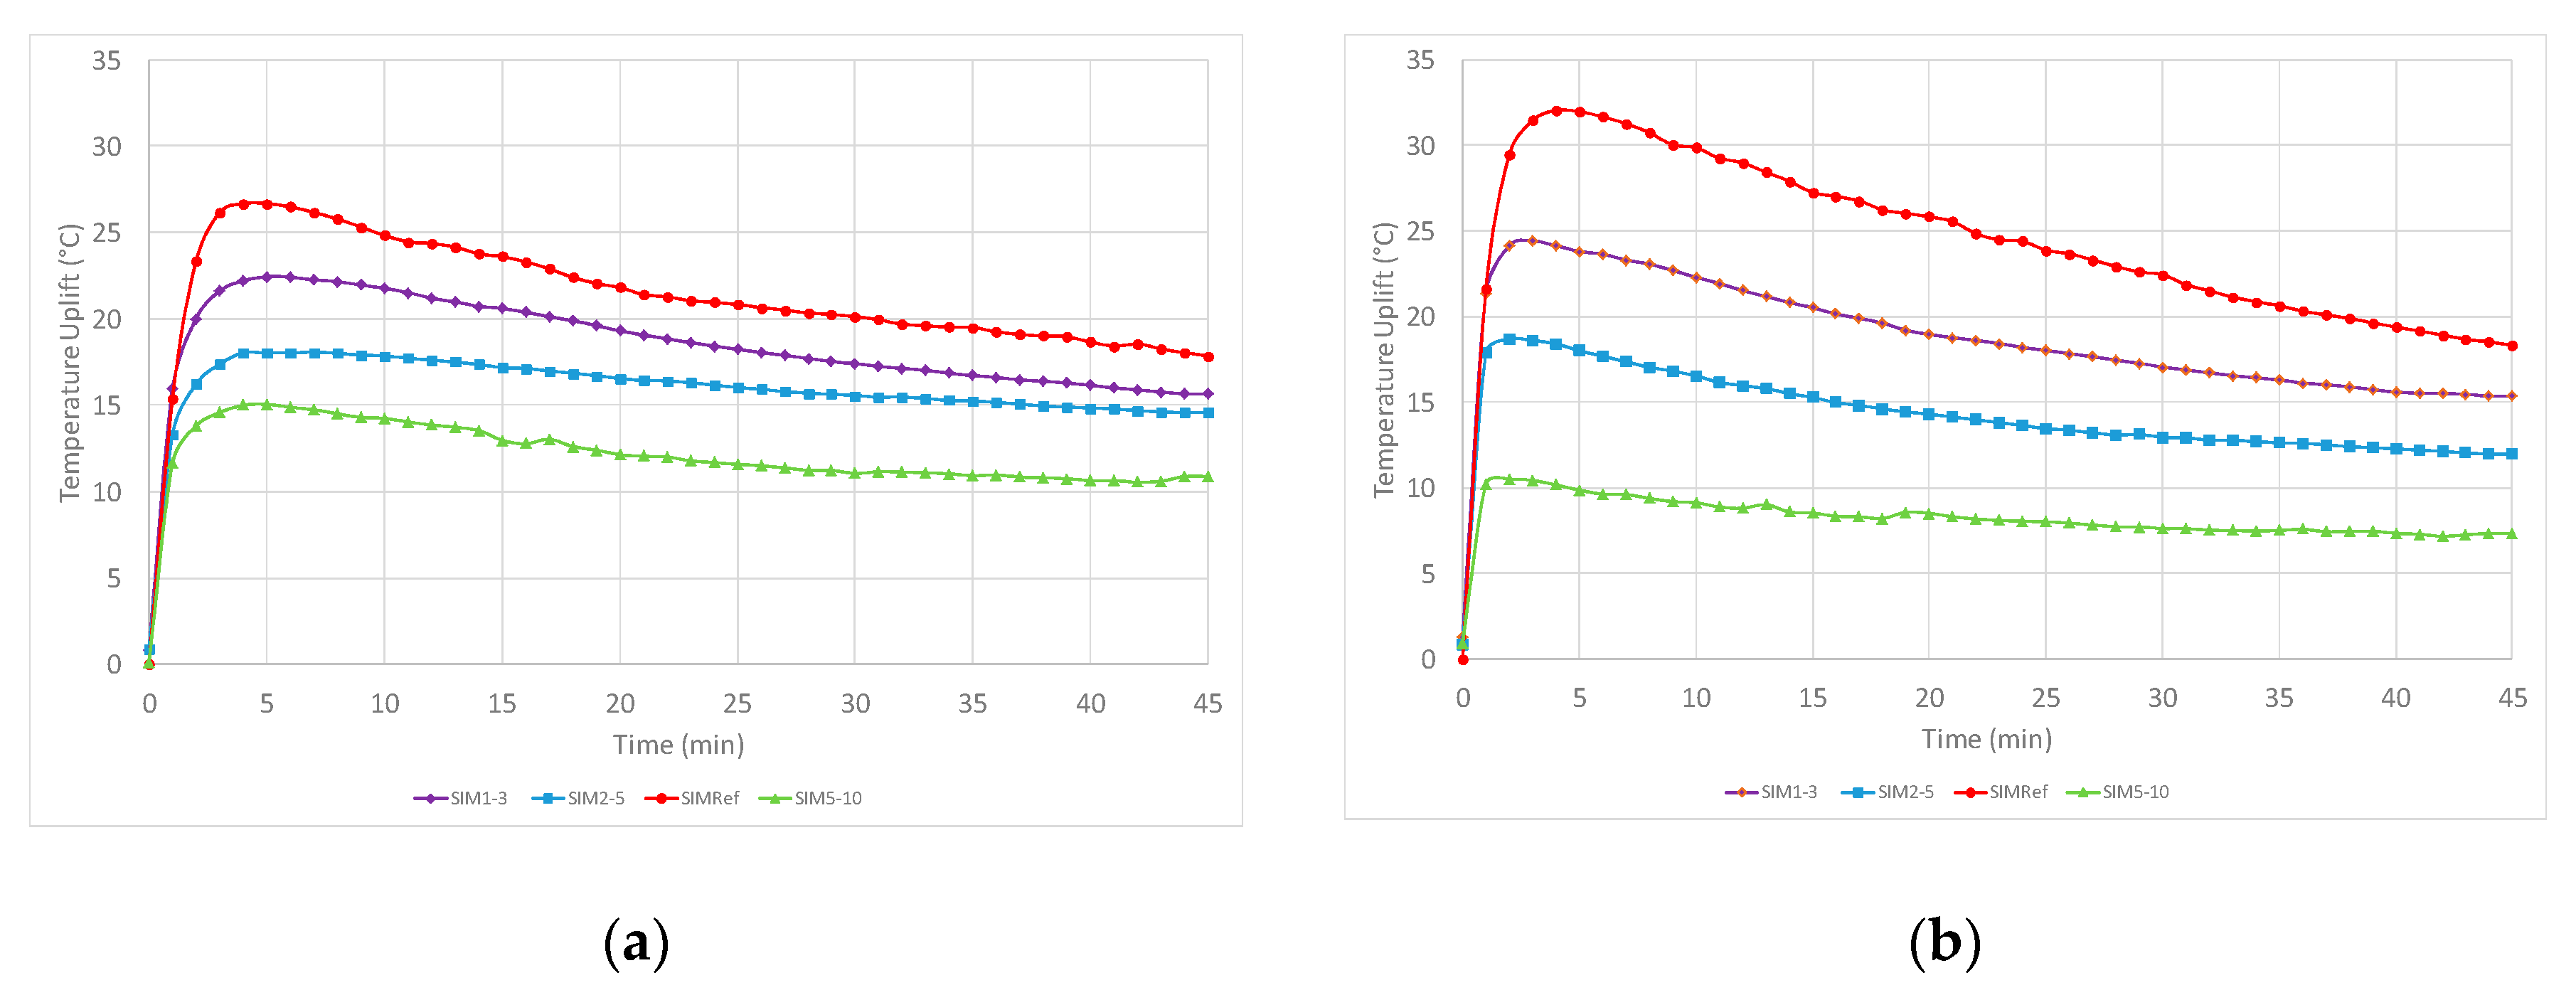
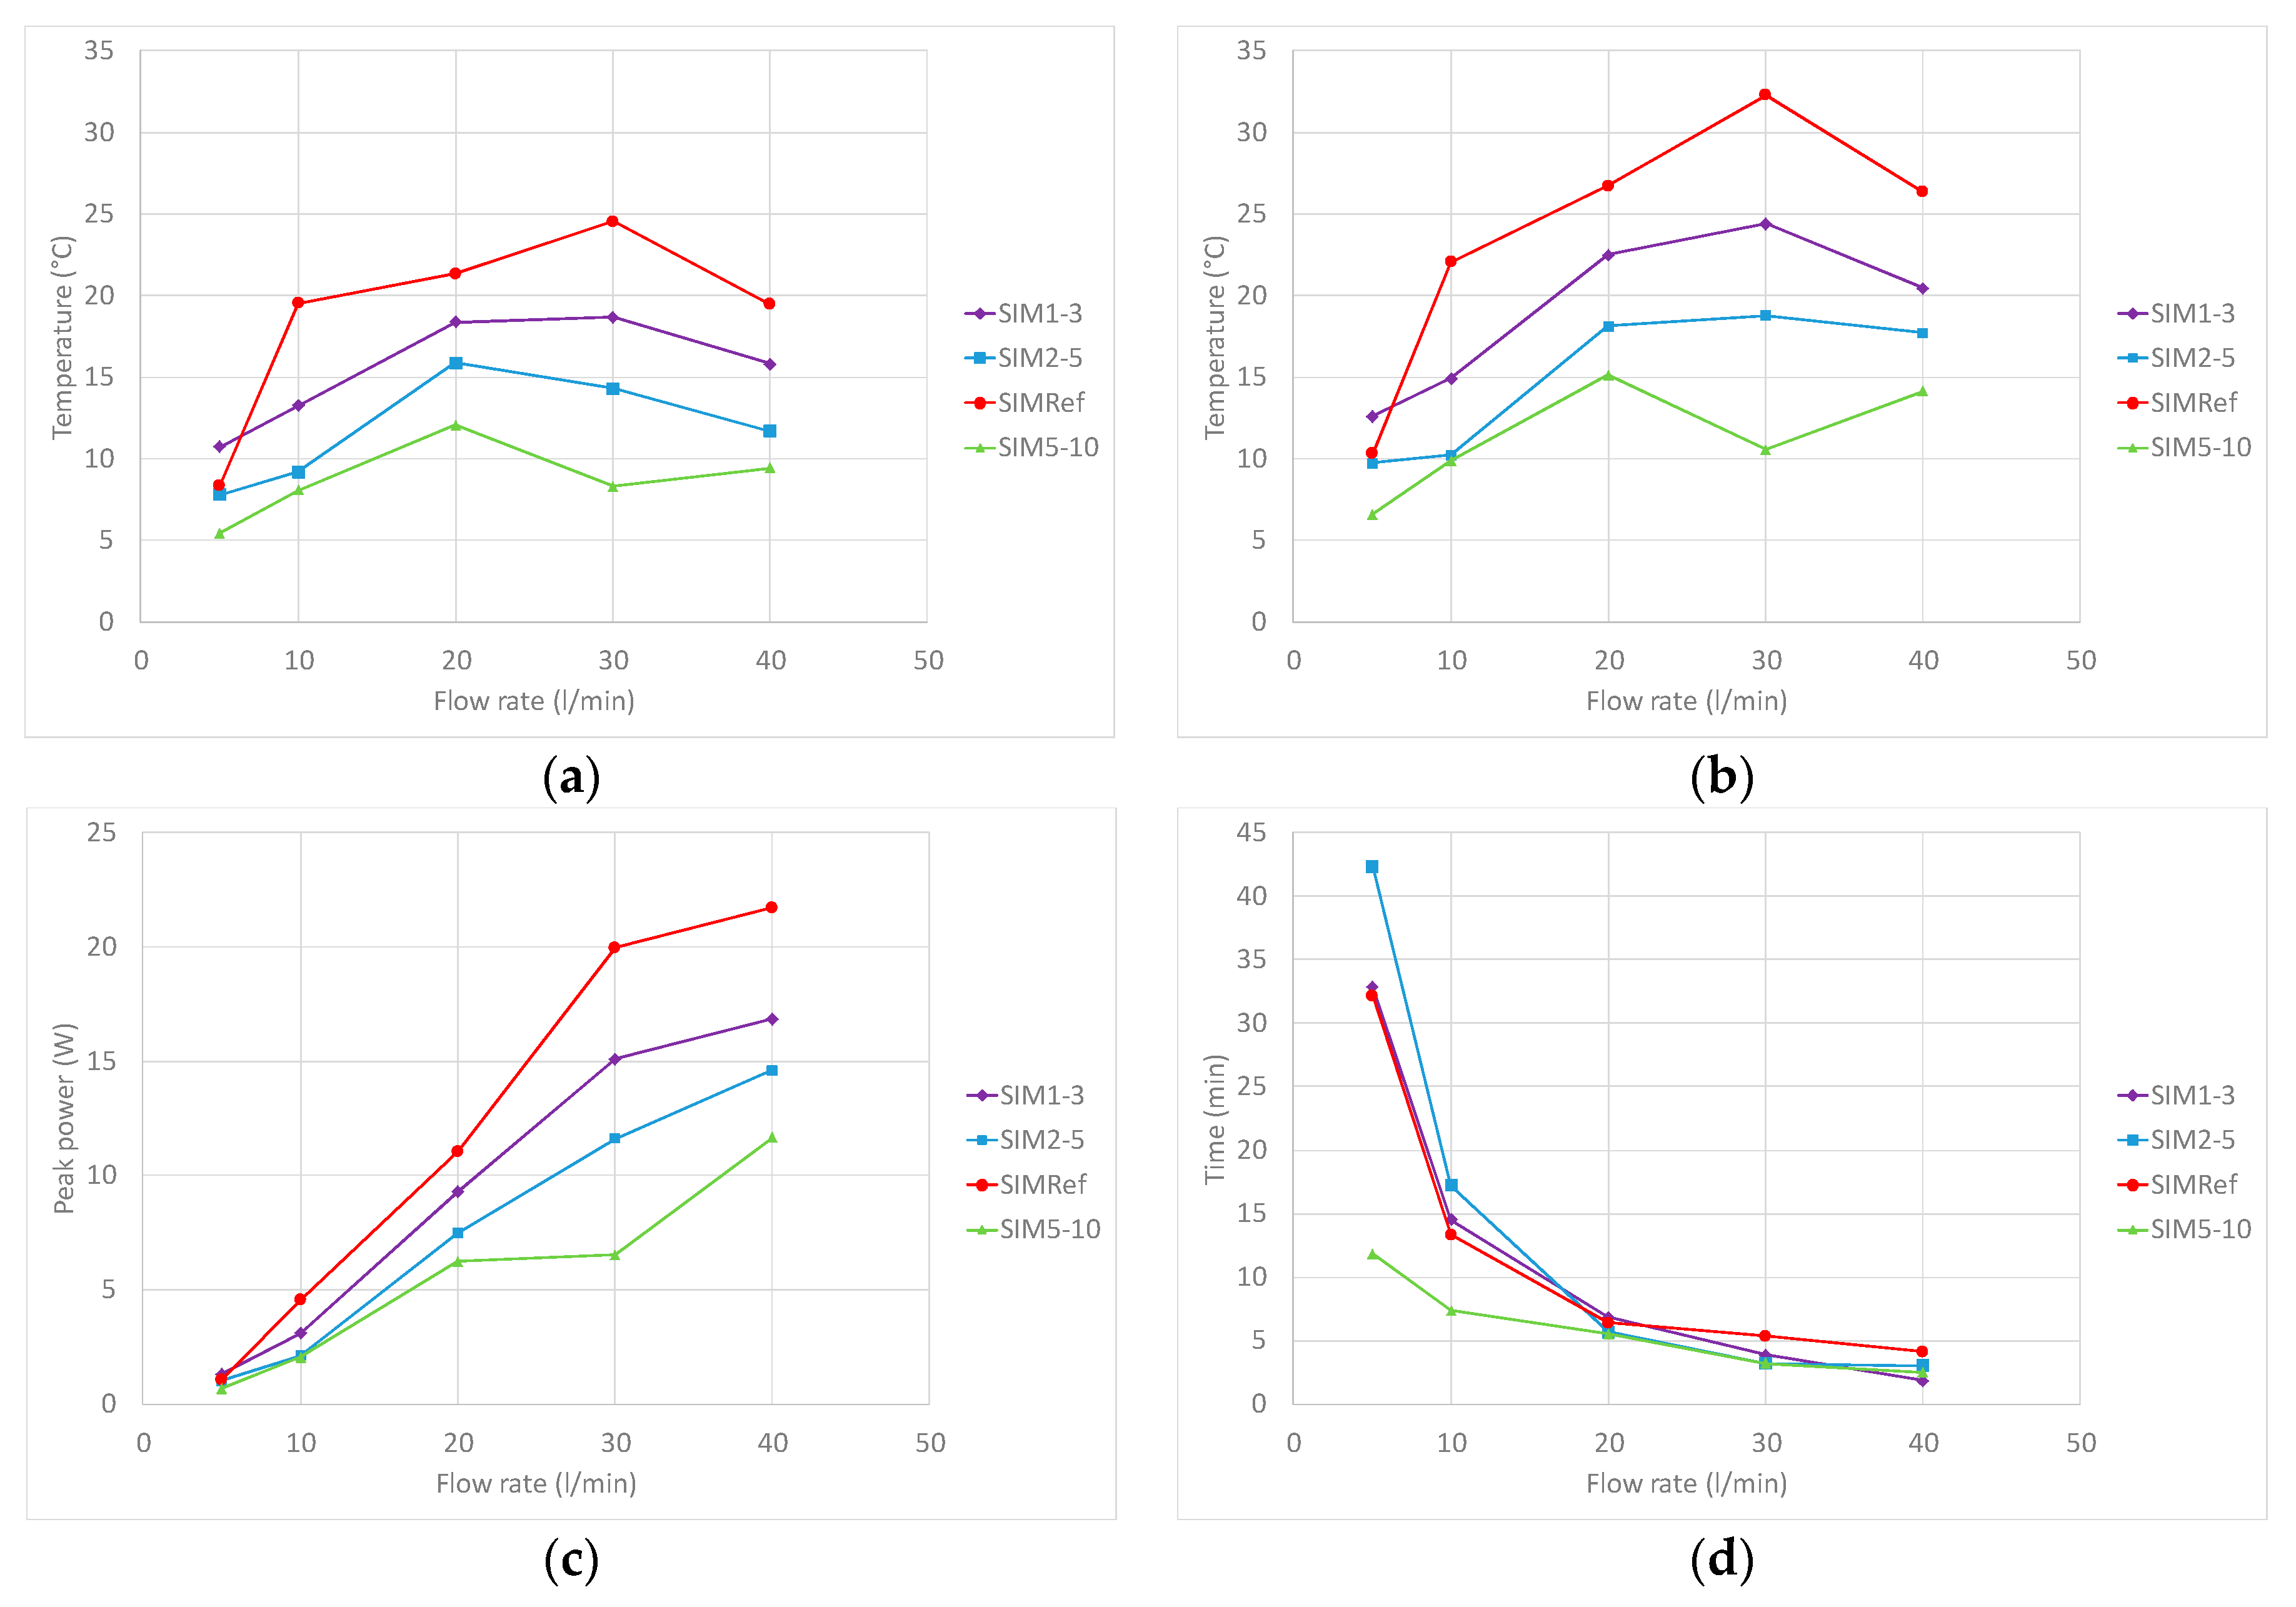
The lowest power is obtained when the largest particles are used, and this can be attributed to the lower available surface area for reaction, the lowest quantity of active salt and bulk highest porosity which allows the moist air to pass through without interacting with the SIM (Figure 8). The highest output power is achieved when the original mixed particle size is used, which is in line with increased SIM packing density. There is also a clear interaction between the flow rate and particle size where the highest temperature uplift (and power) is achieved at 20 L/min for the SIM5-10, while it is at 30 L/min when the SIM particle density is increased. At 20 L/min the peak temperature uplift is around 15 °C with the larger particles and this reduces to 10 °C at 30 L/min. SIM1-3 and SIM2-5 particles follow similar shaped thermal profiles to the SIMRef at 20 and 30 L/min, but with reduced peak temperatures. The smaller particles (SIM1-3) are 4 °C at 20 L/min and 8 °C at 30 L/min lower than SIMRef, while SIM2-5 is 8 °C at 20 L/min and 16 °C at 30 L/min lower. The consistent behaviour observed within the three smaller particle ranges, coupled with the changes in the larger particle set, confirm that the optimised thermal response for any large scale system will be a function of both the material (size) and process properties (delivery rate).
The thermal responses and performance characteristics clearly illustrate the benefit of the denser packing, resultant higher surface area and salt availability made possible by the mixture of particle sizes (Figure 9). With SIMRef, the maximum temperature and power are around twice that observed with the worst performing materials set, SIM5-10. As previously stated, SIM1-3 and SIM2-5 show a similar temperature and power response to SIMRef albeit at a reduced magnitude. Clearly, the wider particle size range significantly improves the thermal response of the materials, through improved packing allowing greater access to the available salt.
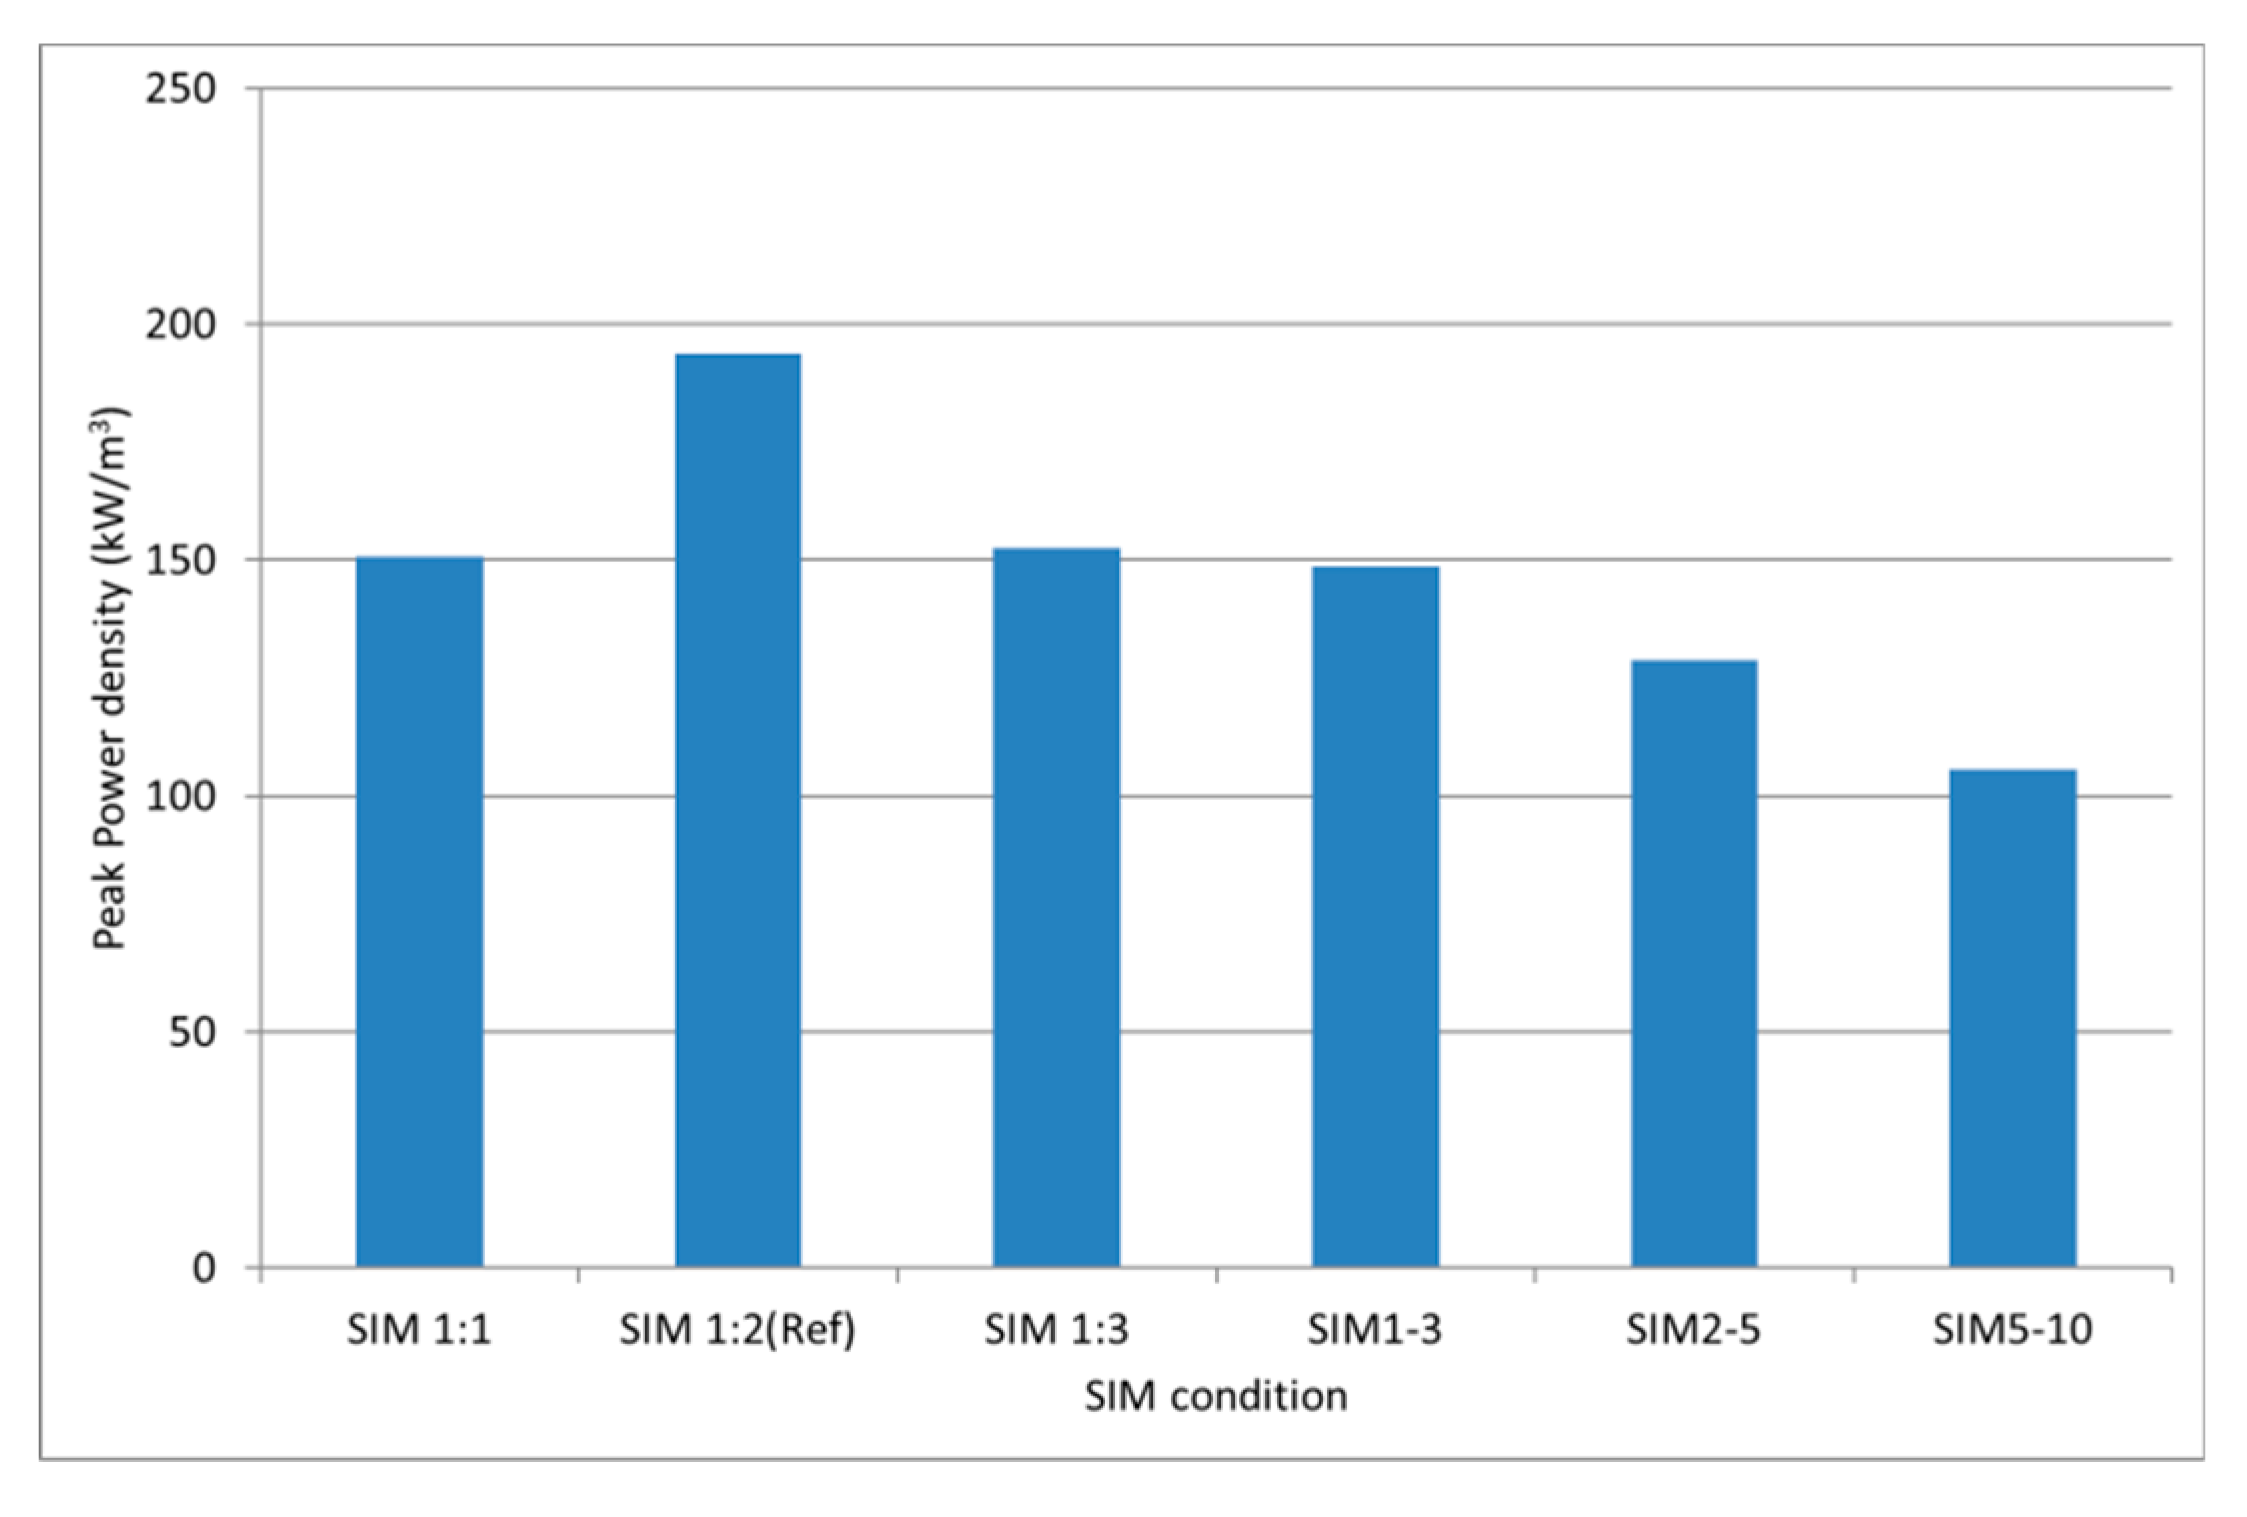
The SIM condition has a significant impact on the maximum peak power available (Figure 10). This is based on a simple volumetric linear module and is likely to significantly overestimate the peak thermal power which can be extracted from the SIM during the hydration process as there is a penalty paid when reactors are scaled. Further studies should examine the implications when the reactor is increased in scale, since there is a known penetration depth of the material which will have an impact on the material utilization and power generation [23,27]. The challenge for the engineer is to reduce the penalty which is paid when upscaling through reactor design. This also highlights the challenge in control of the SIM dimensional physical characteristics. A volume of SIM containing larger particles placed into the same volumetrically fixed reactor could reduce the peak power by almost 44%. Also, any physical size changes that occur due to physical damage could ultimately impact the power response over the lifetime of any reactor.
Further work should also examine the response with lower air moisture levels and lower inlet temperatures. In many cold weather environments, both the inlet air temperature and absolute moisture level are likely to be lower. Typically, UK temperatures and Northern European temperatures are in the 3–8 °C range and mean RH of 80% yields an inlet absolute humidity of 4 and 8 g/m3. This may effectively retard the salt/moisture reaction rate with a subsequent reduction in available power. In this instance, the addition of moisture using misting with piezo-based mist generators or atomizing equipment may be needed. These would provide an additional input control parameter if the operation of the reactor is to remain optimized.
4. Conclusions
An experimental study of the dynamic response of thermochemical SIM materials and operating conditions has been carried out. A reactor containing 127 cm3 of material is capable of generating 22 W of thermal power in under 5 min at the optimum air flow. There exists an optimum air flow which yields a maximum reactor exit temperature of over 30 °C. Low flow rates provide insufficient moisture to maintain the optimum reaction rate and result in a reactor exit temperature of less than 5 °C. An excessive flow rate results in excess moisture absorption in the SIM, which leads to endothermic reactions reducing peak output temperatures, around 25 °C. The quantity of salt in the SIM is secondary and there is no benefit from including additional salt in the SIM. The power density is a function of the particle size with a mixed size, giving the maximum power density through increased packing. Based on a simple volumetric scaling of the reactor, a power density of >150 kW/m3 is theoretically possible, but this would require significant improvement in reactor design. Further work should aim to optimize the relationship between the peak power output, energy storage density and the particle density in a larger reactor. The impact of reactor scaling through reactor design and the development of realistic scaling rules should be prioritised in order to confidently commercialize the technology.
Author Contributions
Methodology, Supervision and writing-original draft preparation, E.J., J.S. and J.E.; Investigation, Material preparation, data curation, formal analysis and validation, J.E., S.W., J.R., B.A. and R.W. All authors have read and agreed to the published version of the manuscript.
Funding
The authors would like to acknowledge support through the funding of the SPECIFIC Innovation and Knowledge Centre by the Engineering and Physical Science Research Council [EP/N020863/1], Innovate UK [920036], and the European Regional Development Fund [c80892] through the Welsh Government.
Conflicts of Interest
The authors declare no conflict of interest.
References
- Available online: https://www.ofgem.gov.uk/publications-and-updates/ofgem-s-future-insights-paper-2-decarbonisation-heat (accessed on 29 March 2020).
- Available online: https://www.theade.co.uk/resources/publications/market-report-heat-networks-in-the-uk (accessed on 29 March 2020).
- Spring. 2018. Available online: https://www.energy-uk.org.uk/our-work/new-energy-services-and-heat/decarbonisation-of-heat.html (accessed on 29 March 2020).
- Alva, G.; Lin, Y.; Fang, G. An overview of thermal energy storage systems. Energy 2018, 144, 341–378. [Google Scholar] [CrossRef]
- Zhang, H.; Cáceres, G.; Baeyens, J.; Lv, Y.; Degrève, J. Thermal energy storage: Recent developments and practical aspects. Prog. Energy Combust. Sci. 2015, 53, 1–40. [Google Scholar] [CrossRef]
- Navarro, L.; de Gracia, A.; Colcloug, S.; Browne, M.; McCormack, S.J.; Griffiths, P.; Cabeza, L.F. Thermal energy storage in building integrated thermal systems: A review. Part 1. active storage systems. Renew Energy 2016, 88, 526–547. [Google Scholar] [CrossRef] [Green Version]
- Pinel, P.; Cruickshank, C.A.; Beausoleil-Morrison, I.; Wills, A. A review of available methods for seasonal storage of solar thermal energy in residential applications. Renew. Sustain. Energy Rev. 2011, 15, 3341–3359. [Google Scholar] [CrossRef]
- Xu, J.X.; Li, T.X.; Chao, J.W.; Yan, T.S.; Wang, R.Z. High energy-density multi-form thermochemical energy storage based on multi-step sorption processes. Energy 2019, 185, 1131–1142. [Google Scholar] [CrossRef]
- Wang, Q.; Xie, Y.; Ding, B.; Yu, G.; Ye, F.; Xu, C. Structure and hydration state characterizations of MgSO4-zeolite 13x composite materials for long-term thermochemical heat storage. Sol. Energy Mater. Sol. C 2019, 200, 110047. [Google Scholar] [CrossRef]
- Jabbari-Hichri, A.; Bennici, S.; Auroux, A. Enhancing the heat storage density of silica–alumina by addition of hygroscopic salts(CaCl2, Ba(OH)2, and LiNO3. Sol. Energy Mater. Sol. C 2015, 140, 351–360. [Google Scholar] [CrossRef]
- Farcota, L.; Le Pierrèsa, N.; Fourmiguéc, J. Experimental investigation of a moving-bed heat storage thermochemical reactor with SrBr2/H2O couple. J. Energy Storage 2019, 26, 101009. [Google Scholar] [CrossRef]
- Courbon, E.; D’Ans, P.; Permyakova, A.; Skrylnyk, O.; Steunou, N.; Degrez, M.; Frère, M. Further improvement of the synthesis of silica gel and CaCl2 composites: Enhancement of energy storage density and stability over cycles for solar heat storage coupled with space heating applications. Sol. Energy 2017, 157, 532–541. [Google Scholar] [CrossRef]
- Trausel, F.; De Jong, A.J.; Cuypers, R. A review on the properties of salt hydrates for thermochemical storage. Energy Procedia 2014, 48, 447–452. [Google Scholar] [CrossRef] [Green Version]
- Mehrabadi, A.; Farid, M. New salt hydrate composite for low-grade thermal energy storage. Energy 2018, 164, 194–203. [Google Scholar] [CrossRef]
- Michel, B.; Mazet, N.; Neveu, P. Experimental investigation of an innovative thermochemical process operating with a hydrate salt and moist air for thermal storage of solar energy: Global performance. Appl. Energy 2014, 129, 177–186. [Google Scholar] [CrossRef] [Green Version]
- Hanmer, C.; Shipworth, M.; Shipworth, D.; Carter, E. How household thermal routines shape UK home heating demand patterns. Energy Effic. 2019, 12, 5–17. [Google Scholar] [CrossRef] [Green Version]
- Bennett, G.; Elwell, C.; Lowe, R.; Oreszczyn, T. The importance of heating system transient response in domestic energy labelling. Buildings 2016, 6, 29. [Google Scholar] [CrossRef] [Green Version]
- Zangheri, P.; Armani, R.; Pietrobon, M.; Pagliano, L.; Fernandez Boneta, M.; Müller, A. Heating and Cooling Energy Demand and Loads for Building Types in Different Countries of the EU. March 2014. Available online: http://www.entranze.eu/files/downloads/D2_3/Heating_and_cooling_energy_demand_and_loads_for_building_types_in_different_countries_of_the_EU.pdf (accessed on 29 March 2020).
- Darby, S.J. Smart electric storage heating and potential for residential demand response. Energy Effic. 2018, 11, 67–77. [Google Scholar] [CrossRef] [Green Version]
- Solé, A.; Martorell, I.; Cabeza, L.F. State of the art on gas-solid thermochemical energy storage systems and reactors for building applications. Renew. Sustain. Energy Rev. 2015, 47, 386–398. [Google Scholar] [CrossRef] [Green Version]
- Zhu, D.; Wu, H.; Wang, S. Experimental study on composite silica gel supported CaCl2 sorbent for low grade heat storage. Int. J. Therm. Sci. 2006, 45, 804–813. [Google Scholar] [CrossRef]
- Casey, S.P.; Elvins, J.; Riffat, S.; Robinson, A. Salt impregnated desiccant matrices for ‘open’ thermochemical energy storage—Selection, synthesis and characterisation of candidate materials. Energy Buildings 2014, 84, 412–425. [Google Scholar] [CrossRef]
- Sutton, R.J.; Jewell, E.; Elvins, J.; Searle, J.R.; Jones, P. Characterising the discharge cycle of CaCl2 and LiNO3 hydrated salts within a vermiculite composite scaffold for thermochemical storage. Energy Buildings 2014, 162, 109–120. [Google Scholar] [CrossRef] [Green Version]
- Casey, S.P.; Aydin, D.; Riffat, S.; Elvins, J. Salt impregnated desiccant matrices for “open” thermochemical energy storage - Hygrothermal cyclic behaviour and energetic analysis by physical experimentation. Energy Buildings 2015, 92, 128–139. [Google Scholar] [CrossRef]
- Will, J.B.; Kruyt, N.P.; Venner, C.H. An experimental study of forced convective heat transfer from smooth, solid spheres. Int. J. Heat Mass Transf. 2017, 109, 1059–1067. [Google Scholar] [CrossRef]
- Brouwers, H.J.H. Particle-size distribution and packing fraction of geometric random packings. Phys. Rev. E 2006, 74, 031309. [Google Scholar] [CrossRef] [PubMed] [Green Version]
- Sutton, R.J.; Jewell, E.; Elvins, J.; Searle, J.R. Discharge performance of blended salt in matrix materials for low enthalpy thermochemical storage. Appl. Therm. Eng. 2018, 145, 483–493. [Google Scholar] [CrossRef] [Green Version]
Figure 1.
SEM of the salt in matrix (SIM) material at (a) 3:1, (b) 2:1 and (c) 1:1 salt to vermiculite ratios and (d) the particle size distribution of the SIM at 2:1 salt to vermiculite ratio.
Figure 1.
SEM of the salt in matrix (SIM) material at (a) 3:1, (b) 2:1 and (c) 1:1 salt to vermiculite ratios and (d) the particle size distribution of the SIM at 2:1 salt to vermiculite ratio.

Figure 2.
Schematic of experimental apparatus.

Figure 3.
Long term performance of the 2:1 CaCl2: VM SIM for an input flow rate of 5 L/min and 20 L/min in reactor 1.
Figure 3.
Long term performance of the 2:1 CaCl2: VM SIM for an input flow rate of 5 L/min and 20 L/min in reactor 1.

Figure 4.
Thermal response of (a) 1:1 SIM, (b) 2:1 Sim and (c) 3:1 SIM under varying flow rate conditions in Reactor 1 at an inlet conditions of 17 g H2O/m3 and 20 °C.
Figure 4.
Thermal response of (a) 1:1 SIM, (b) 2:1 Sim and (c) 3:1 SIM under varying flow rate conditions in Reactor 1 at an inlet conditions of 17 g H2O/m3 and 20 °C.

Figure 5.
Performance of each SIM: vermiculite ratio over a 45-min period at each flowrate showing (a) mean outlet temperature uplift; (b) peak outlet temperature uplifts; (c) peak power and (d) time to peak power.
Figure 5.
Performance of each SIM: vermiculite ratio over a 45-min period at each flowrate showing (a) mean outlet temperature uplift; (b) peak outlet temperature uplifts; (c) peak power and (d) time to peak power.

Figure 6.
Absorption rates at each flow rate within the reactor at a 2:1 CaCl2:VM ratio.

Figure 7.
Proportion of moisture captured by the SIM during peak temperature and plateau regions and magnitude of moisture absorbed during the peak temperature region.
Figure 7.
Proportion of moisture captured by the SIM during peak temperature and plateau regions and magnitude of moisture absorbed during the peak temperature region.

Figure 8.
The impact of particle size on reactor thermal response when filled with SIM particles of varying size at (a) 20 and (b) 30 L/min.
Figure 8.
The impact of particle size on reactor thermal response when filled with SIM particles of varying size at (a) 20 and (b) 30 L/min.

Figure 9.
Performance of each particle size distribution over a 45-min period at each flowrate showing (a) mean outlet temperature uplift; (b) peak outlet temperature uplifts; (c) peak power and (d) time to peak power.
Figure 9.
Performance of each particle size distribution over a 45-min period at each flowrate showing (a) mean outlet temperature uplift; (b) peak outlet temperature uplifts; (c) peak power and (d) time to peak power.

Figure 10.
The impact of SIM condition on the maximum peak power density achievable using linear volumetric scaling of the reactor.
Figure 10.
The impact of SIM condition on the maximum peak power density achievable using linear volumetric scaling of the reactor.


Table 1.
Characteristics of the particle size when the reactor is filled with 20 mm of material.
| Designation | Size Limits (mm) | Charge Mass (g) | Nominal Energy Density (kJ/kg) |
|---|---|---|---|
| SIM1-3 | 1–3 | 28 | 178.5 |
| SIM2-5 | 2–5 | 30 | 192.5 |
| SIMRef | 1–5 | 31 | 197.8 |
| SIM5-10 | 5–10 | 26 | 164.2 |
© 2020 by the authors. Licensee MDPI, Basel, Switzerland. This article is an open access article distributed under the terms and conditions of the Creative Commons Attribution (CC BY) license (http://creativecommons.org/licenses/by/4.0/).
Share and Cite
MDPI and ACS Style
Walsh, S.; Reynolds, J.; Abbas, B.; Woods, R.; Searle, J.; Jewell, E.; Elvins, J. Assessing the Dynamic Performance of Thermochemical Storage Materials. Energies 2020, 13, 2202. https://doi.org/10.3390/en13092202
AMA Style
Walsh S, Reynolds J, Abbas B, Woods R, Searle J, Jewell E, Elvins J. Assessing the Dynamic Performance of Thermochemical Storage Materials. Energies. 2020; 13(9):2202. https://doi.org/10.3390/en13092202
Chicago/Turabian StyleWalsh, Sara, Jack Reynolds, Bahaa Abbas, Rachel Woods, Justin Searle, Eifion Jewell, and Jonathon Elvins. 2020. "Assessing the Dynamic Performance of Thermochemical Storage Materials" Energies 13, no. 9: 2202. https://doi.org/10.3390/en13092202
Note that from the first issue of 2016, this journal uses article numbers instead of page numbers. See further details here.