Investigating the Influence of Process Parameters on the Structural Integrity of an Additively Manufactured Nickel-Based Superalloy


1
Institute of Structural Materials, Bay Campus, Swansea University, Swansea SA1 8EN, UK
2
Rolls-Royce plc, P.O. Box 31, Derby DE24 8BJ, UK
*
Authors to whom correspondence should be addressed.
Metals 2019, 9(11), 1191; https://doi.org/10.3390/met9111191
Submission received: 9 October 2019
/
Revised: 29 October 2019
/
Accepted: 4 November 2019
/
Published: 6 November 2019
Abstract
:Additive manufacturing (AM) is a novel near net shape manufacturing technology that joins metallic powders layer upon layer in conjunction with 3D model data and as such offers tremendous potential to a wide range of industrial sectors given its ability to produce highly intricate components with very little material wastage. Subsequently, the aerospace industry has become particularly interested in utilising AM as a means of manufacturing nickel-based superalloys for high-temperature applications, such as non-rotating components within gas turbine engines, which are traditionally fabricated through traditional cast and wrought methodologies. As a result of this, a detailed understanding of the influence of key process variables on the structural integrity of the different experimental builds is required. A semi-empirical quantitative approach for melt track analysis has been conducted and the impact on melt track sizing and defect forming mechanisms in the as-built and heat-treated condition is investigated.
1. Introduction
Nickel-based superalloys are a branch of highly engineered alloys that display impressive capabilities of withstanding high temperatures, stresses and corrosive environments [1]. It is for these reasons that they are heavily incorporated within the aerospace industry, particularly within gas turbine engines in sections that can surpass arduous temperatures of over 1000 °C [2]. Although nickel superalloys are typically manufactured using cast and wrought methodologies, the use of alternative technologies such as Additive manufacturing (AM) is being explored due to the many benefits that the process has to offer [3]. AM is a near-net shape manufacturing technology which lends itself to the aerospace industry for both component manufacture and repair. The use of laser powder bed fusion (LPBF) is incorporated in conjunction with computer aided design (CAD) data in order to melt powder layer by layer on a 2D basis until a fully 3D component is fabricated [4]. In comparison to traditional methodologies, AM offers the unique ability to produce highly intricate components with very little to no material wastage. However, given the prevalence of differing grain growth mechanisms, challenges such as anisotropic behaviour and residual stressing are yet to be fully understood and thus give rise to concerns regarding structural integrity [5]. Subsequently, an understanding of the influence of key process variables has arisen in parallel and there is ongoing research in order to ascertain the influence of individual process parameters such as beam speed, beam power and hatch spacing both individually and in conjunction with one another [6,7].
Given the microstructural complexity of AM from a metallurgical standpoint, post-processing treatments such as hot isostatic pressing (HIP’ing) and heat treatments (HT) are heavily utilised within industry today to produce a final product of appropriate structural integrity. Although typically beneficial in regard to reducing microscale defects such as cracks or porosity, the existence of high residual stressing can lead to some materials being difficult to post-process [8]. This paper will look to investigate the influence of linearly normalised process parameters such as beam speed and power on melt tracks sizes, variability and structural integrity both in the as-built (AB) and post-processed condition.
2. Materials and Methods
2.1. Material
Nickel-based superalloys typically comprise of two major constituents, gamma (γ), a continuous matrix of face centred cubic (FCC) structured nickel, within which other phases are contained, and gamma prime (γ′), a hard intermetallic phase which gives rise to nickel’s main strengthening mechanism of precipitation strengthening [9]. Given this mechanism, the volume fraction of γ′ essentially acts as a function of the material’s strength, with high contents displaying greater strength and subsequently the ability to maintain desirable properties at higher temperatures [10]. However, it is worth noting that higher strengths and temperature capabilities act as a trade-off for ductility and consequently weldability, which gives rise to challenges considering AM is a multiweld process.
The material of interest within this paper is CM247LC, a high γ′ Ni-based superalloy developed by the Cannon Muskegon Corporation in the late 1970s, designed as a low carbon derivative of MARM247 [11]. The chemical composition is displayed in Table 1. Given the aforementioned challenges attributed to high γ′ superalloys, the understanding of material discontinuities, their associated mechanisms and how they can be alleviated is of significant interest. Therefore, a deeper understanding of both individual parameters and their interaction is of major importance.
2.2. Methodology
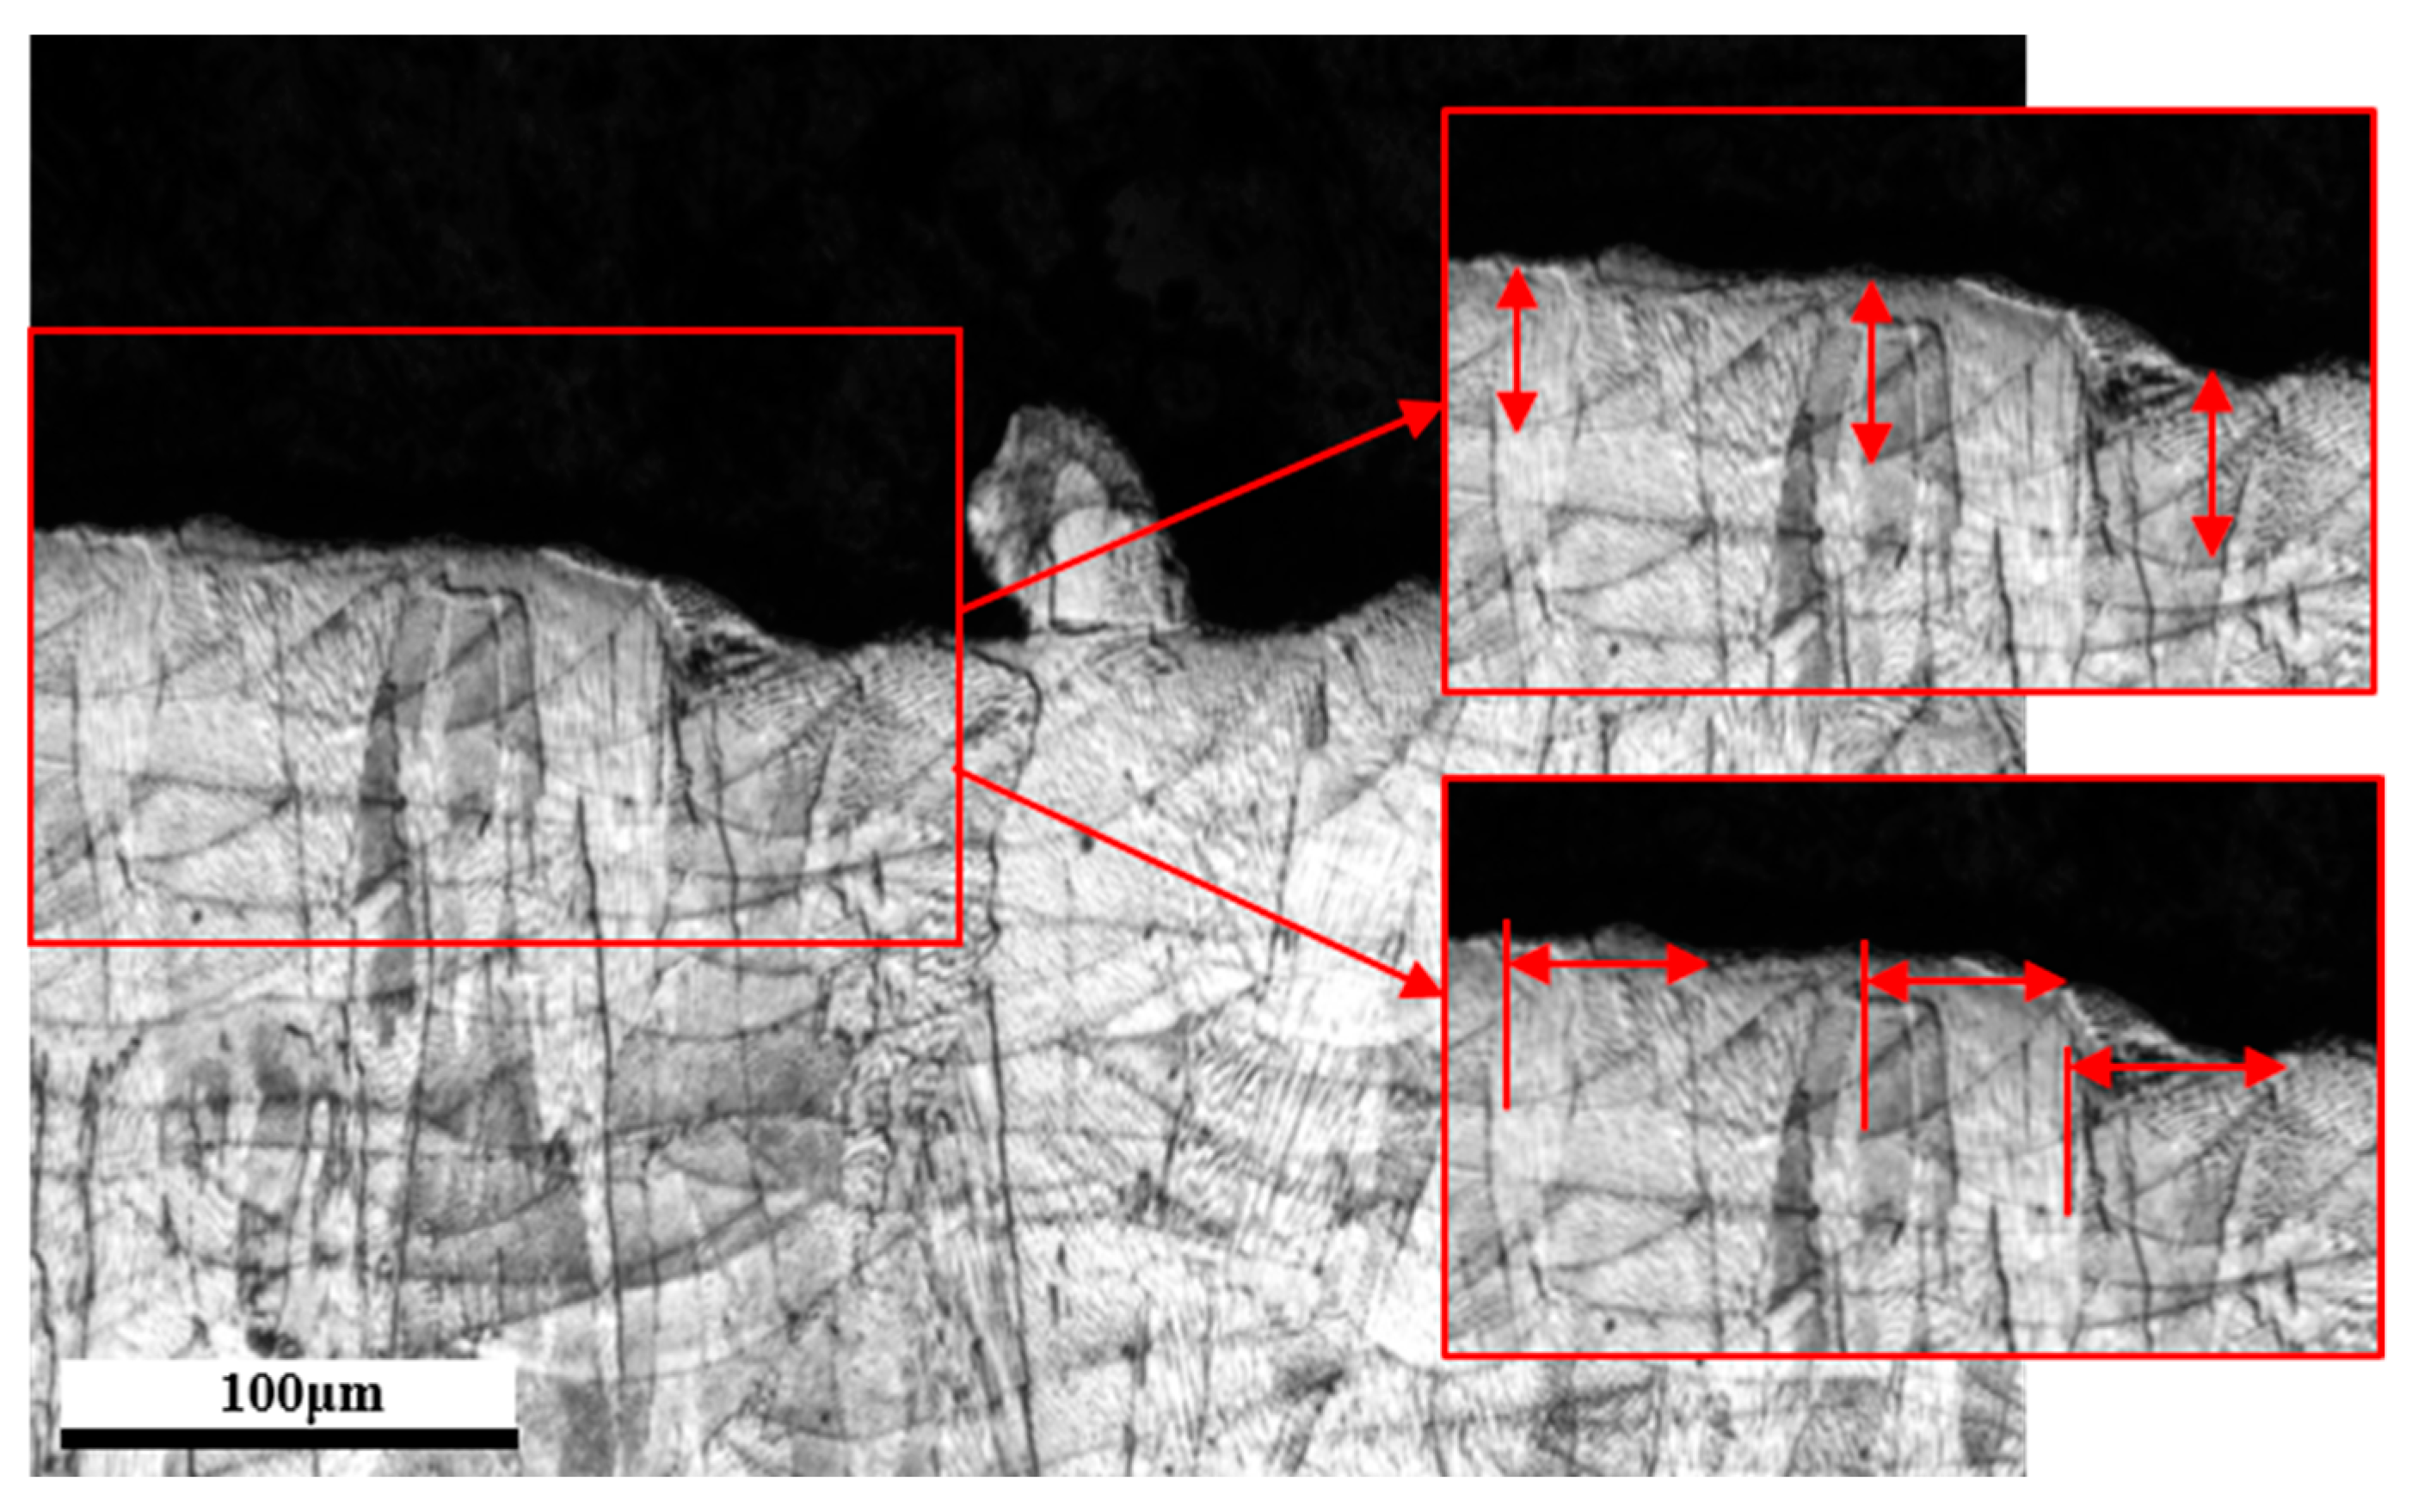
In this research, a Design of Experiments (DOE) was formulated consisting of 30 LPBF CM247LC variants that were fabricated across two separate build plates. One build plate was left in the AB condition, whilst the other set of samples was subjected to a series of HIP’ing/HT cycles. The AB samples were prepared through a series of metallographic procedures as shown in Table 2 and etched using a high concentration Kallings Reagent (5 g CuCl2, 100 mL HCl, 100 mL ethanol). A semi-empirical approach to melt track analysis was conducted across all 30 variants, with 50–70 manual measurements conducted for both height and width at the surface of the material. These measurements were taken with the procedure depicted in Figure 1, where melt track height is taken as the distance from the minimum point of the solidified melt pool to the surface of the material, and width is taken as the distance from the minimum point of the solidified melt pool to where the circumference of the melt pool intersects the surface, and then doubled.
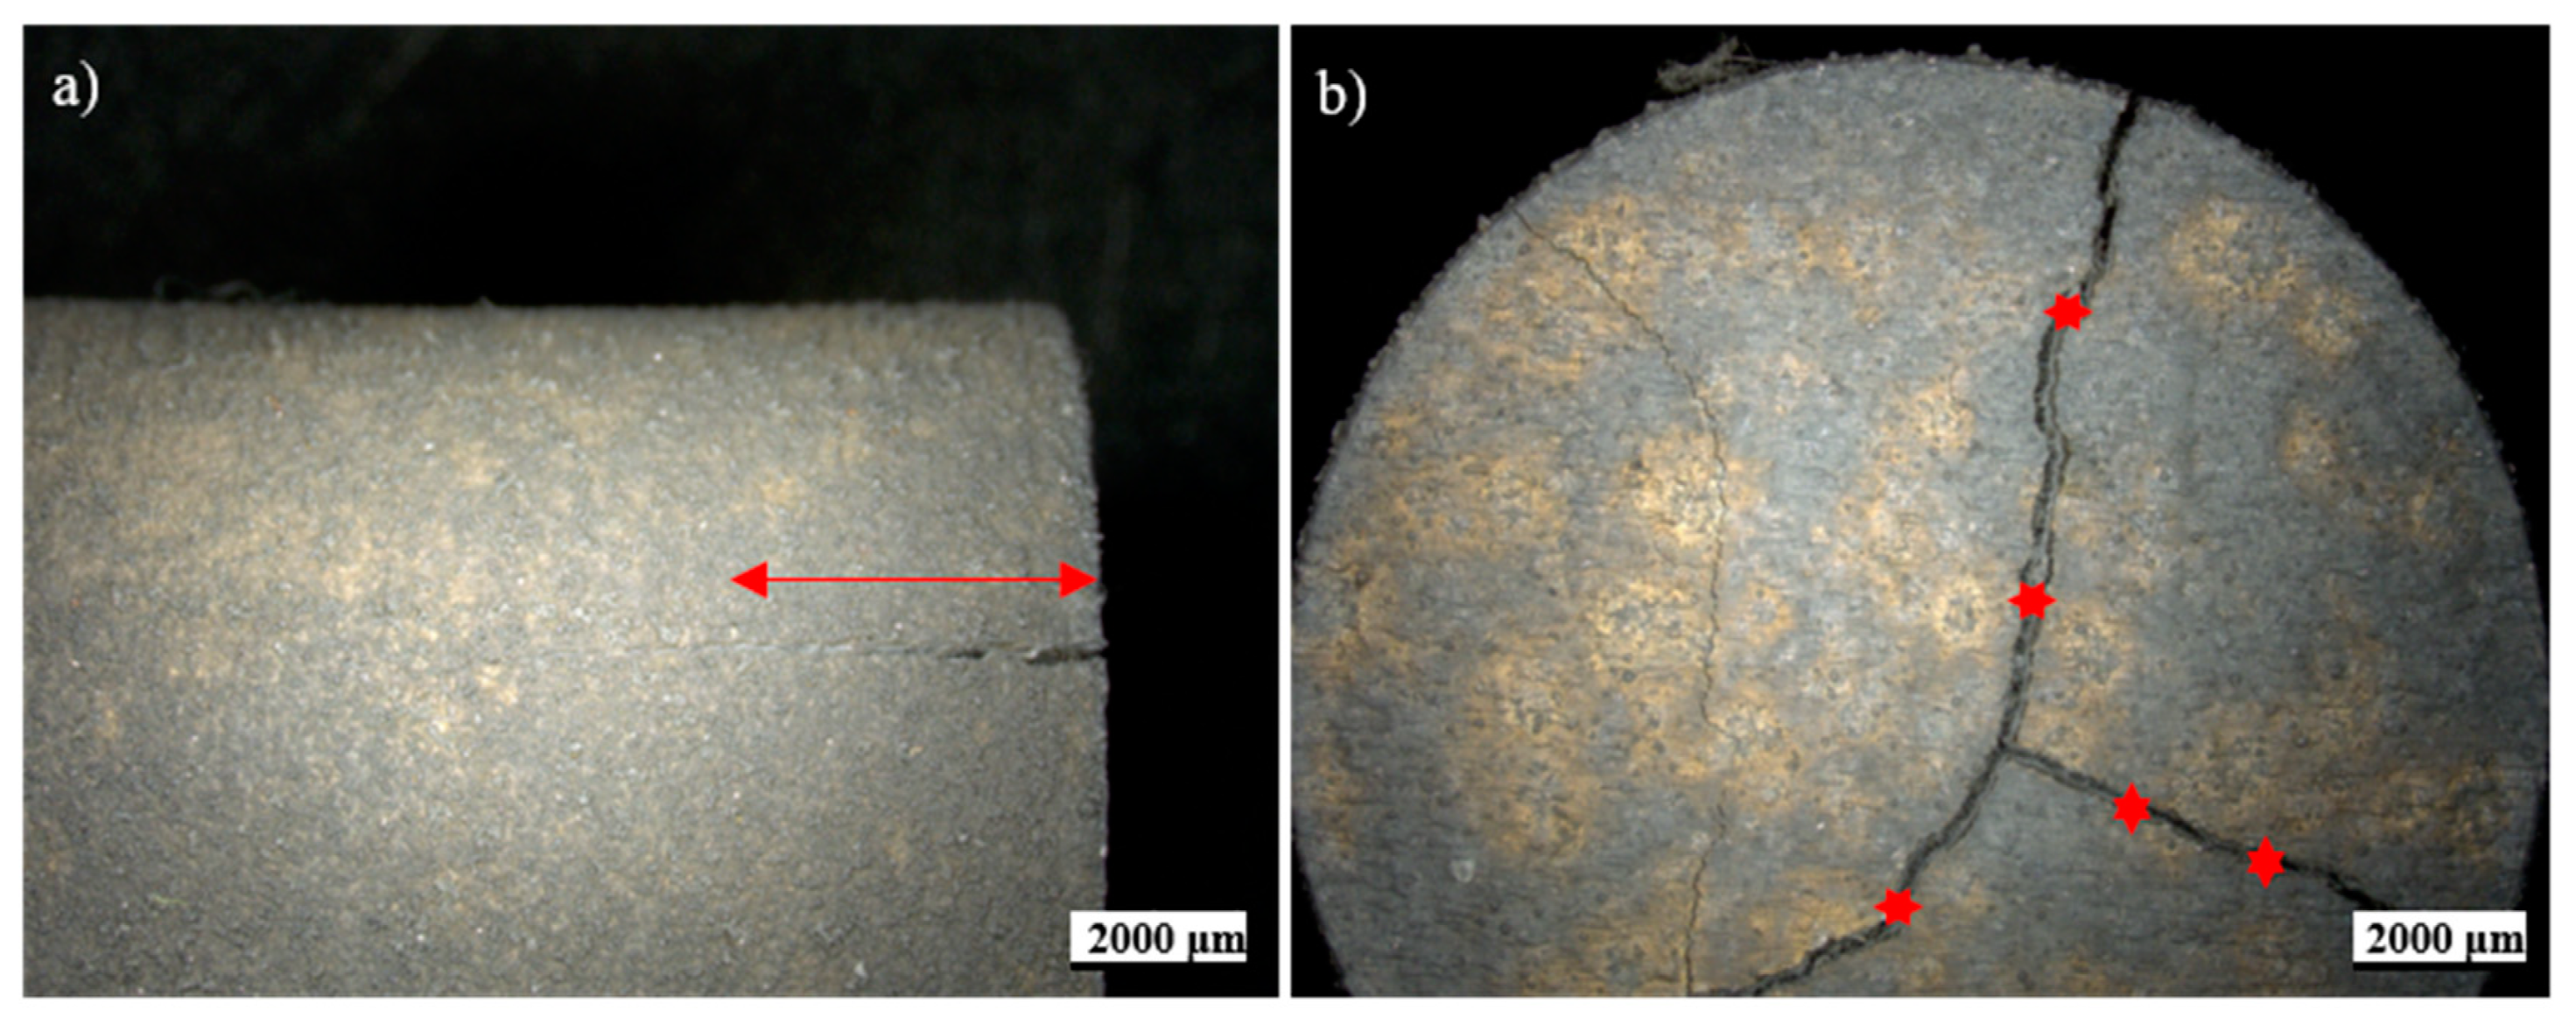
In addition to melt track analysis, the quantification of material discontinuities in both the AB and HIP’ed/HT state were carried out across all samples. Measurements were taken from a series of 1.5 cm diameter, 4 cm length HIP’ed rods, where the severity of cracking was subcategorised into cracking depth and average cracking width as depicted in Figure 2. Microcracking measurements were taken from several high-resolution (200×) images captured from each variant where features were recorded in a grid format and stitched/blended together using an automated ZEISS Smartzoom 5 (Zeiss, Oberkochen, Germany). From there, a large enough section was selected in order to ensure that the sampling size would produce statistically valid information that is representative of the material. This region was thresholded using ImageJ software (1.51k, National Institutes of Health, Bethesda, MD, USA) with particle analysis conducted from a size range of 2 μm2 to infinity, generating raw data that were then split, with a circularity of 0.5 being considered the key defining criteria, providing distinction between a crack and a pore. The comparative data compared are % area, feature count, average feature size and average aspect ratio (AR, ratio of width to height) and this information is correlated to normalised process parameters such as beam speed (v*), beam power (q*) and energy density (E*) which is defined as q*/v*l* where l* is the layer thickness. Furthermore, the impact of alternative process variables such as position within the build plate and proximity to the argon gas flow, powder recoater and chamber door was also investigated.
3. Results
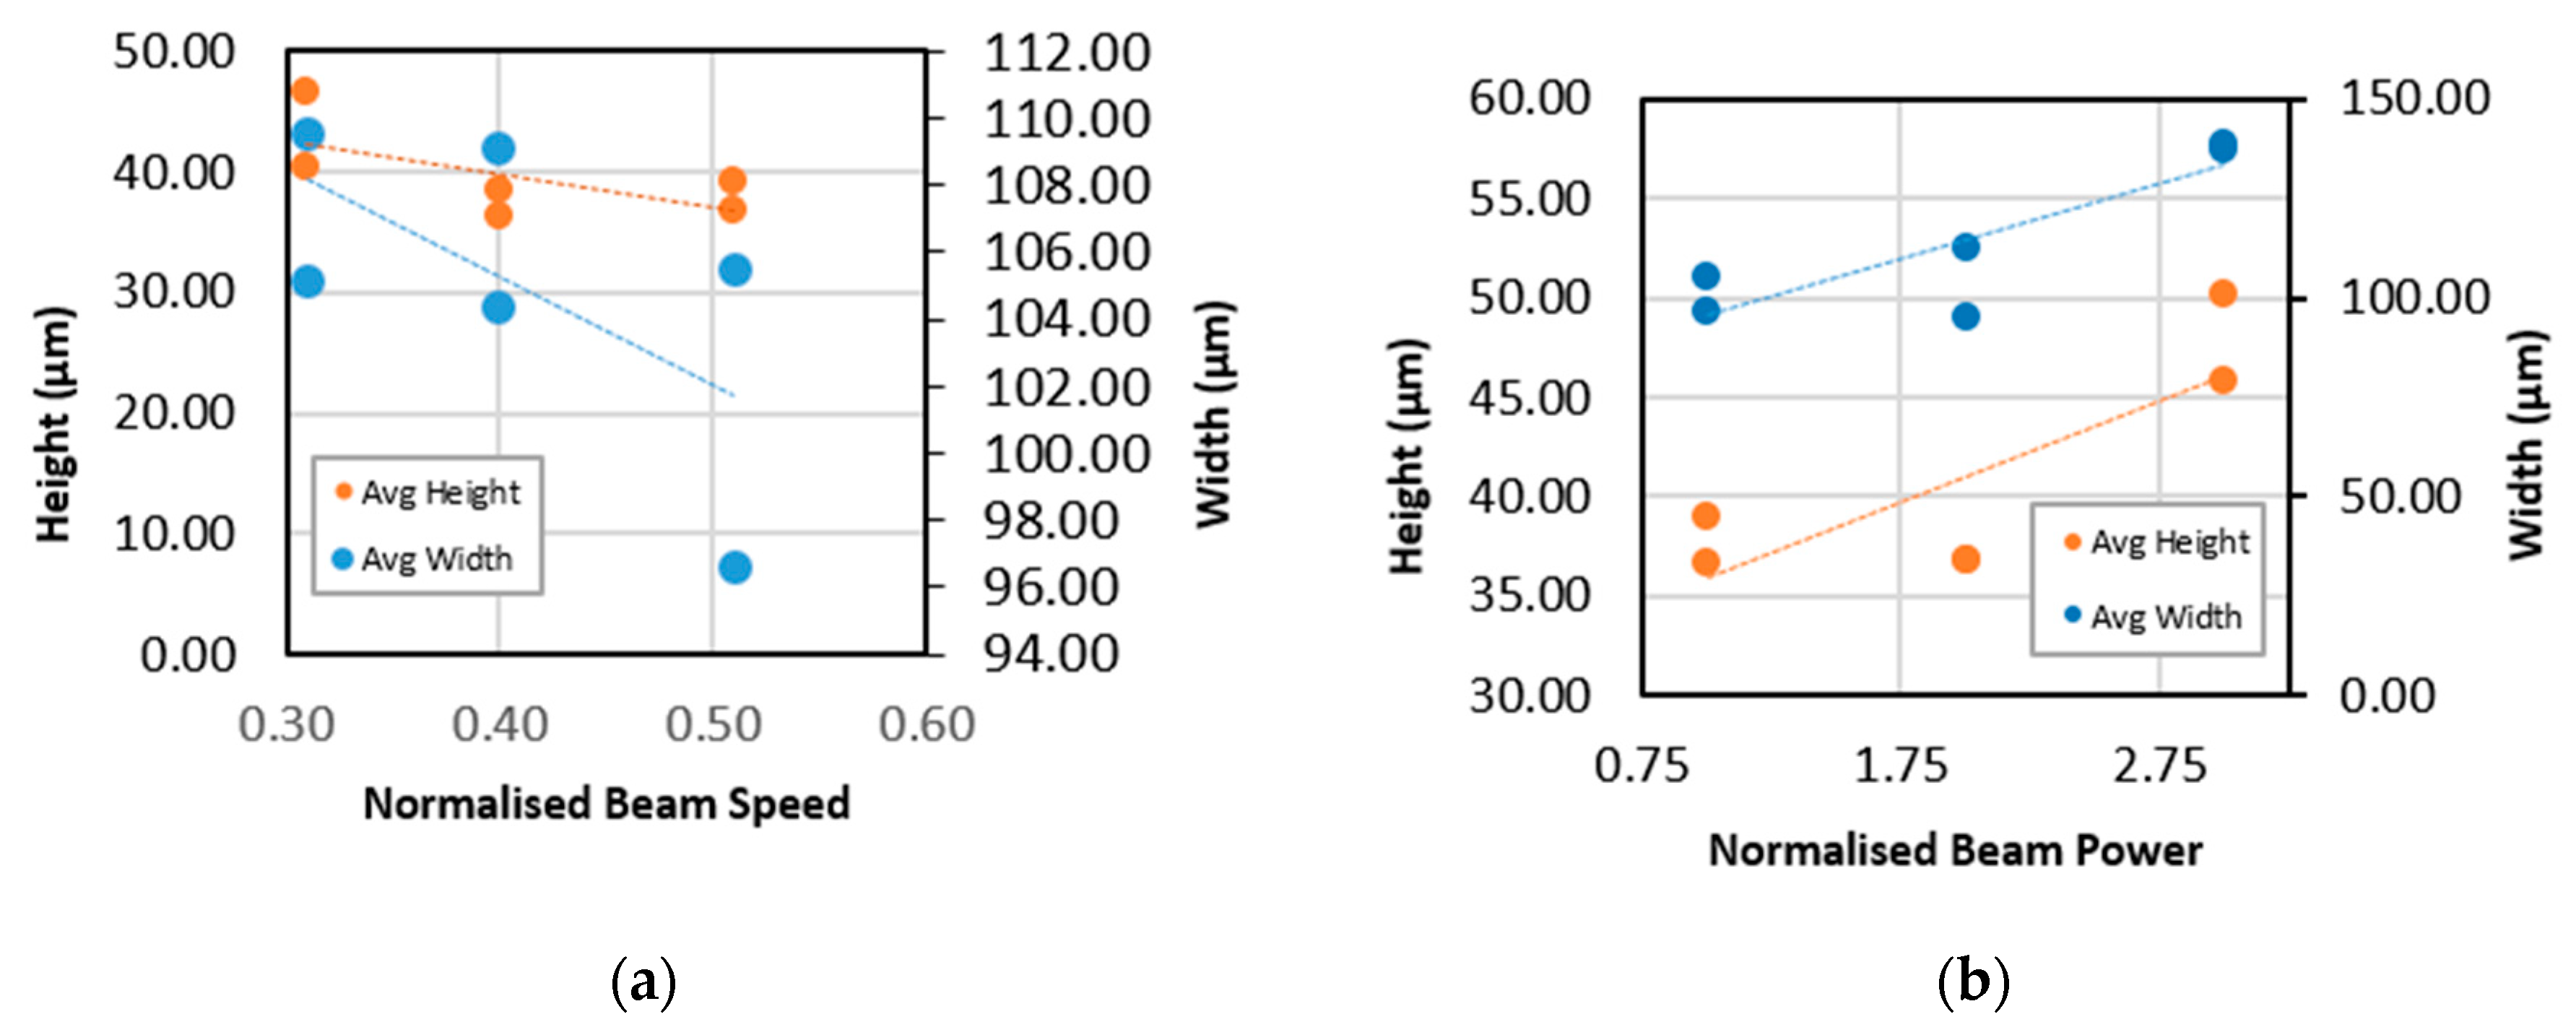
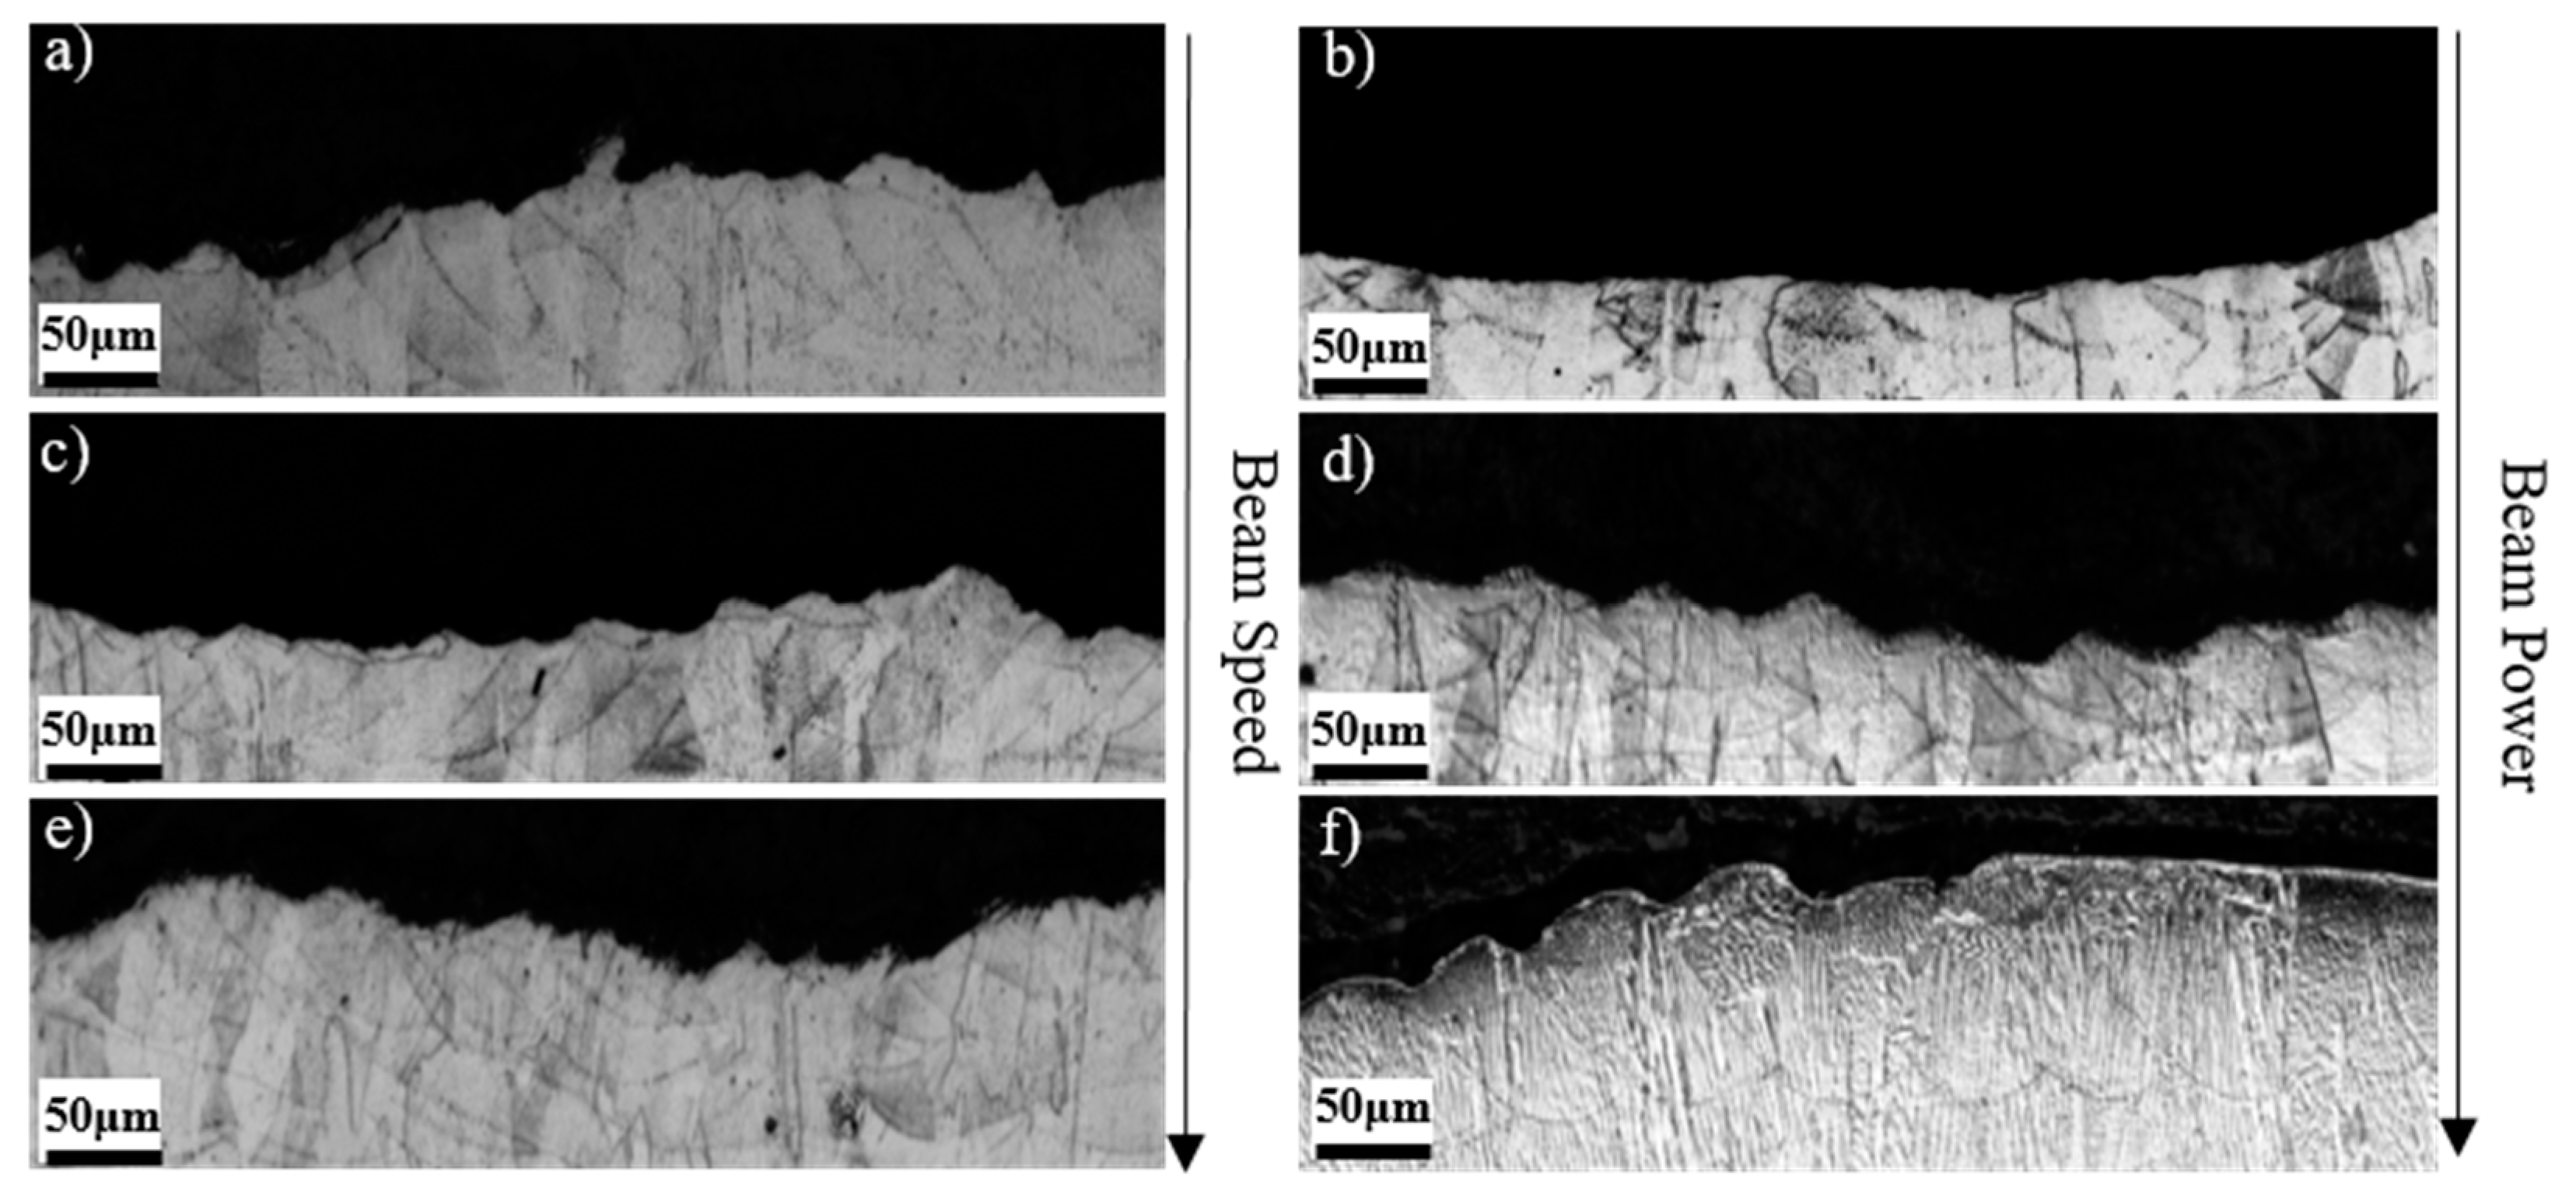
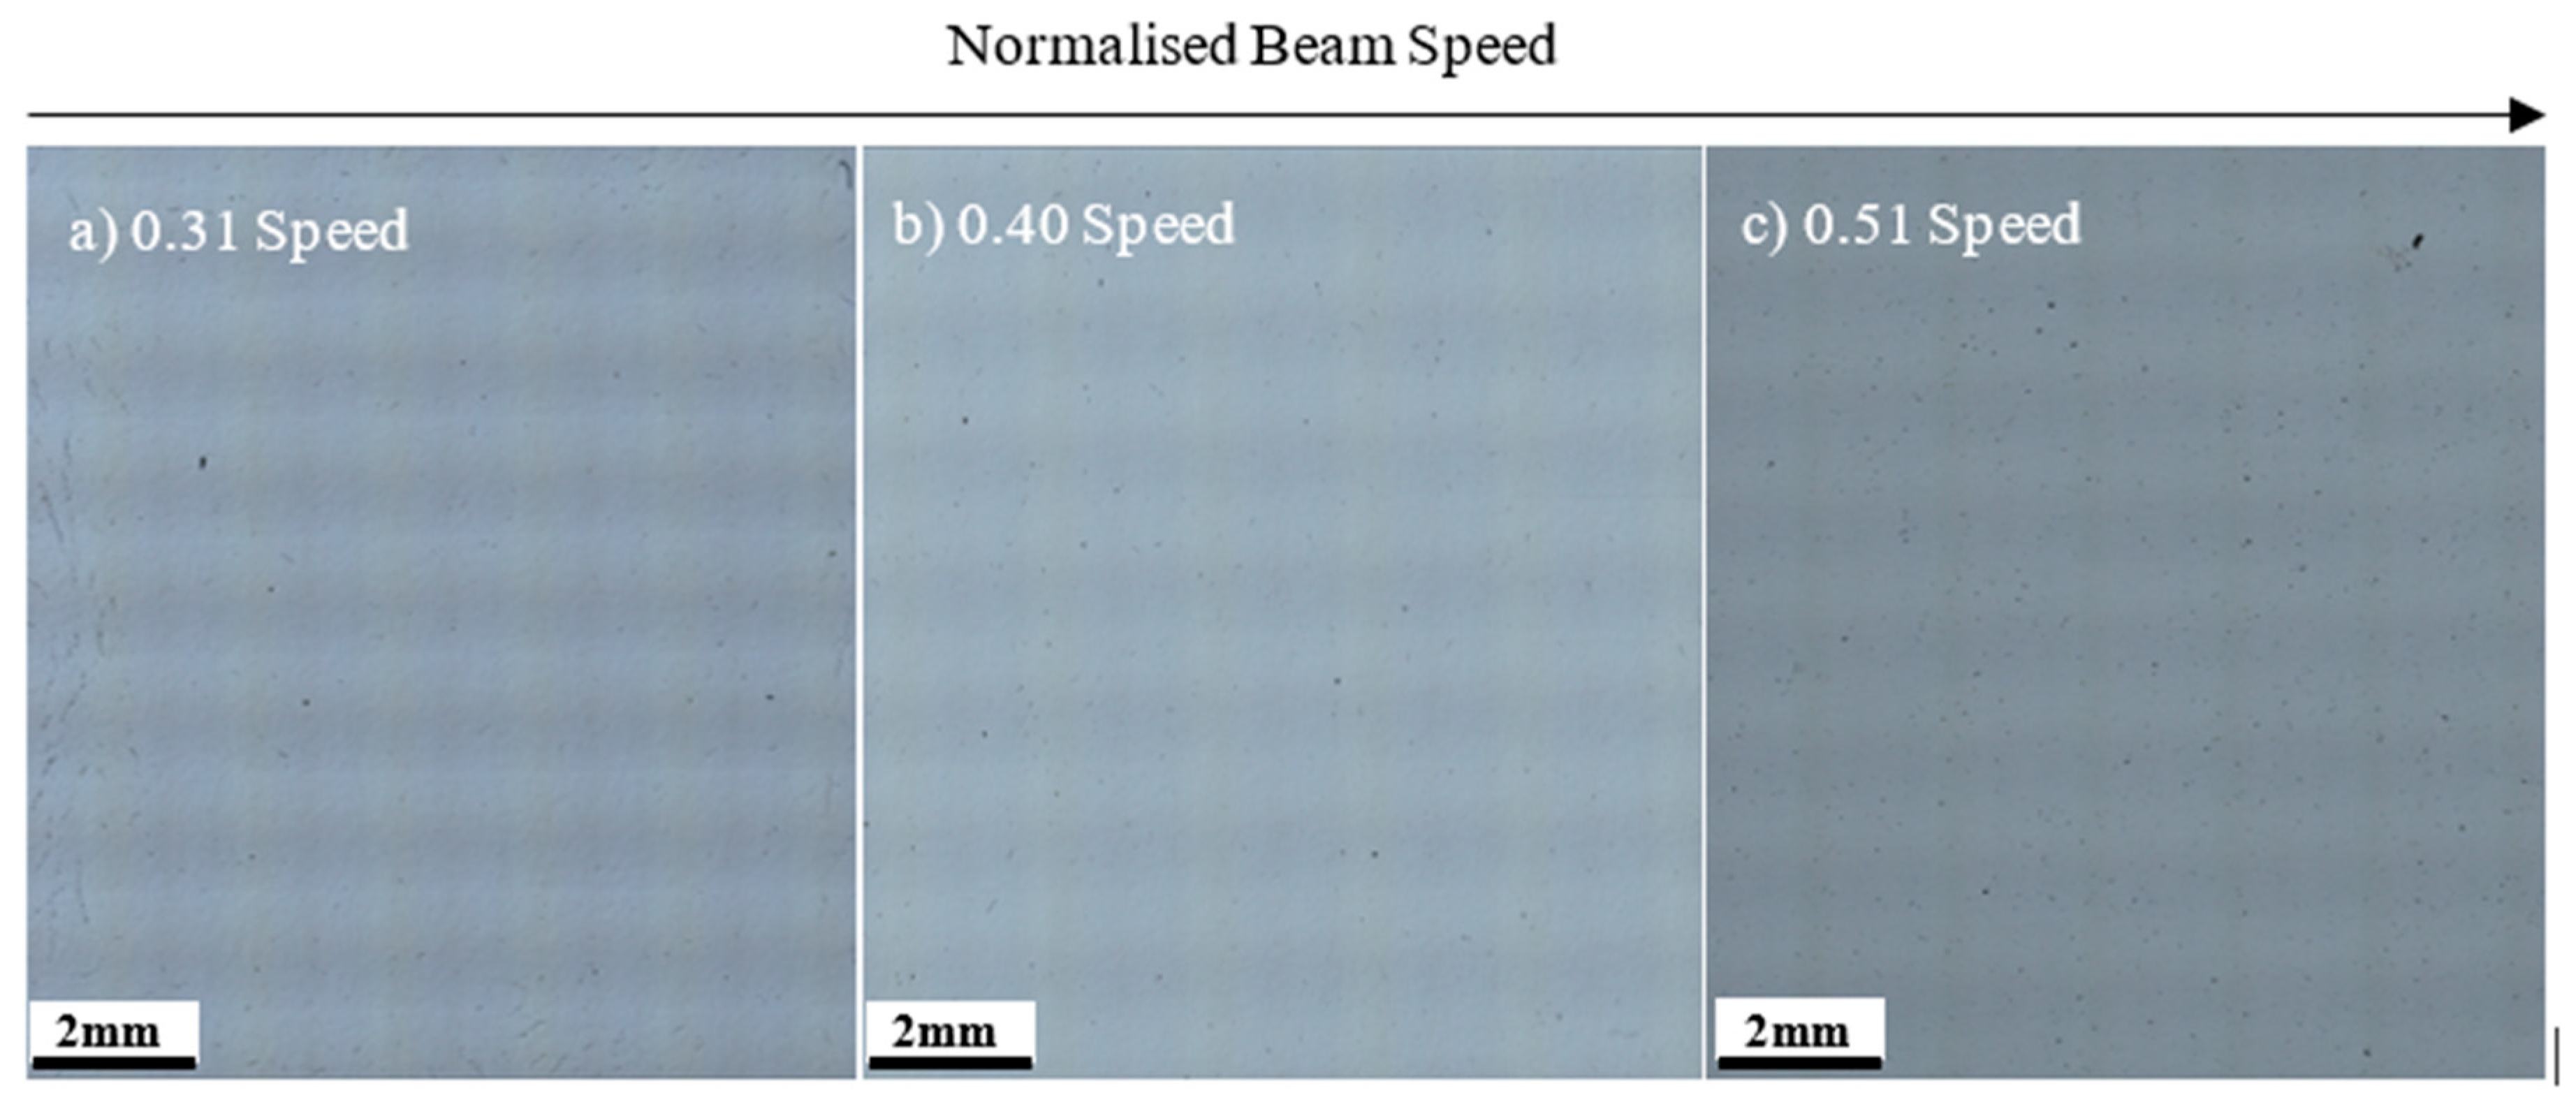
A summation of 3000–3500 manual melt track measurements was recorded across the LPBF CM247LC variants. Figure 3a highlights that as normalised beam speed increases, melt track sizing decreases both for height and width, in contrast to the behaviour given in Figure 3b where, as normalised beam power increases, melt track sizing increases. This demonstrates the inverse relationship between these two parameters, subsequently supporting energy density principles discussed in previous literature [12]. This can be further illustrated with the use of Scanning Electron Microscopy (SEM) (Hitatchi SU3500, Tokyo, Japan) as shown in Figure 4, where low beam speeds give rise to a coarsened melt track, as seen in Figure 4a, and higher speeds promote a finer track, as seen in Figure 4c,e. Furthermore, Figure 4 displays this inverse relationship, with low beam powers displaying smaller track sizing which subsequently increases as beam power increases. However, despite the relatively linear relationships observed, it can be witnessed that there is some degree of melt track variance for paired process parameters, as will be discussed later, particularly seen in Figure 4a where higher normalised beam speeds (0.51) give rise to a larger degree of variability for melt track width.
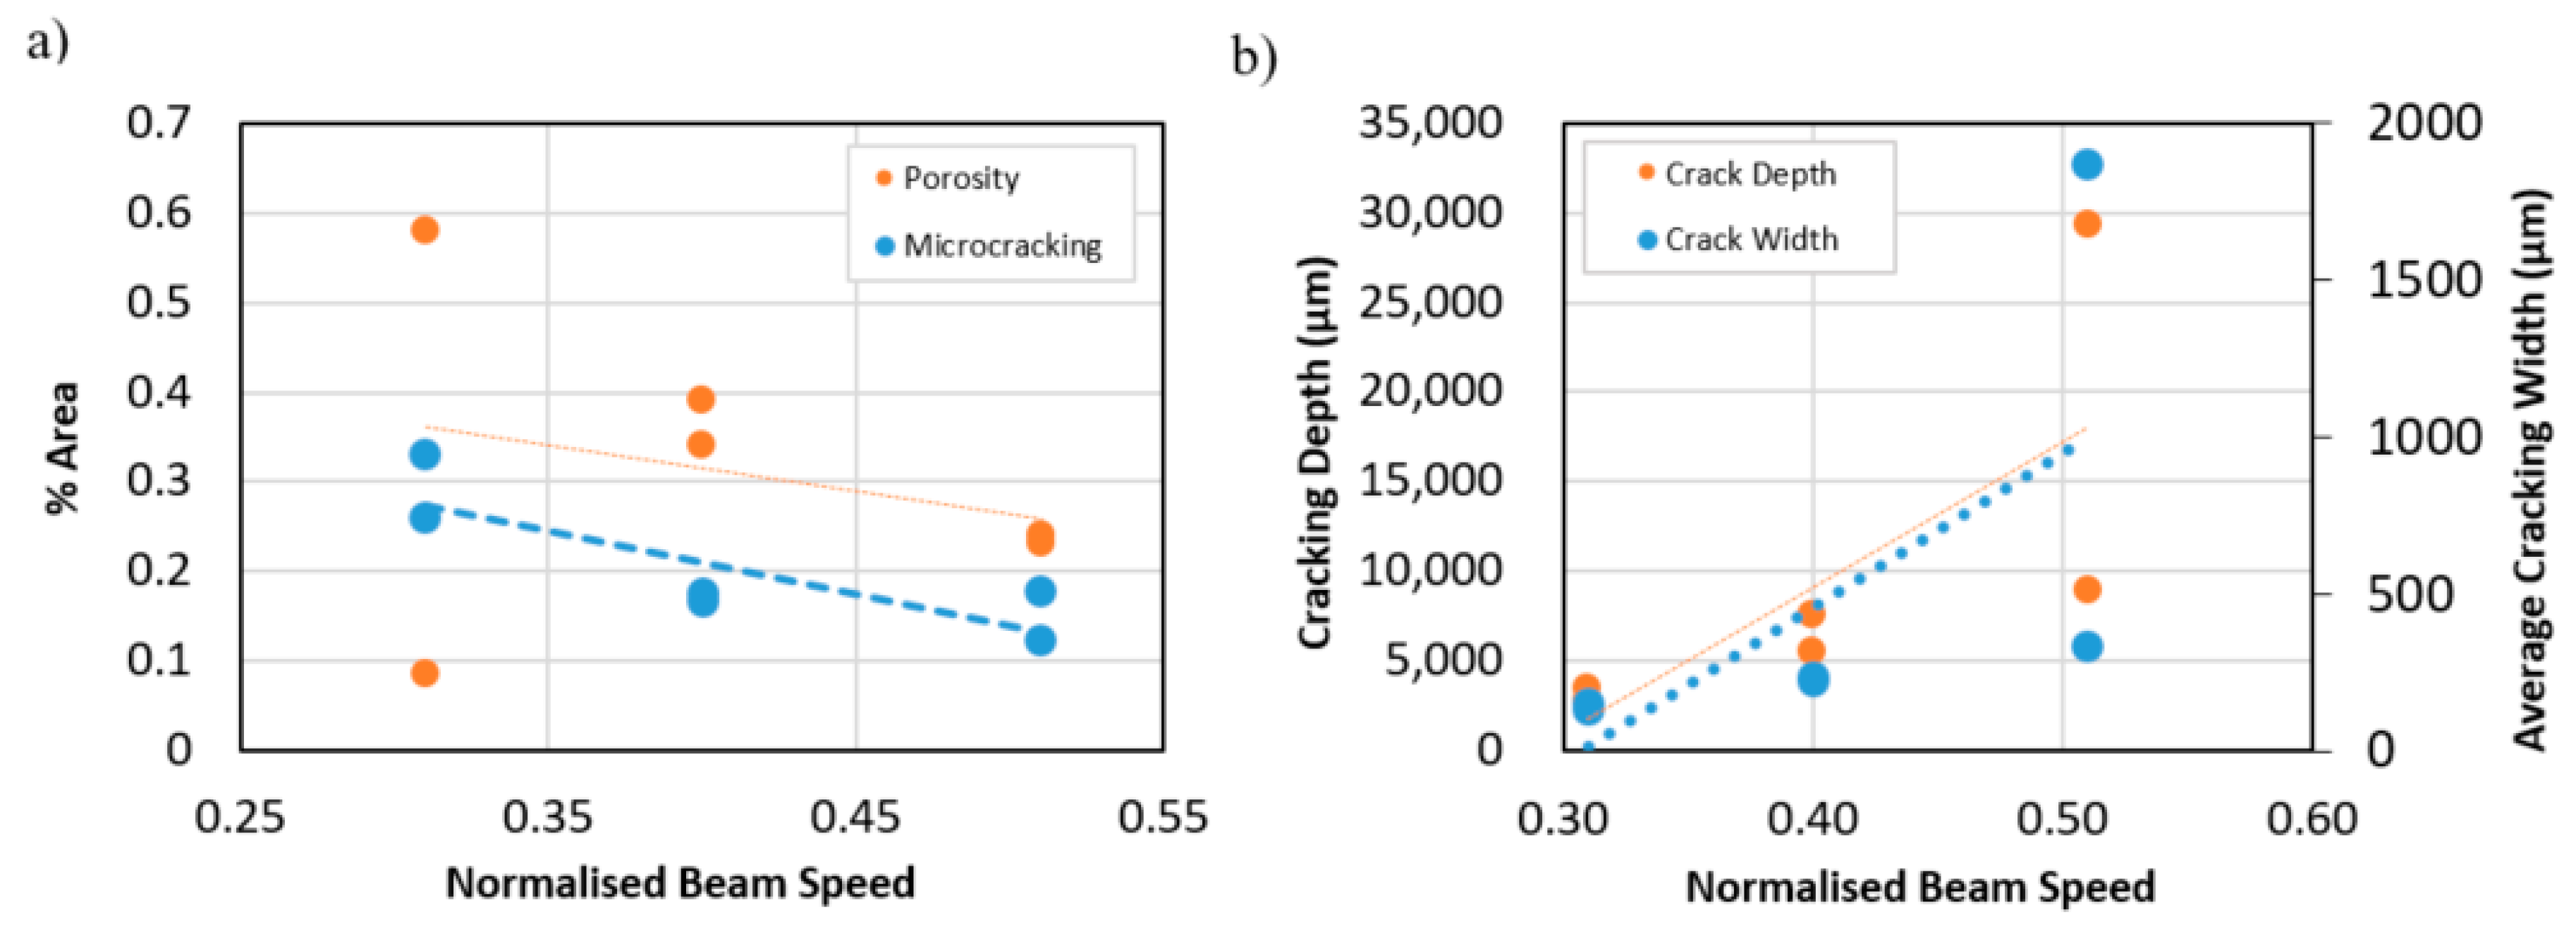
The individual parameters were also shown to have an influence on the formation of material discontinuities in both the AB and HIP’ed conditions. Figure 5a displays a linear relationship where increases in normalised beam speed give a notable decrease in both porosity and microcracking. This is attributed to the inverse relationship between normalised beam speed and E*, where high energies give rise to both cracking mechanisms and the formation of porosity. From a cracking perspective, solidification cracking occurs due to shrinkage and thermal contraction caused by contact with previously deposited layers, thus generating tensile stresses that often exceed the strength of the material. In addition to this, rapid heating can result in low melting point carbides liquidating, reducing grain boundary strength and aiding dislocation movement which subsequently leads to stress accumulation and consequently intergranular cracking. Furthermore, an increase in the area percentage of porosity in relation to lower normalised beam speed is attributed to the influence of high E* values, which can lead to excessive keyholing, a mechanism in which keyholes collapse and leave voids containing entrapped gas, leading to the formation of spherical porosity. The linear relationships that have been observed are derived and further validated with the use of high-resolution optical images that have been stitched and blended, as shown in Figure 6.
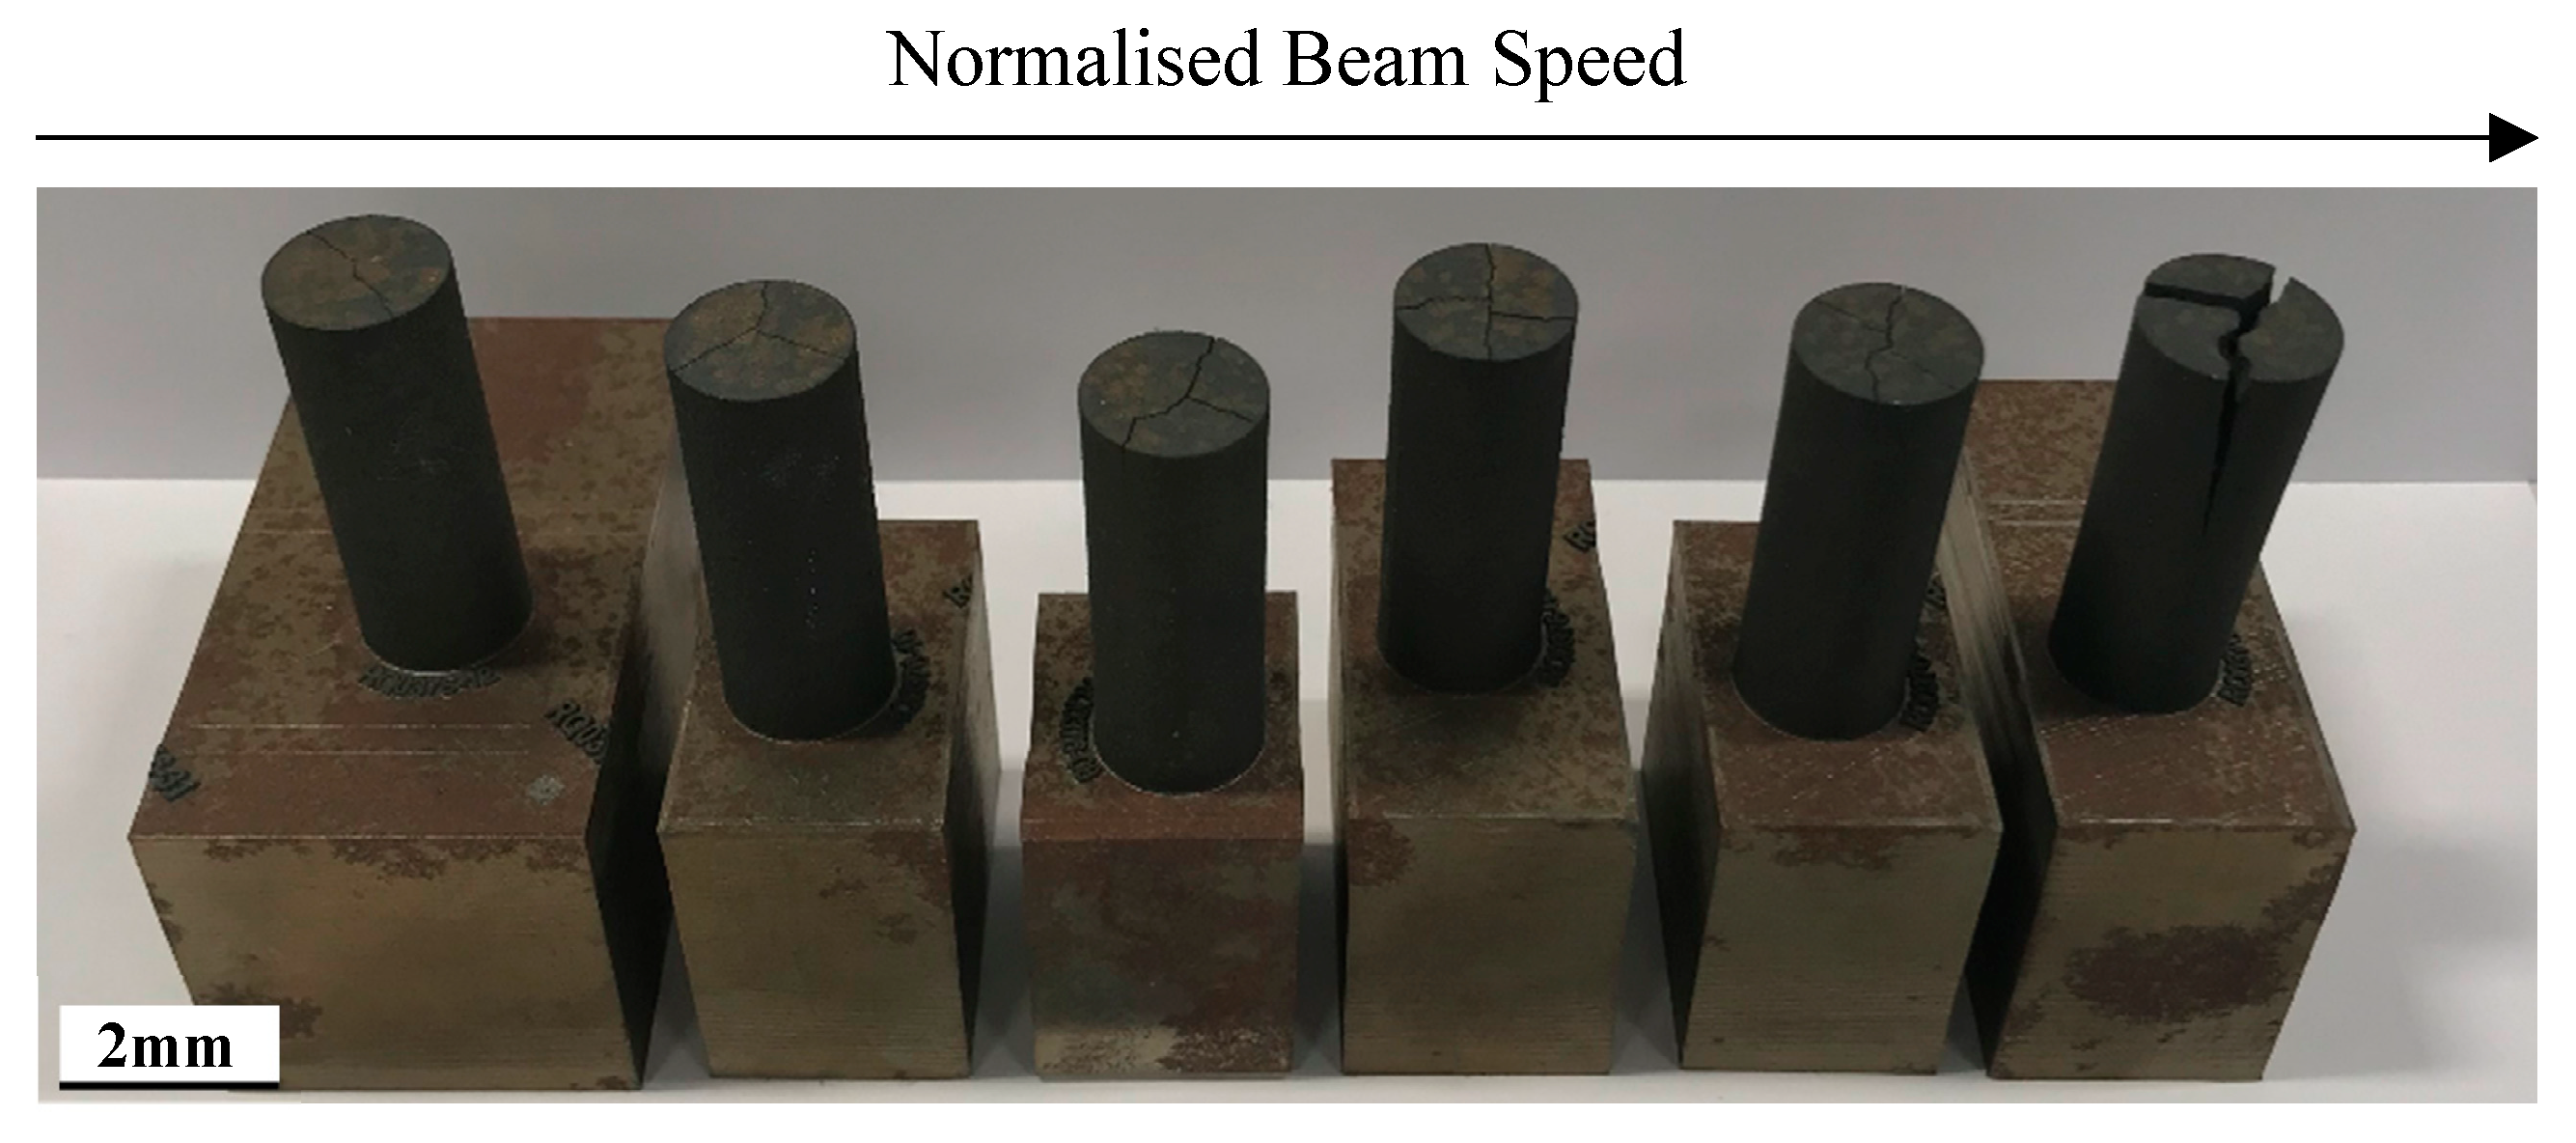
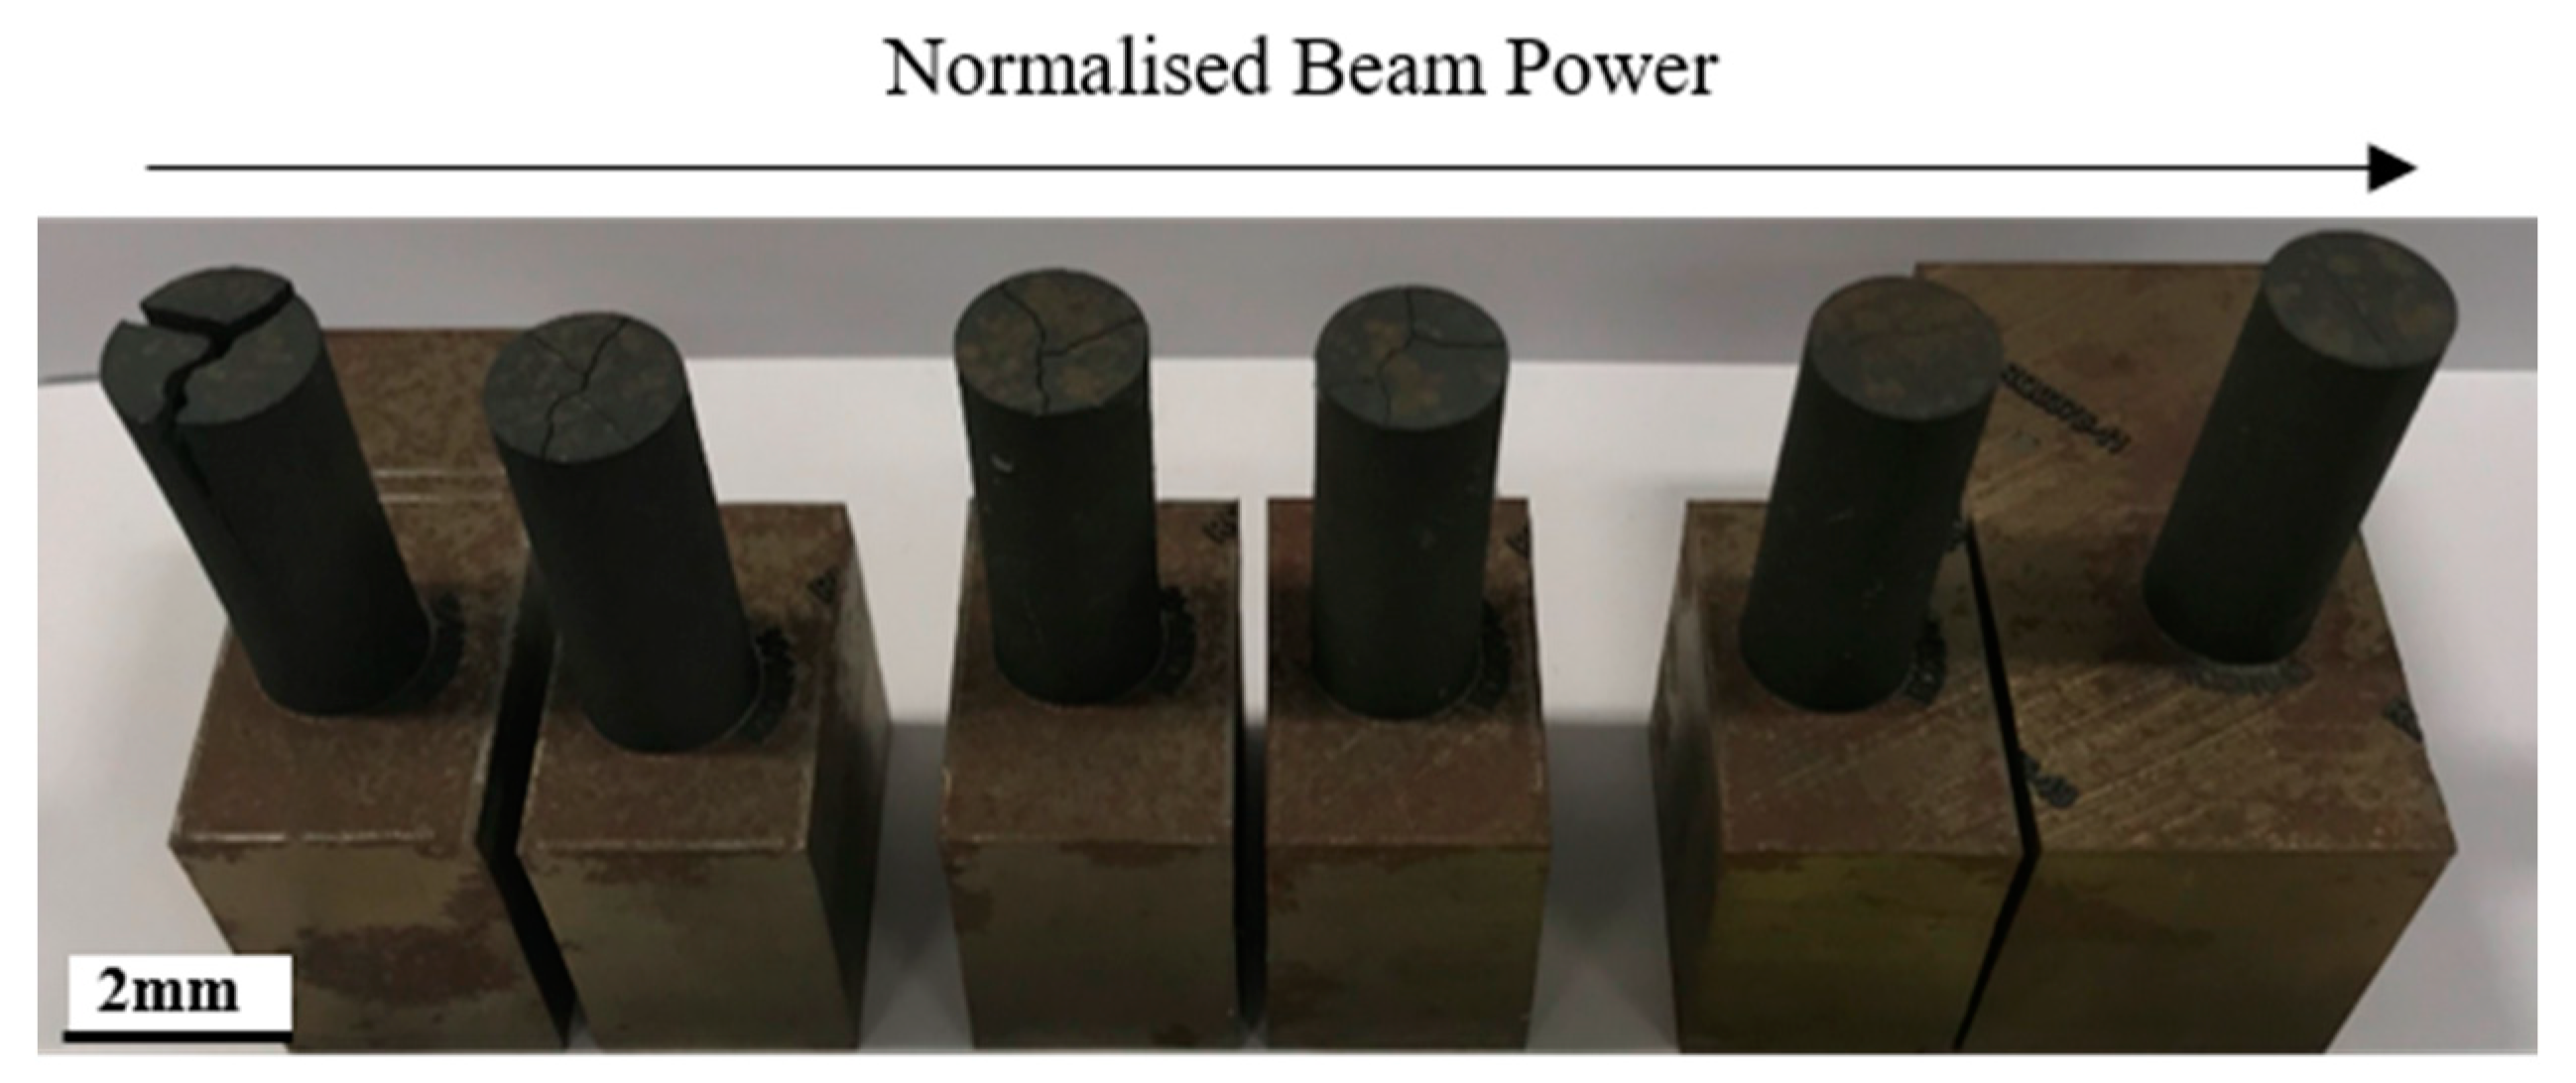
Figure 7 shows the implications of normalised beam speed on tearing induced as a consequence of HIP’ing. A linear relationship is observed where, as beam speed increases, the severity of macrocracking increases substantially. The main hypothesis used as an explanatory factor for the inverse relationship observed between microcracking and macrocracking is that it acts as a stress reliever to residual stressing caused through exceptionally high cooling rates, thus explaining why AB materials which appear to have low levels of microcracking tend to crack more severely post HIP. The influence of normalised beam speed on the severity of macrocracking is further illustrated in Figure 7, with the image providing an indication as to the increasing magnitude of fracture observed in accordance with the increasing normalised beam speeds (from left to right).
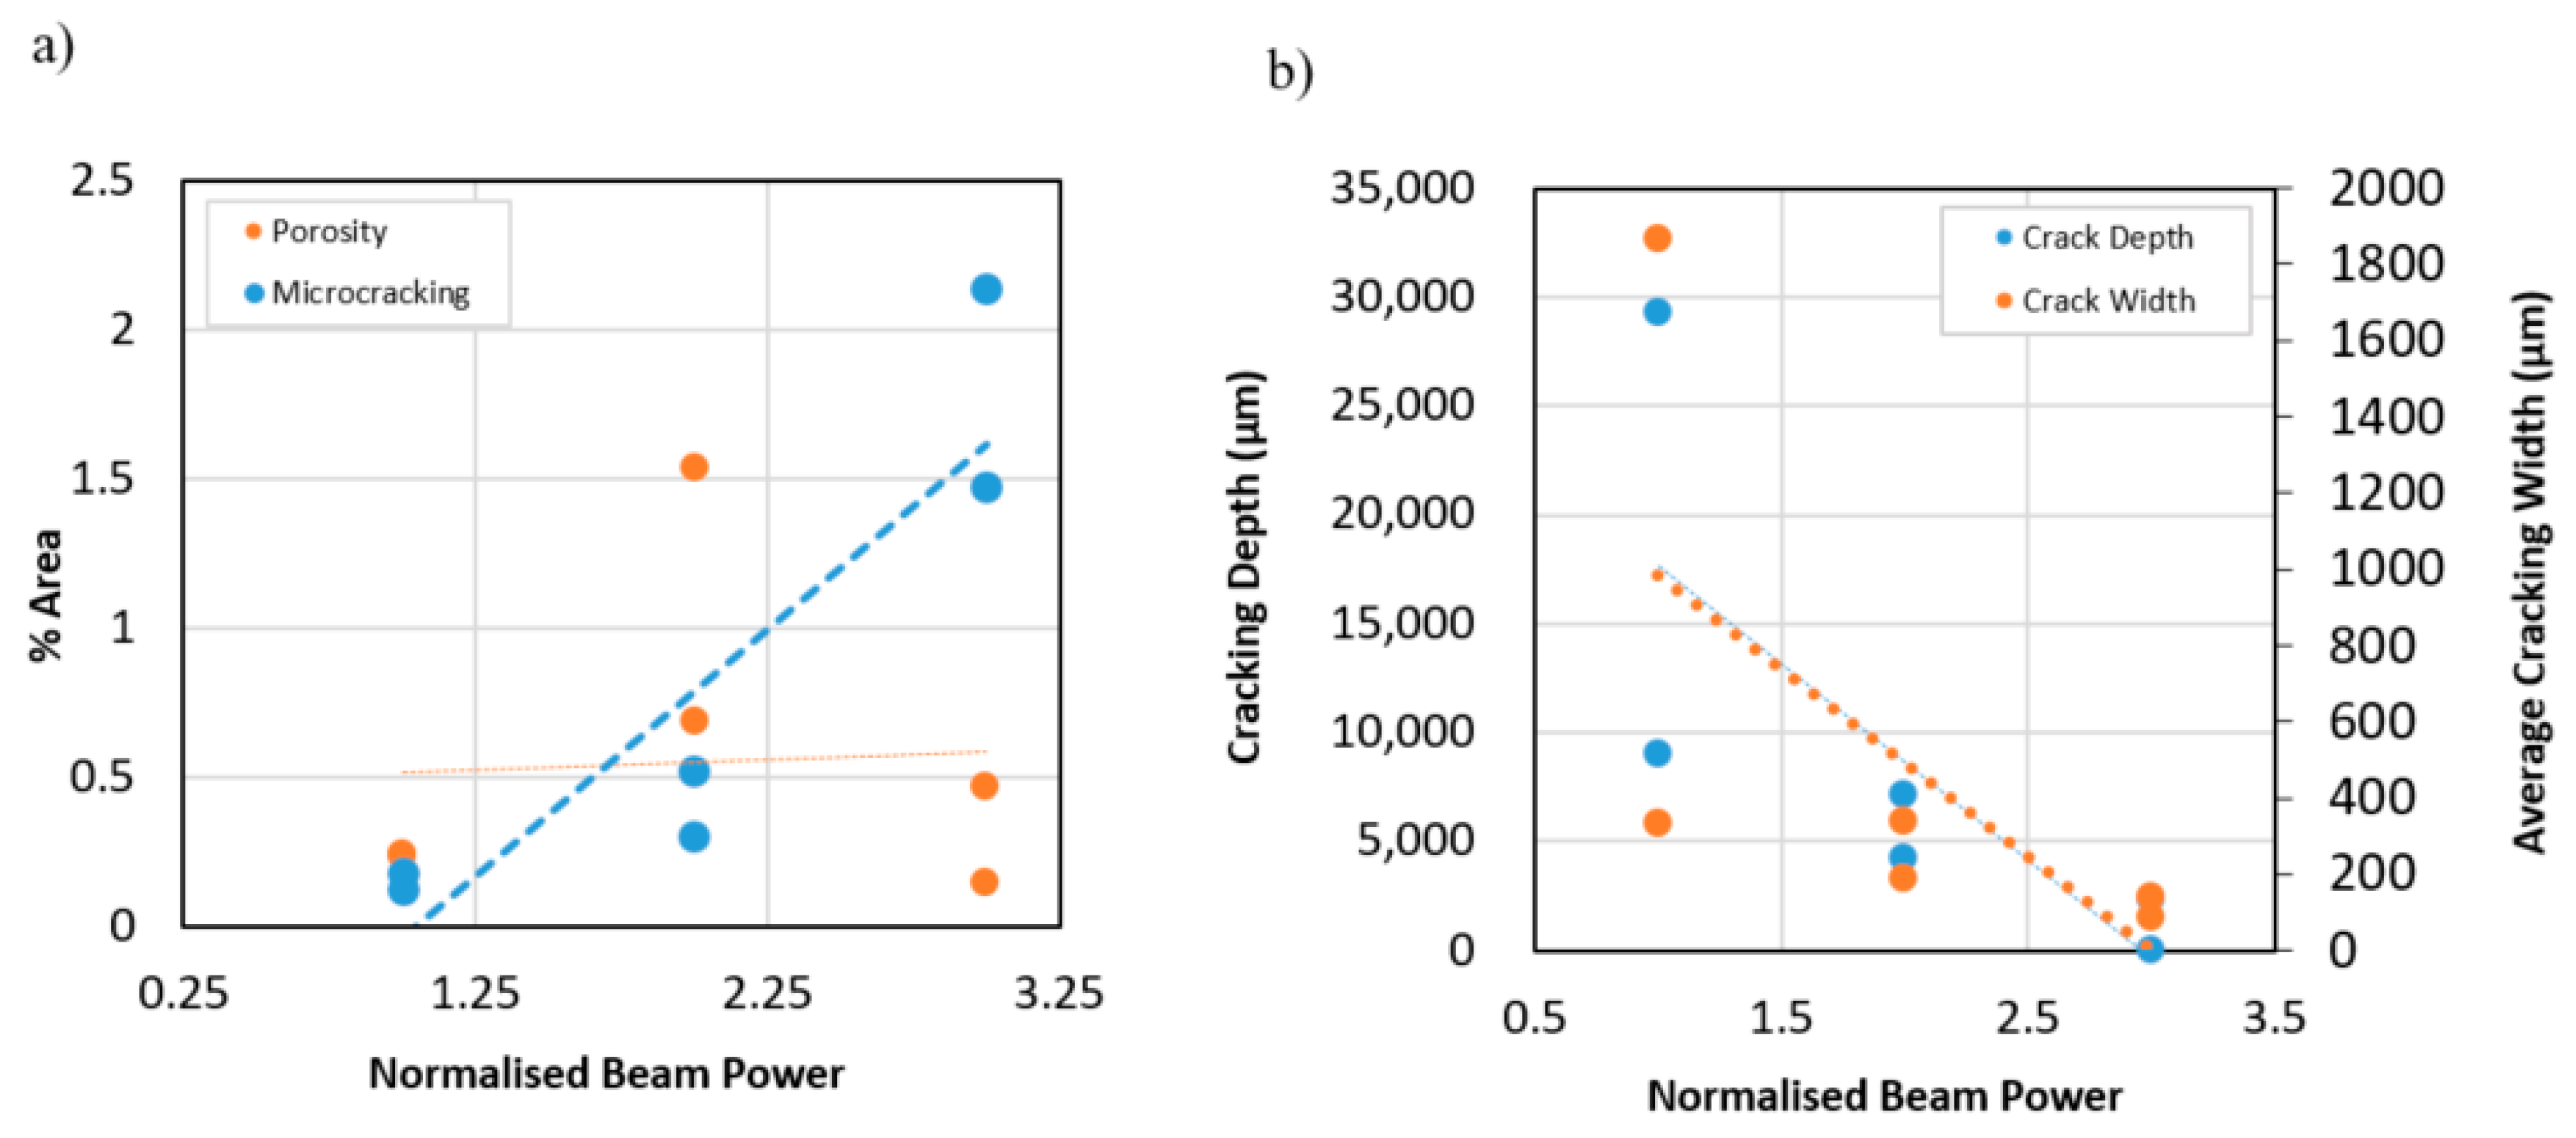
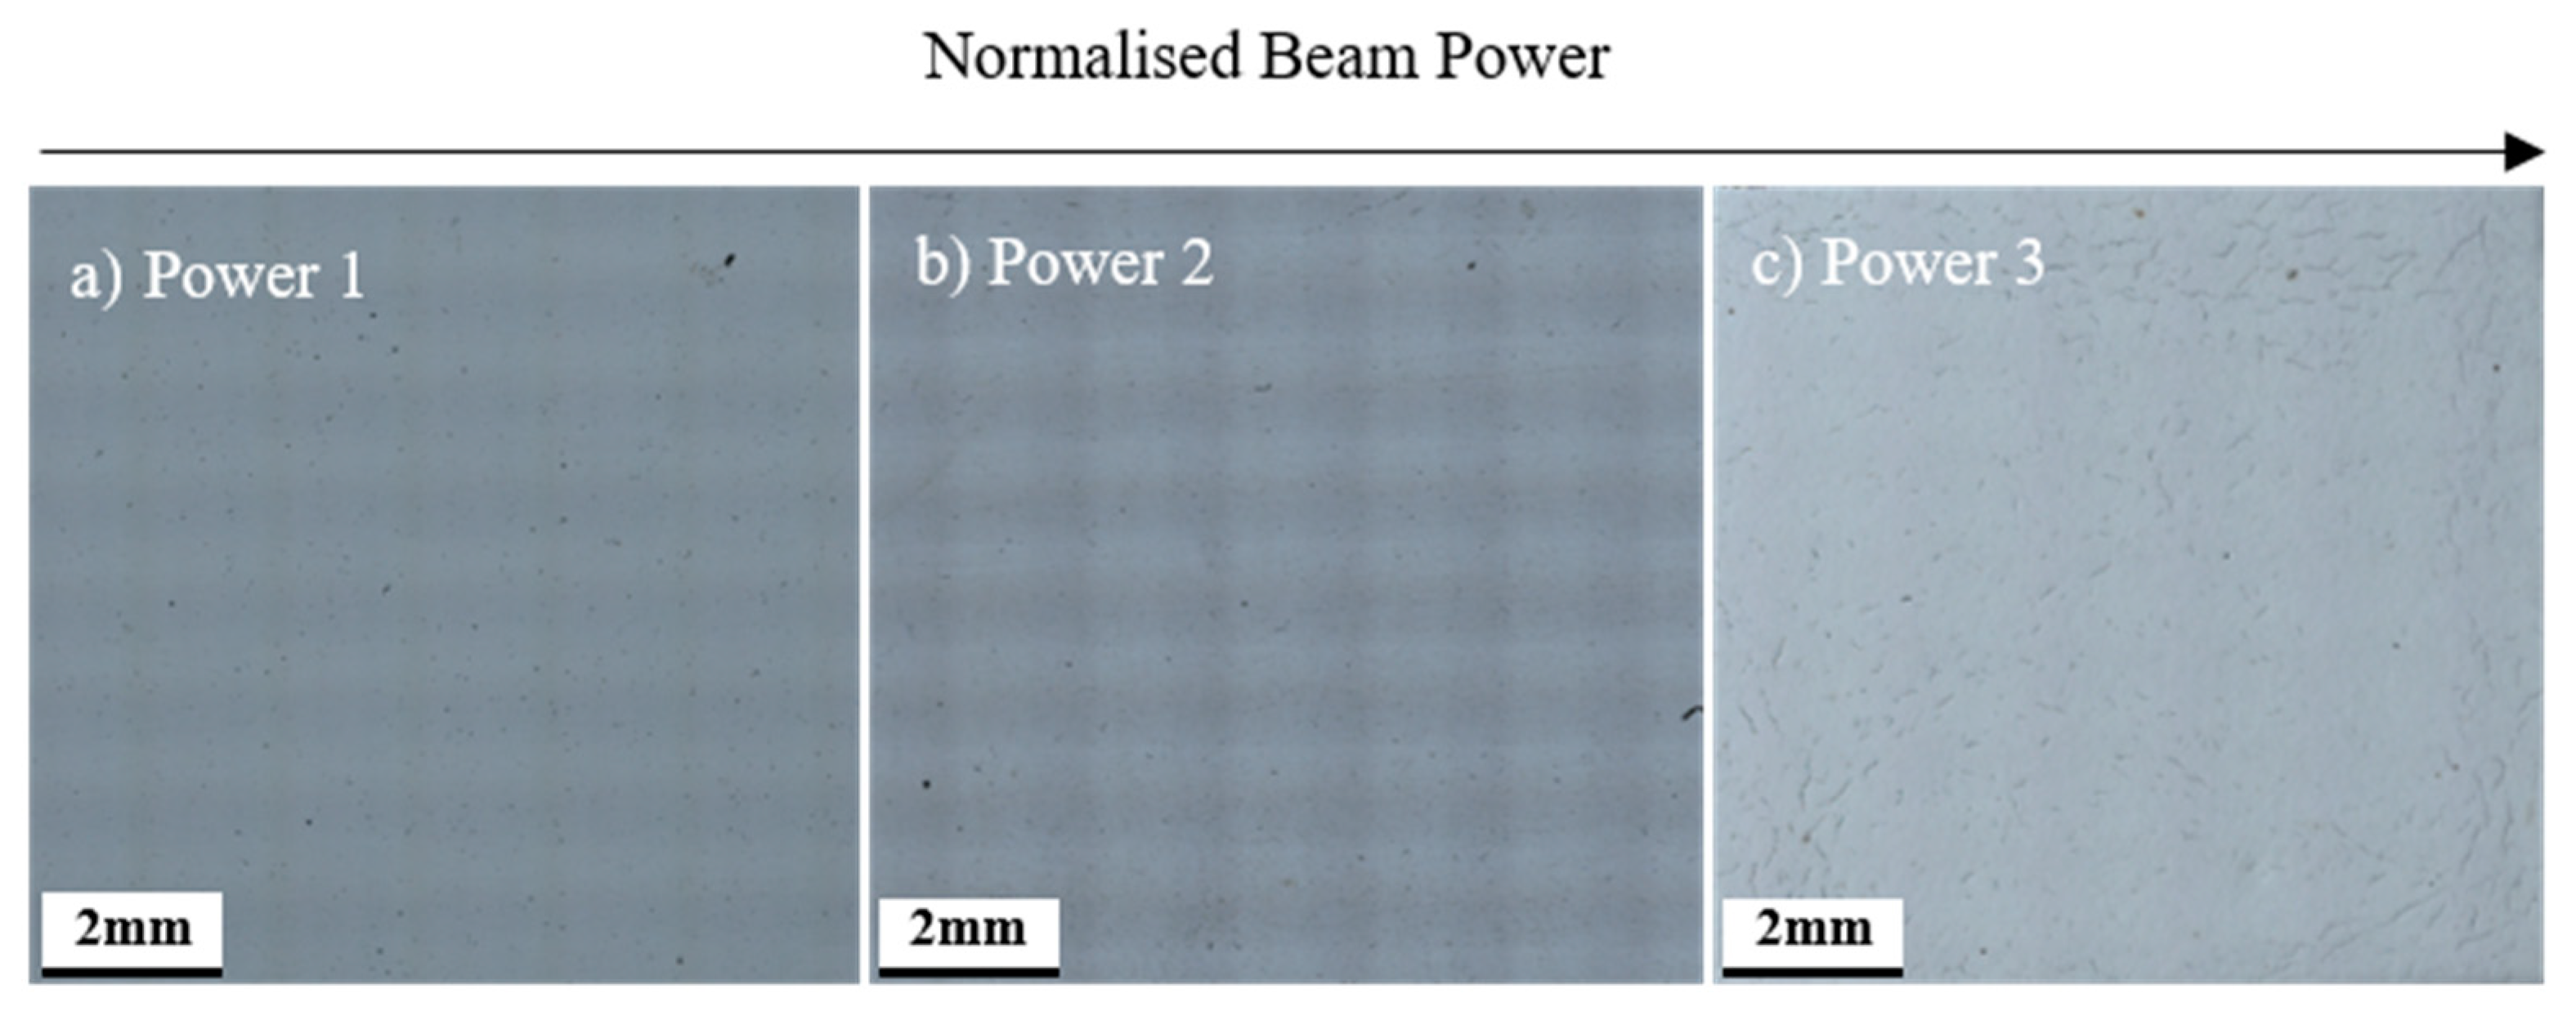
In addition to normalised beam speed, an investigation of normalised beam power and its influence on material discontinuities in both the AB and HIP’ed state was conducted. It can be observed in Figure 8 that there is a positive linear relationship between normalised beam power and microcracking which is thus validated by high-magnification optical imaging shown in Figure 9. The same relationship can somewhat be seen for porosity, although this is subject to the limitation of area percentage calculations as will be discussed later. Following a series of post-heat treatments, it can be seen that high beam powers and regions that are porous with high cracking densities tend not to crack post HIP as displayed in Figure 10. This is hypothesised to be related to the residual stress relieving mechanism previously discussed.
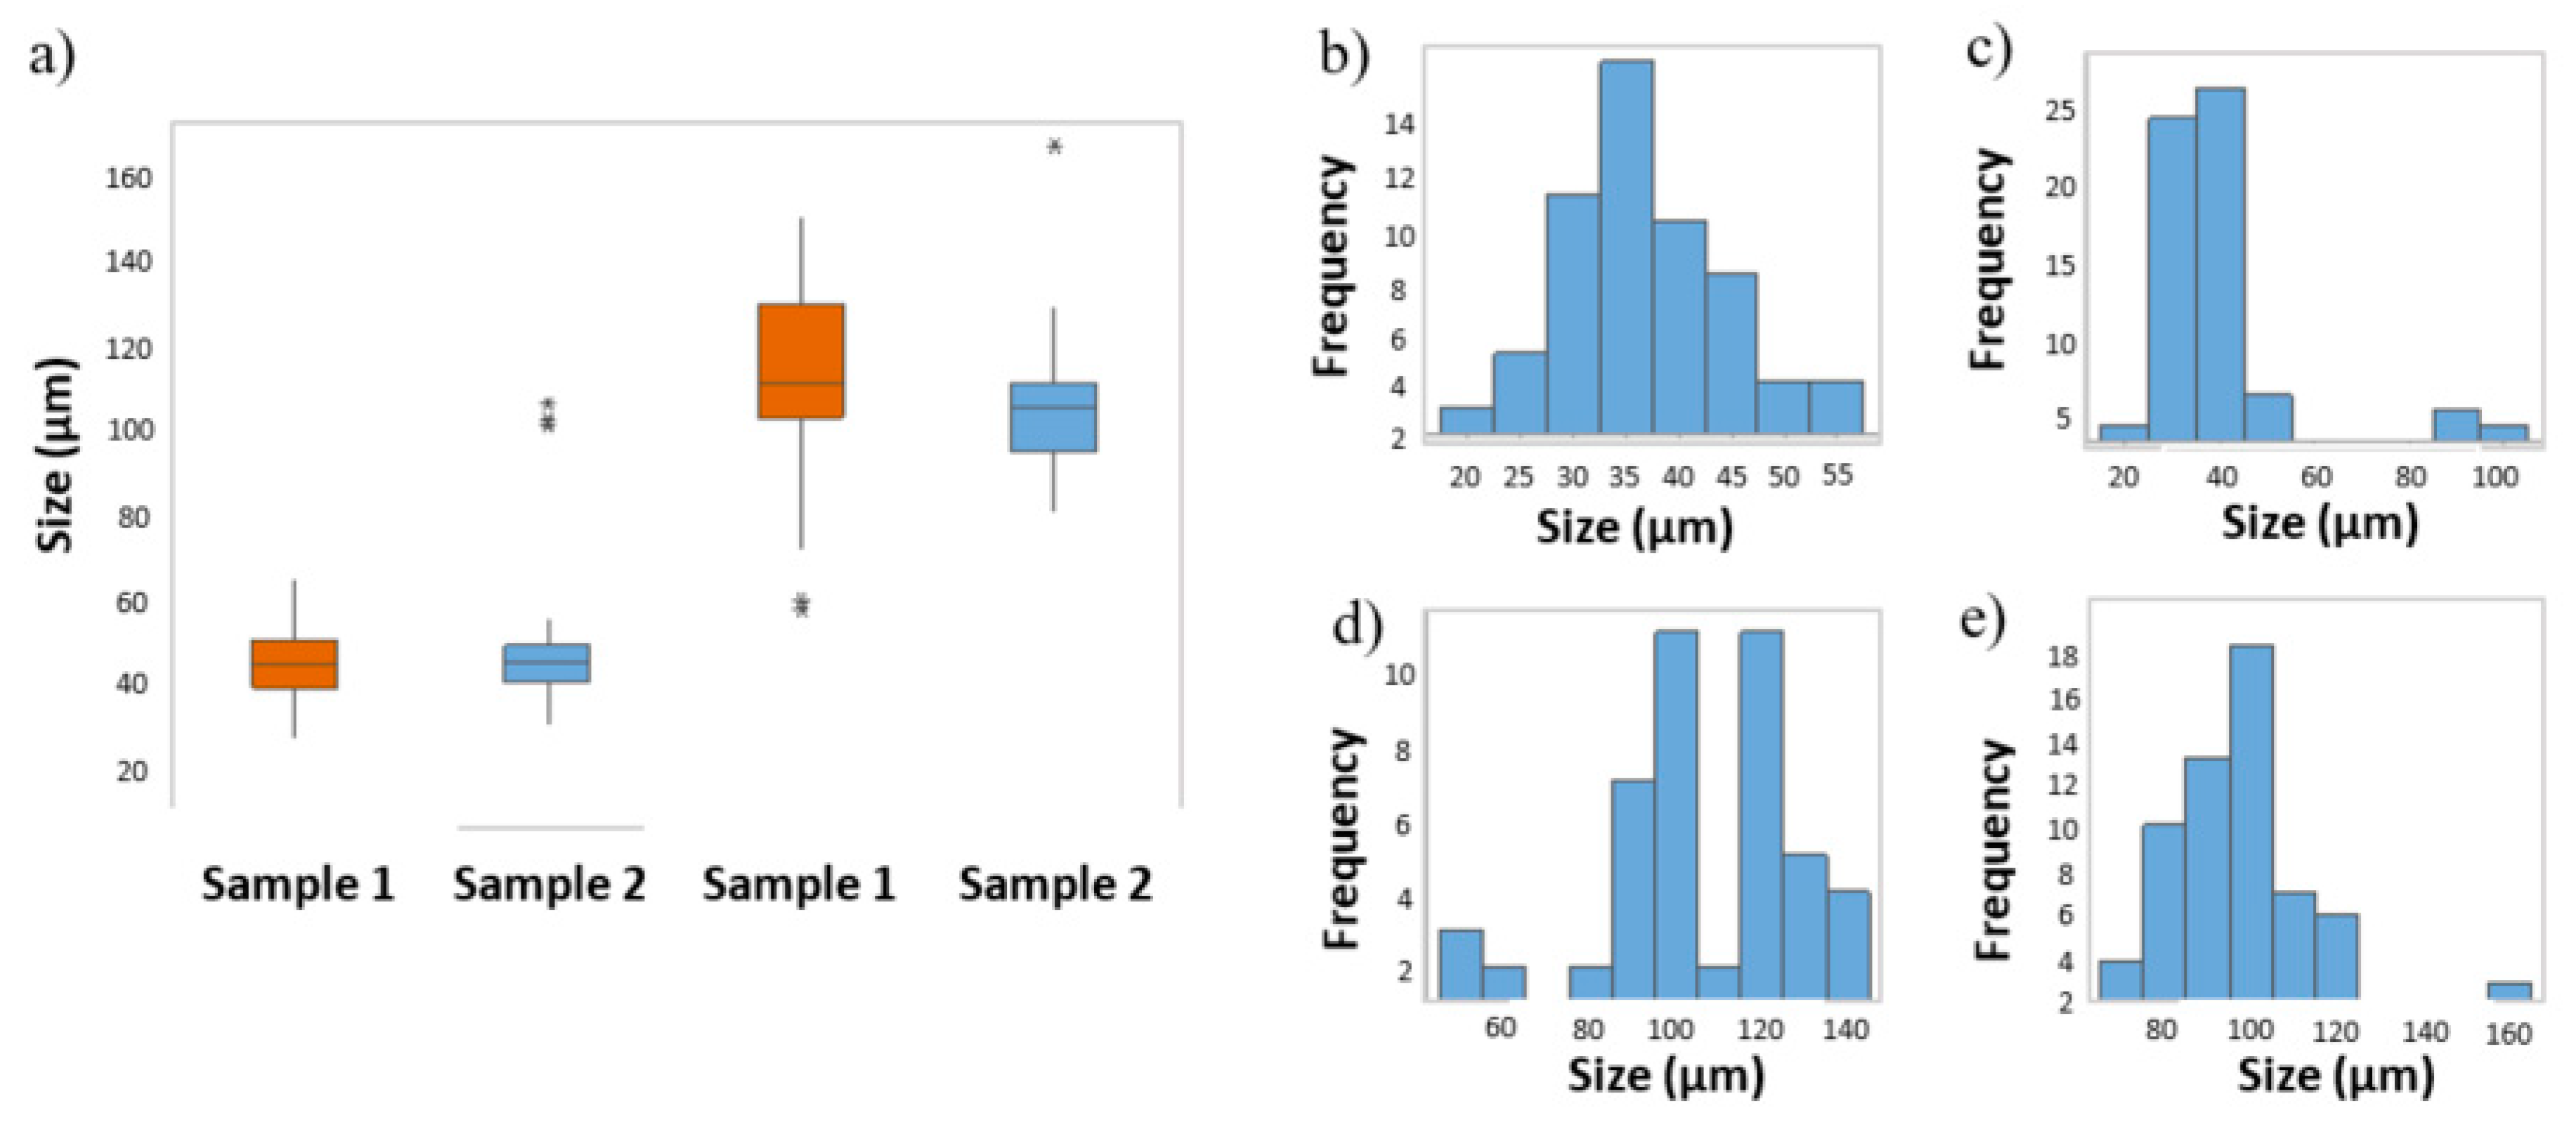
Given the notable differences in structural integrity for the AB samples, as witnessed in Figure 10, a variance analysis study was conducted. Despite the relatively similar average melt track sizings, as displayed in Figure 11a, the variability of each set of measurements indicates that larger variations display some correlation in relation to tearing behaviour. Figure 11b–e further emphasise these variations in track height and width, with the profiles of neither sample 1 nor 2 exhibiting similar distributions.
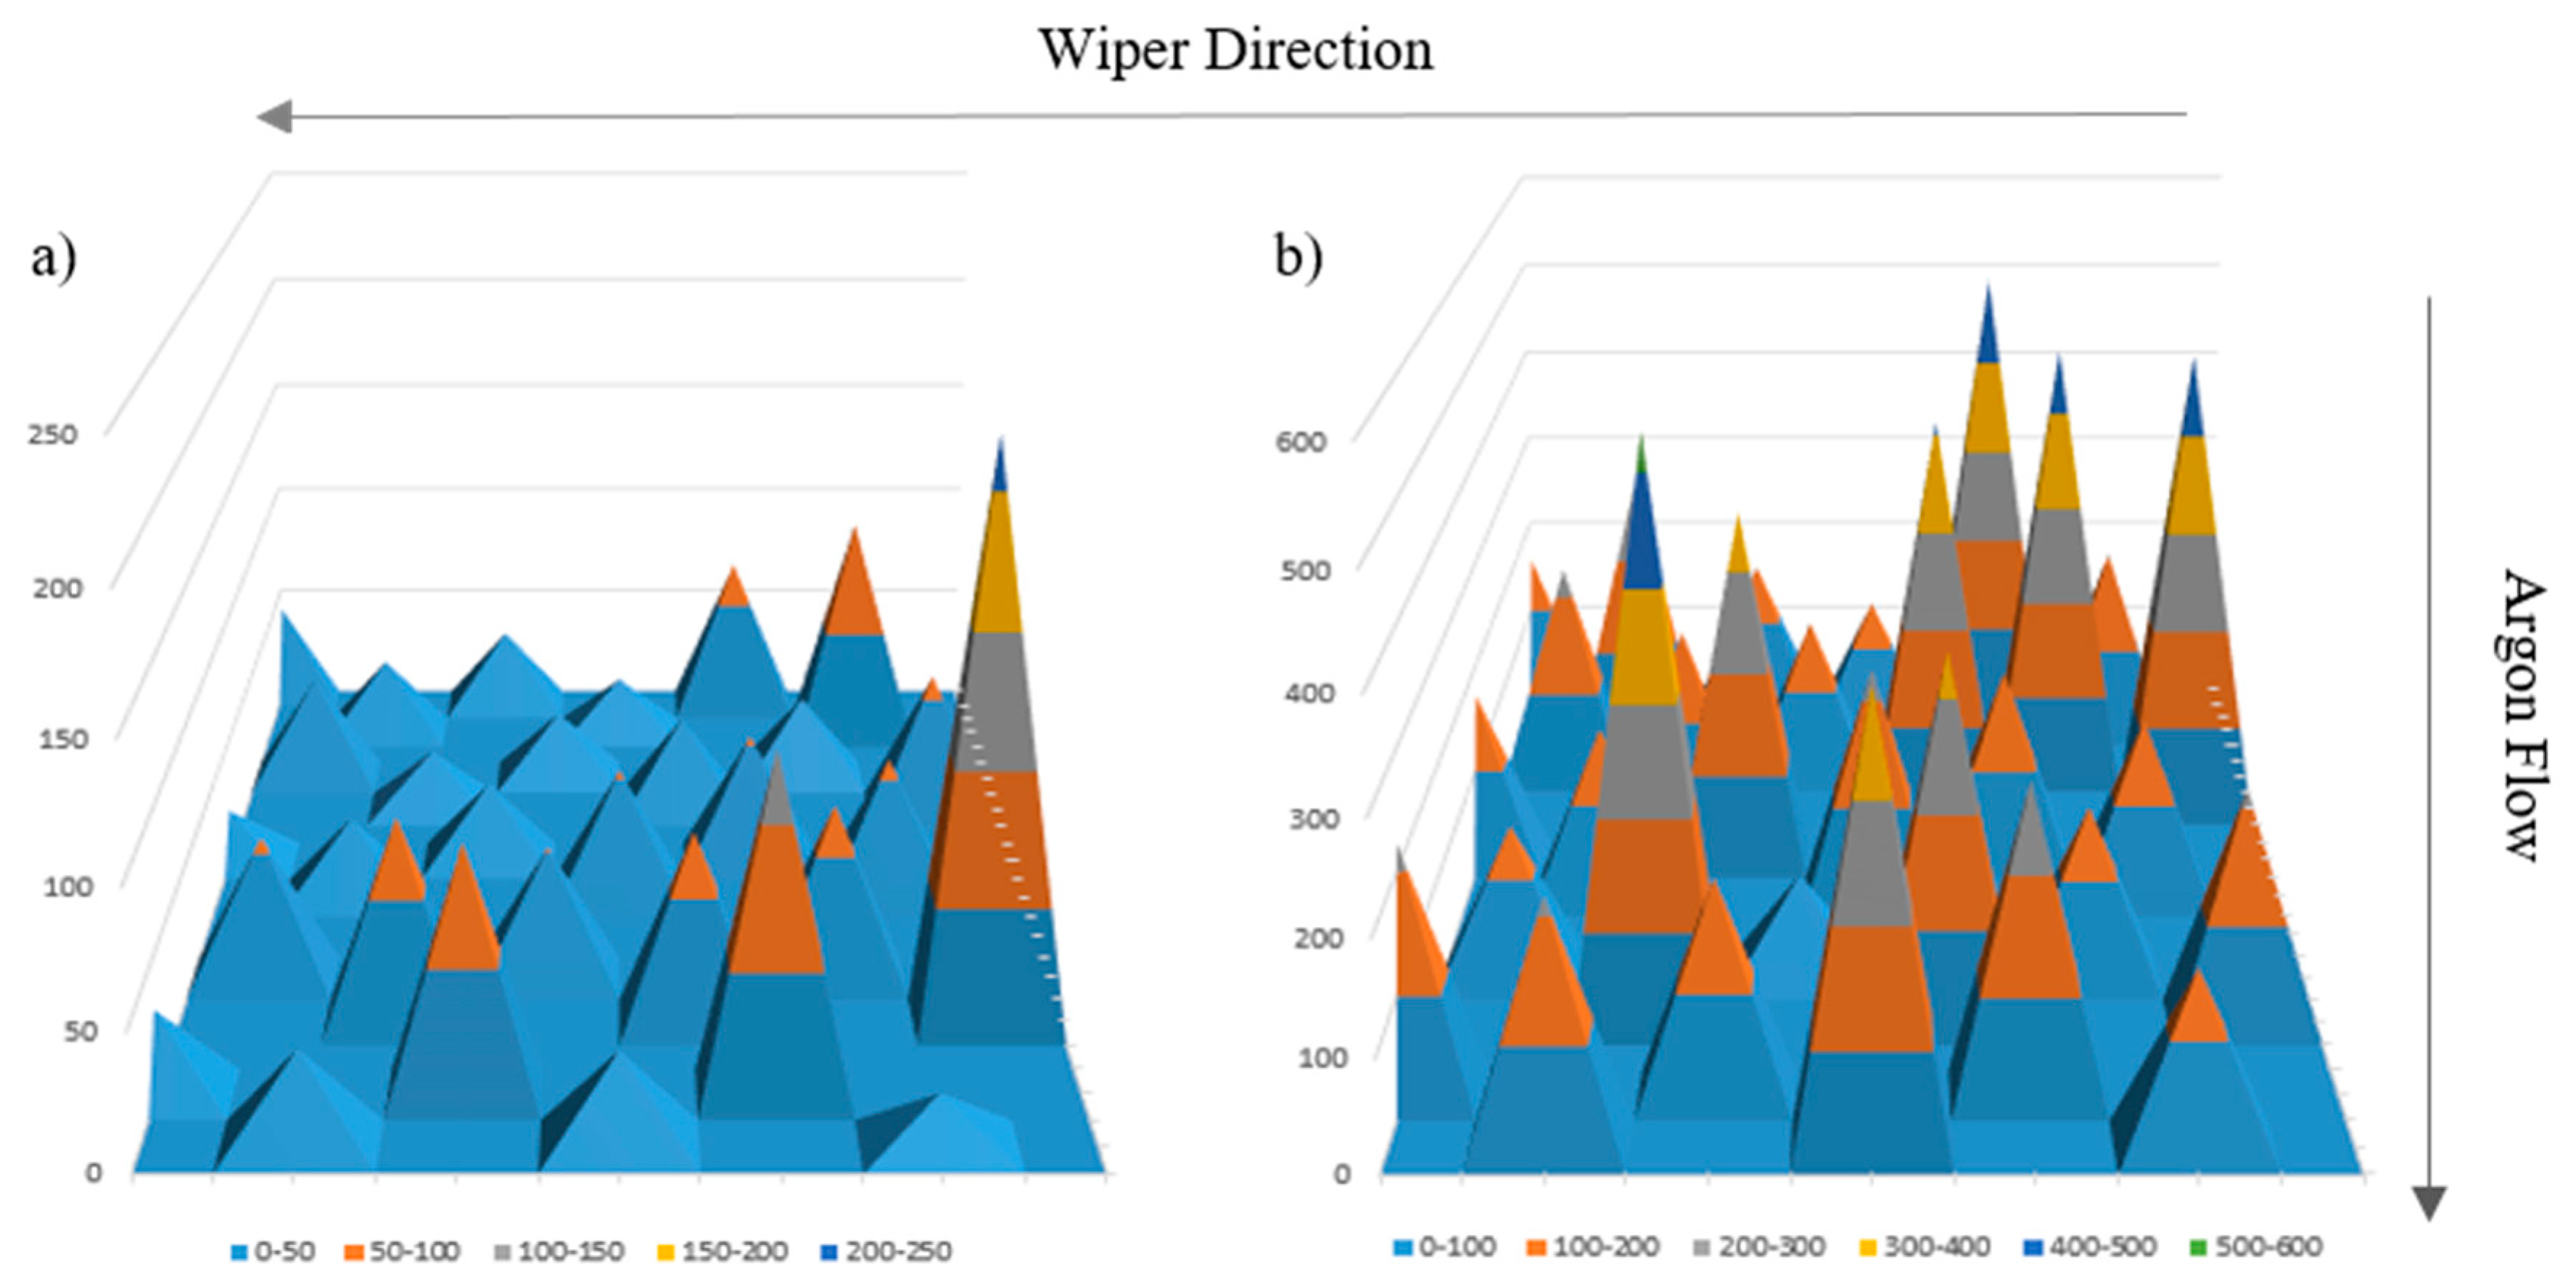
With variations in track heights and widths being attributed to differing tearing behaviours despite the same parameter sets, an investigation as to the cause takes precedence. As displayed in Figure 12, contour mapping utilising track variance highlights a phenomenon that is self-evident towards the back-right area of the build plate. These peaks are attributed to regions of disrupted argon gas flow and gas trappage due to the proximity of the recoating mechanism and, as such, non-uniform cooling becomes prominent. Therefore, the variations in track sizes observed are believed to be a consequence of the wiper recoating at the end of each layer.
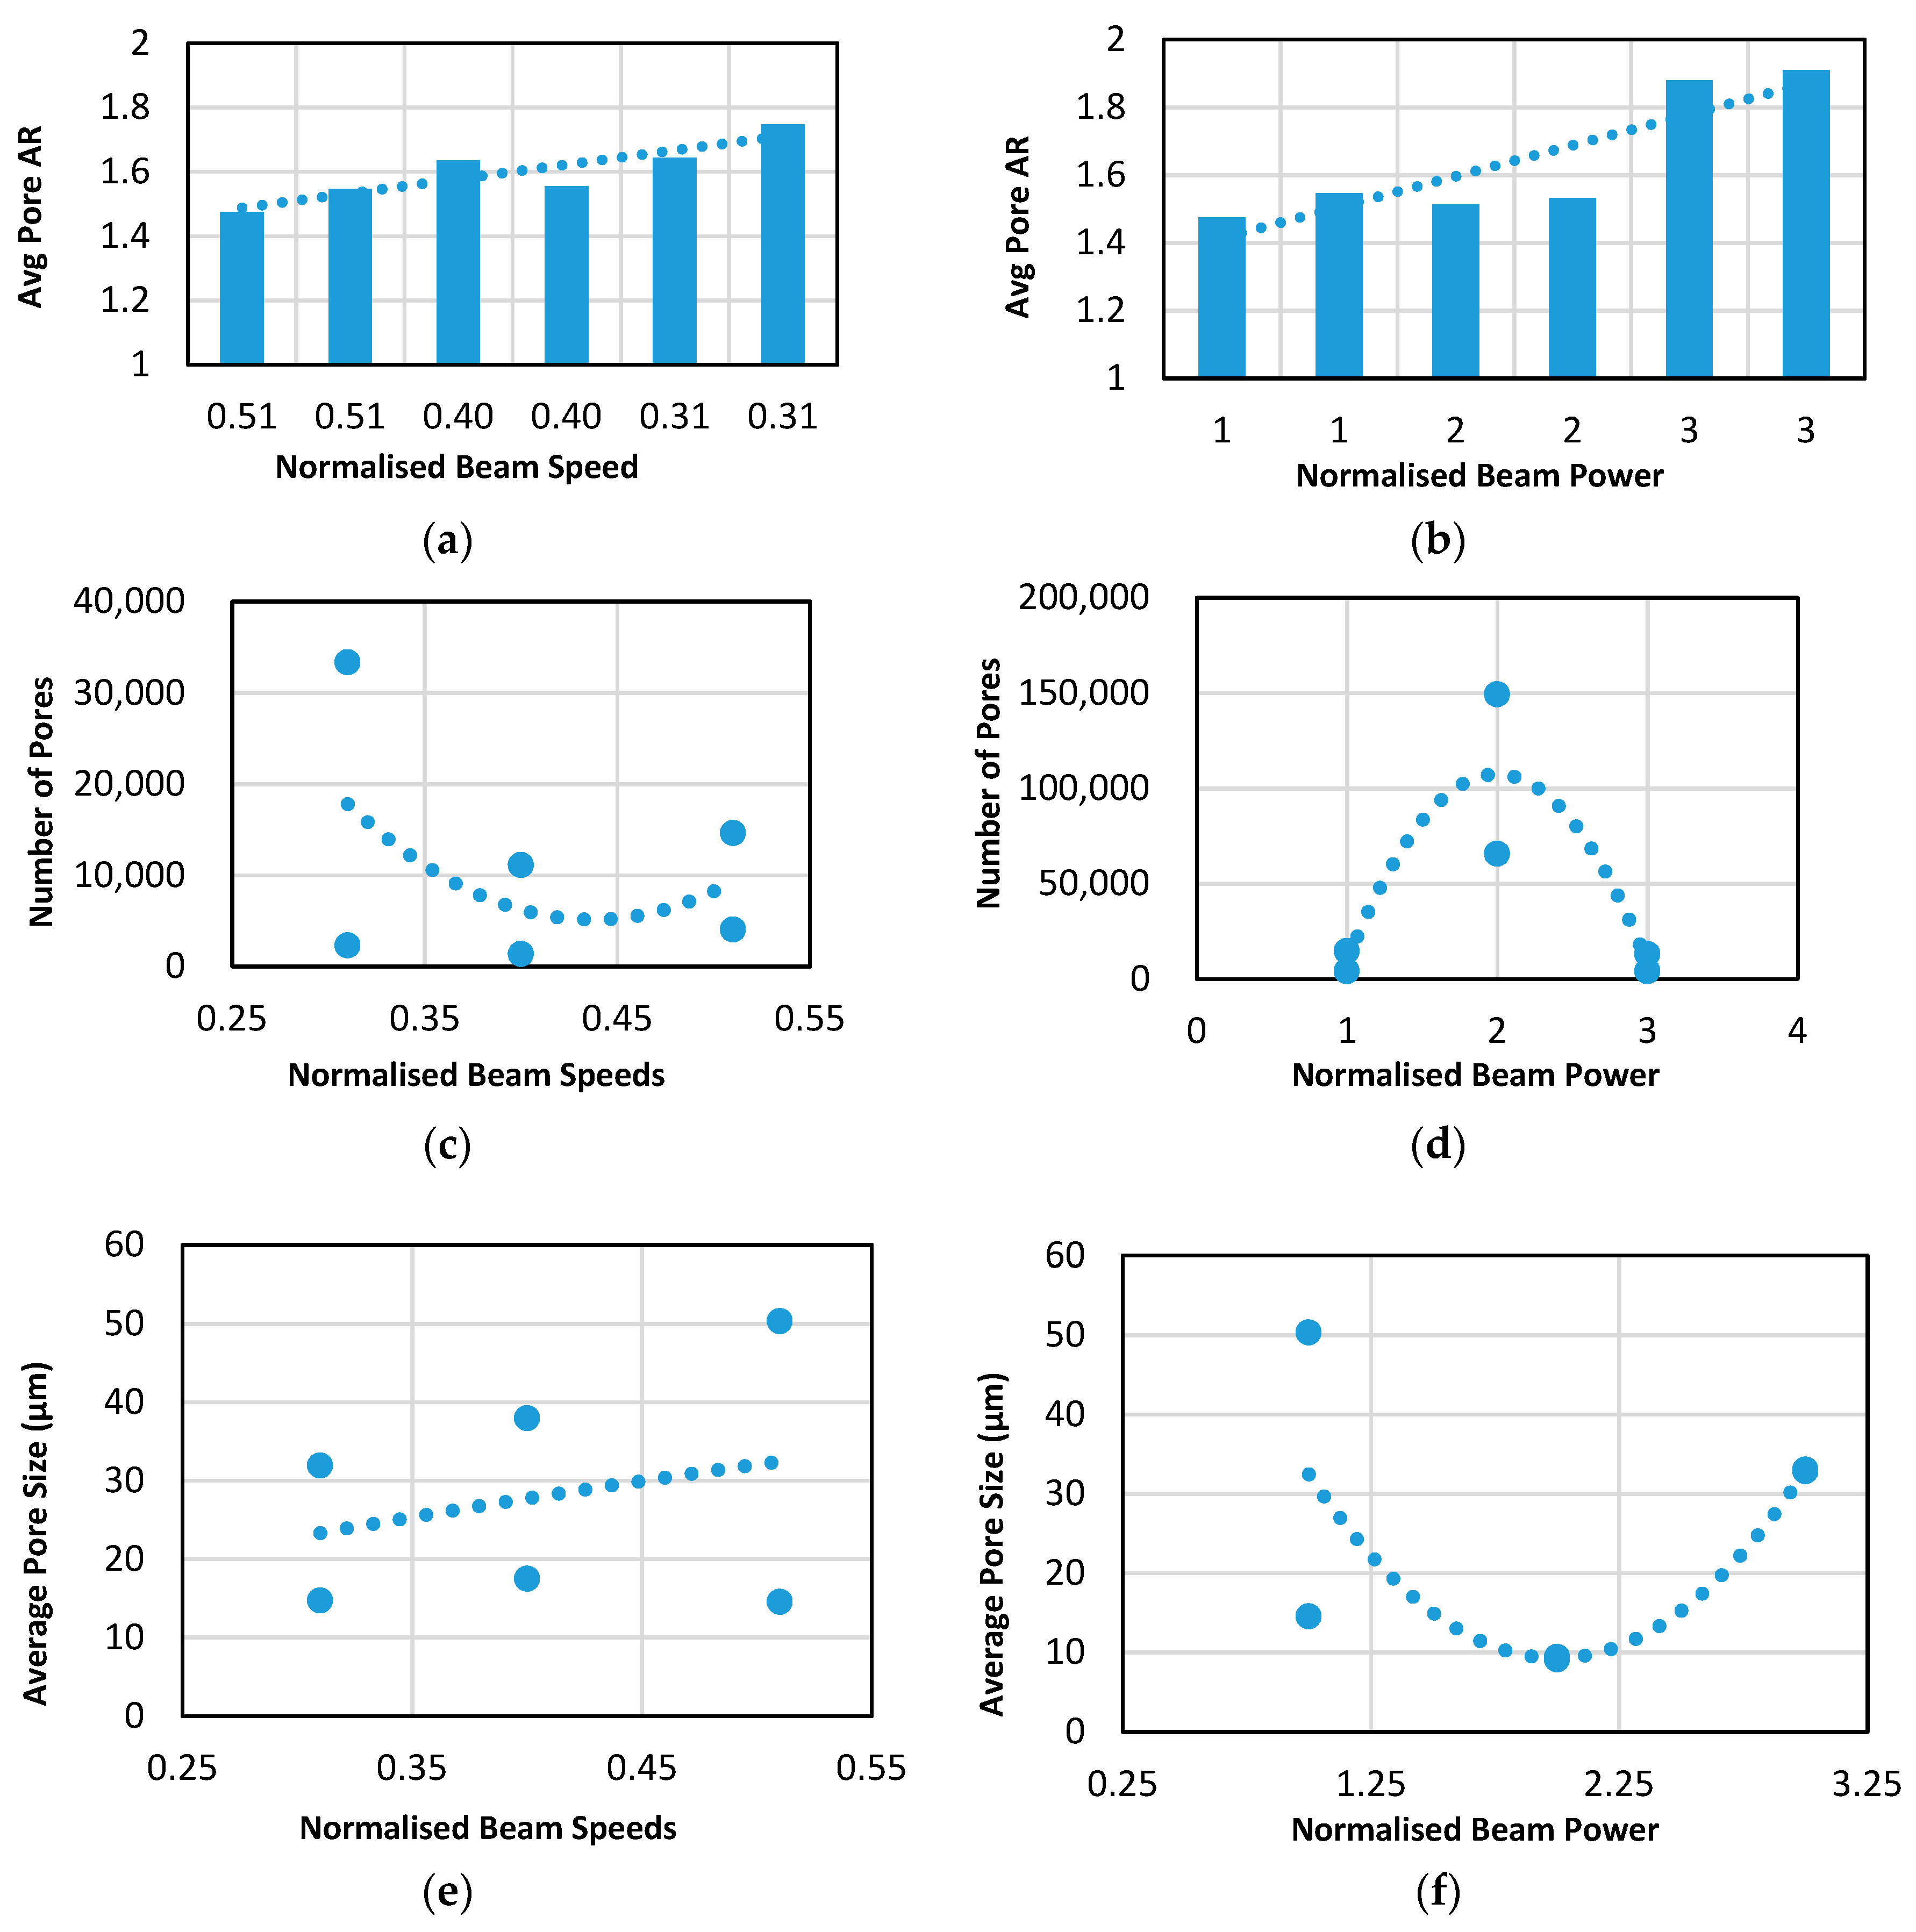
As mentioned previously, the existence of a polynomial relationship for porosity calculations was observed and it was therefore hypothesised that area percentage is somewhat limited and does not give an indication as to the mechanisms or characteristics of these pores. As such, an in-depth analysis of porosity in relation to process parameters has been conducted, with multiple criteria such as average porosity size, aspect ratio and count all being considered. As shown in Figure 13a,b, there is a linear relationship and correlation between beam speed and power and the melt track aspect ratio. This becomes particularly important in regard to AM specific defects such as keyholing, where high AR pores can skew beam dynamics and lead to the remelting of previous layers. Furthermore, a polynomial relationship further exists with regard to the number of pores, where the mid region of beam speed appears to give rise to the least number of pores, whereas beam power again shows an inverse relationship, where porosity count peaks within the mid region of beam power. With regard to pore size, there tends to be a linear relationship between beam speed and average size, whereas with beam power the same polynomial relationship arises inversely proportional to that of the number of pores.
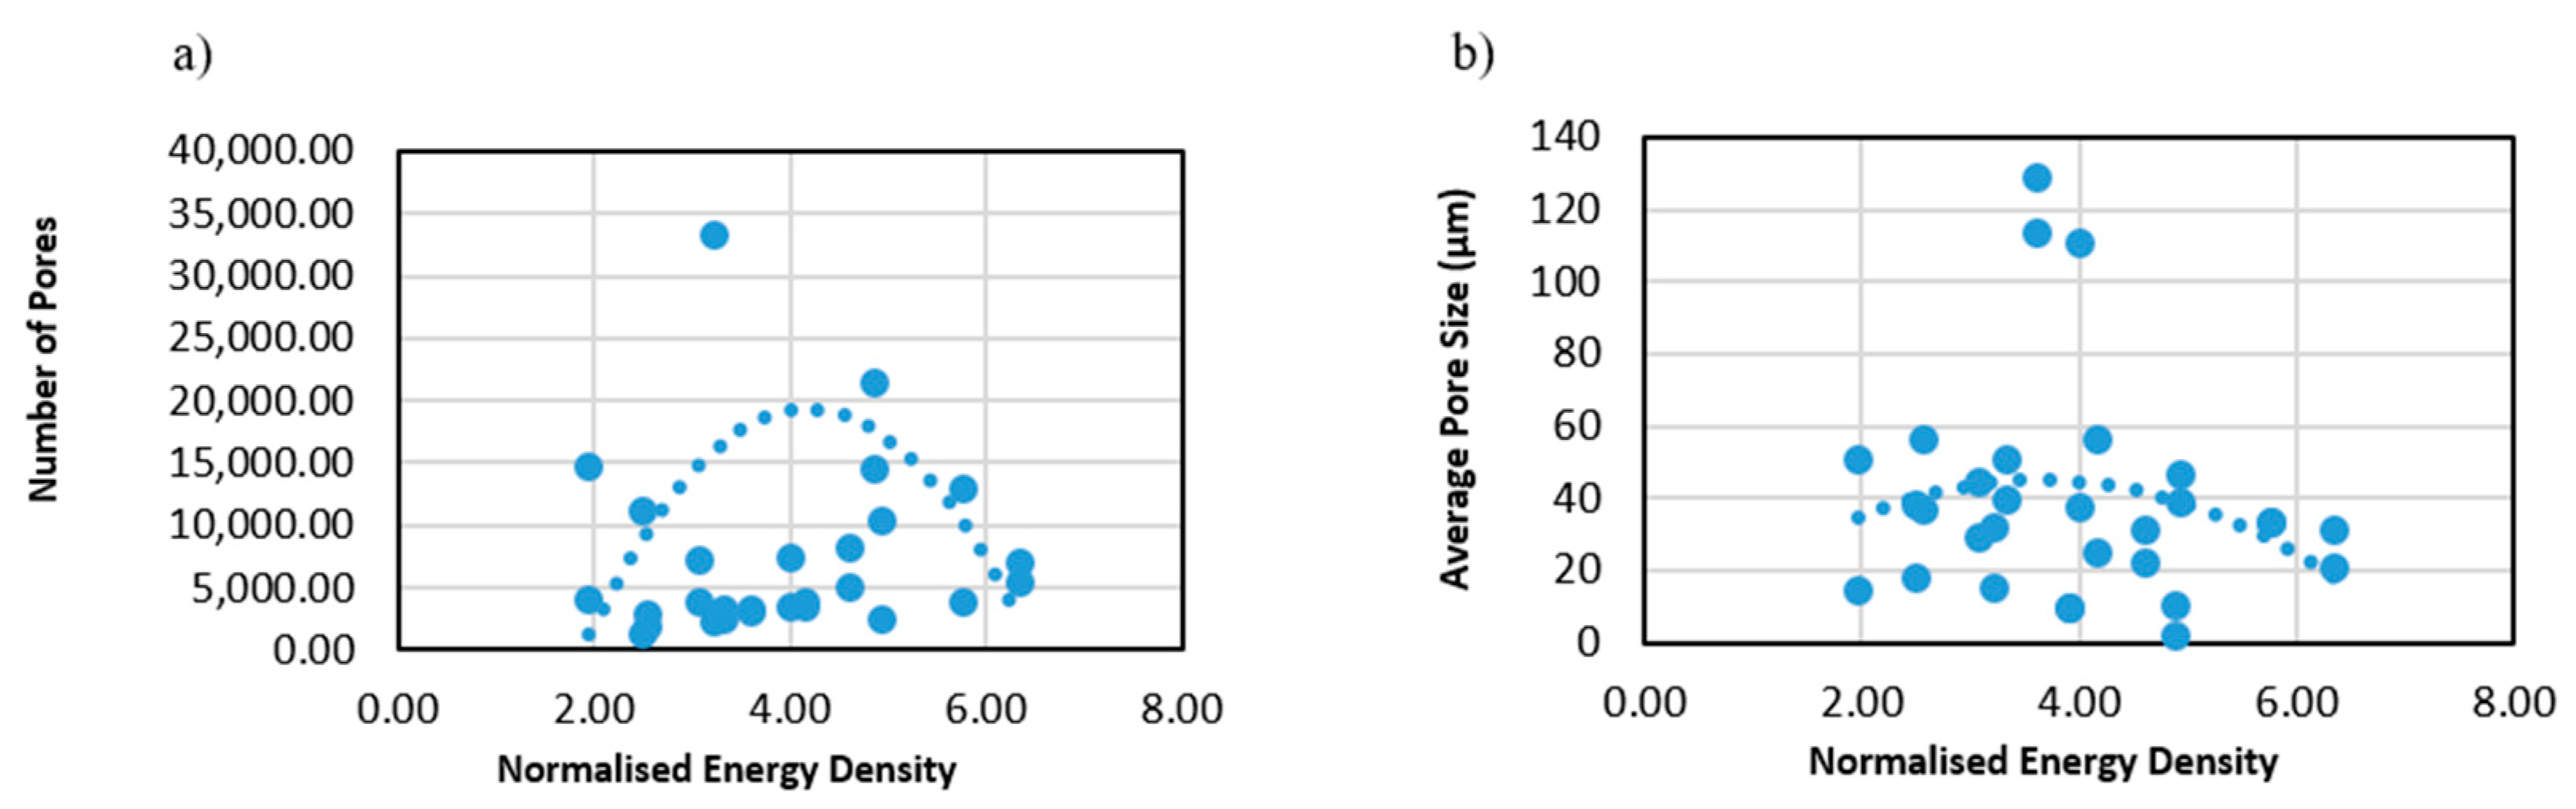
In order to further validate the statistical validity of these observed relationships and disregard critiques of the 3-point system, the correlation between normalised energy density and average pore AR, count and size has been considered across all 30 LPBF variants. It can be seen in Figure 14 that these polynomial trends further exist over a larger sample population, with the mid regions of energy density giving rise to both larger and more frequent pore formation, further validating this relationship.
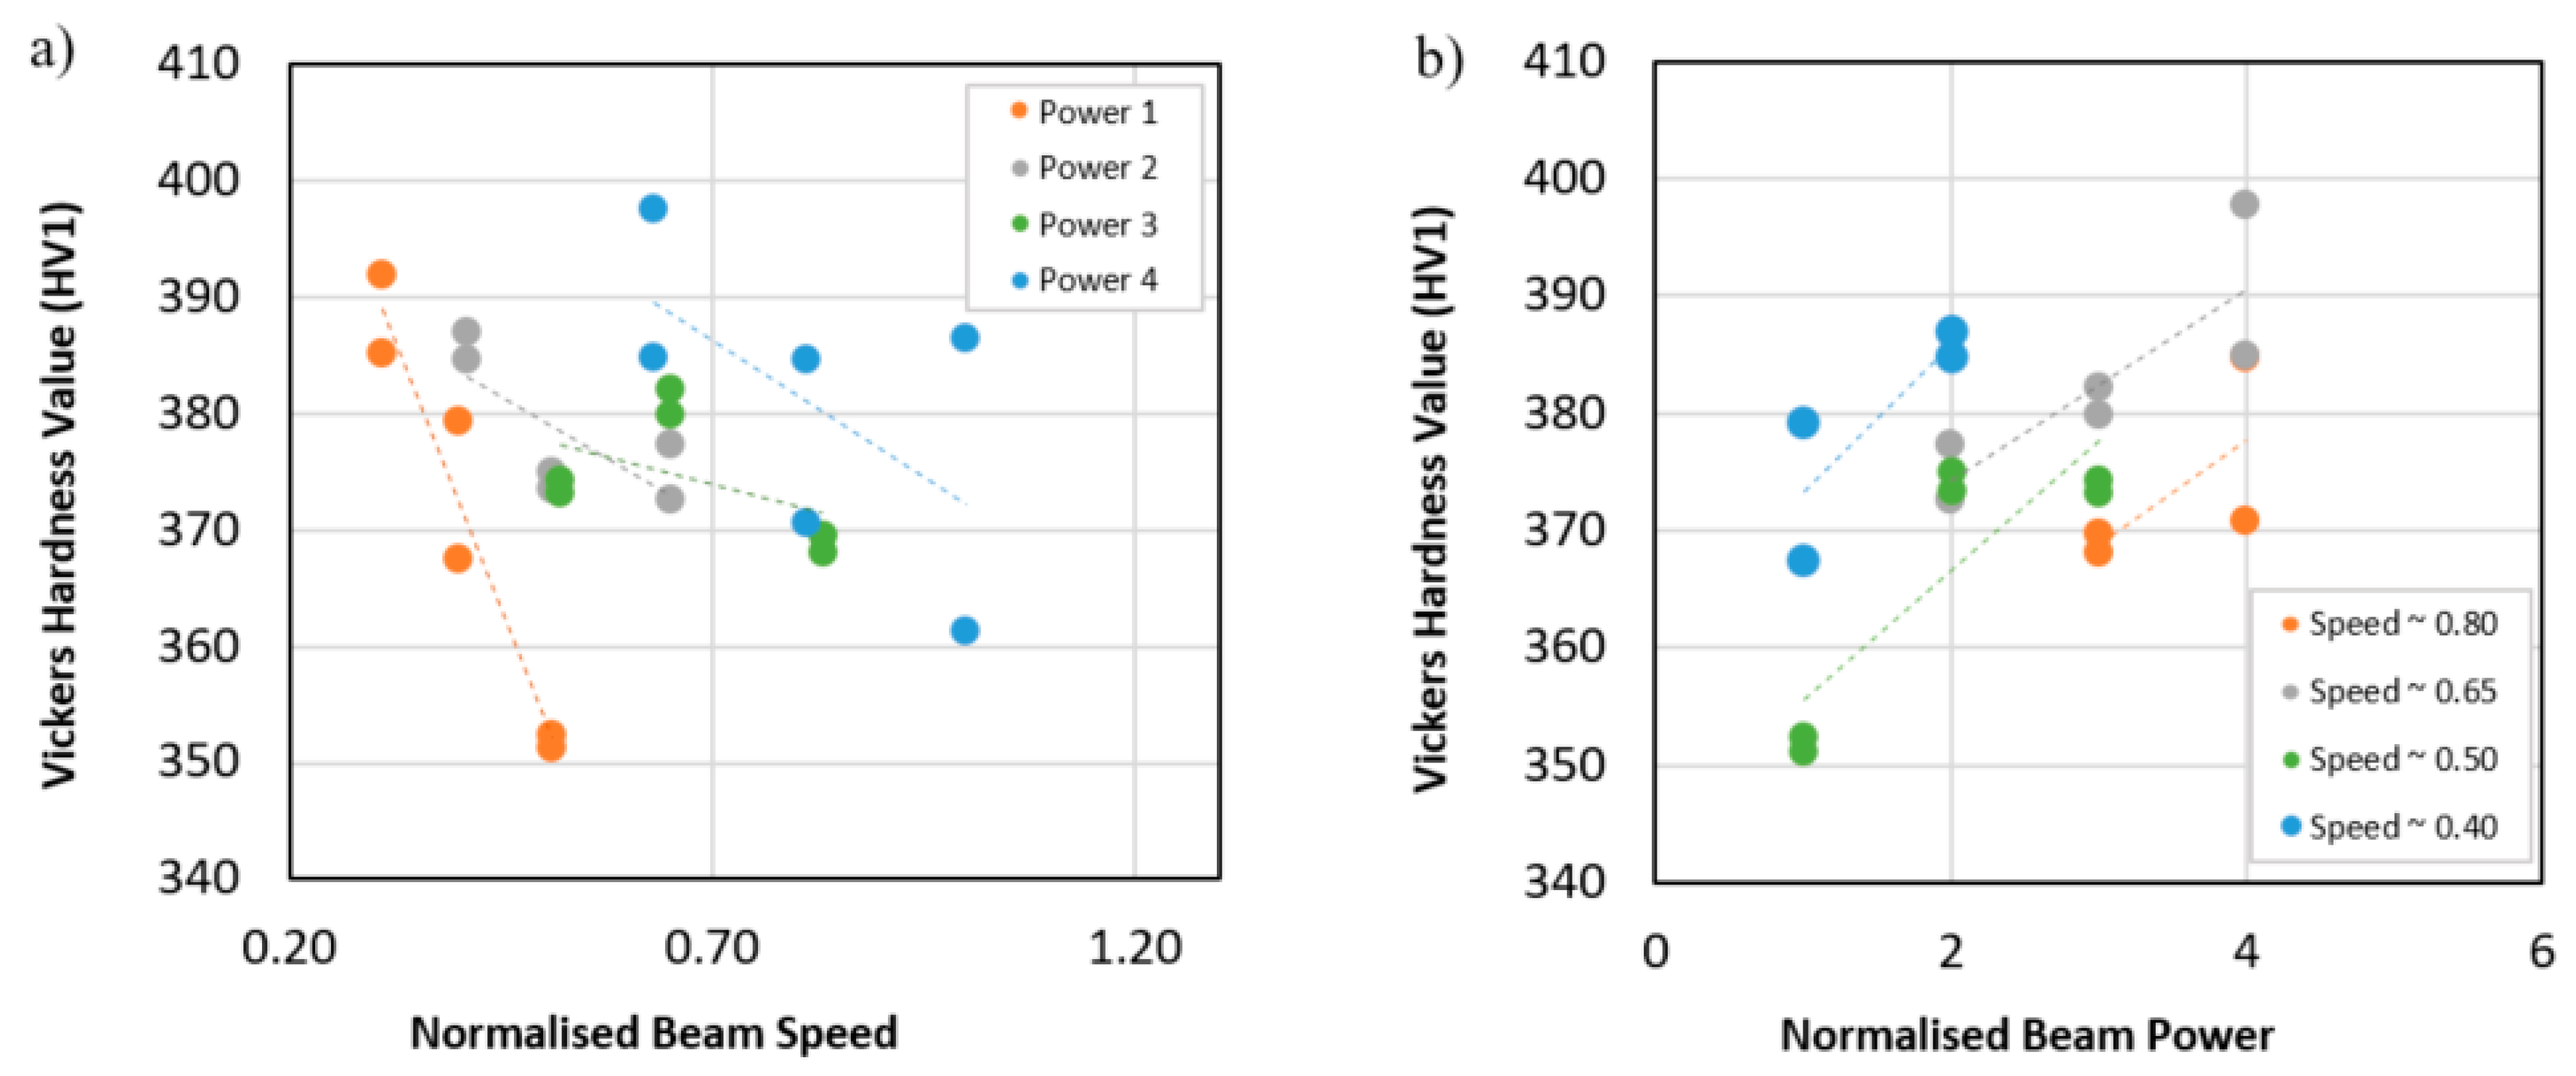
Finally, an investigation into the influence of normalised process parameters such as beam speed and power on mechanical properties was conducted as shown in Figure 15. Here, a series of Vickers Hardness measurements was recorded, and the results demonstrated that there is a direct linear trend between energy density and average hardness, as the indirect relationship between normalised beam speed and normalised beam power is further emphasised. It can be seen that these trends contradict that of the material’s porosity and microcracking prominence and as such this suggests that the material’s hardness is dominated by microstructural features such as grain size.
4. Conclusions
The melt track heights and widths of 30 laser powder bed fused CM247LC variants were manually measured and correlated to linearly normalised process parameters such as beam speed and power. Results showed that higher beam speeds resulted in smaller melt track sizing, whereas an inverse relationship was noted for beam power, where higher beam power tended to give rise to larger melt tracks. These relationships in conjunction with further supporting evidence from the literature suggest that melt track sizing is directly related to energy density.
A robust quantitative method for characterising cracks and pores was established for material within the as-built state, with a circularity of 0.5 being defined as the key value to distinguish between the two. Higher beam speeds led to a decrease in porosity and microcracking, contradicting that of beam power where an increase leads to larger degrees of porosity and microcracking. This suggests that higher levels of energy density encourage the prominence of defect forming mechanisms. This statistical analysis was further validated with the use of high-magnification and stitched optical imagery.
The influence of linearly normalised process parameters on tearing in the HIP’ed condition was also examined, with higher beam speeds and lower beam powers giving rise to more frequent tearing. This displays a complete inverse relationship to cracking and porosity observed in the AB state, which suggests that material in the AB condition that exhibits higher frequencies of defects consolidates to a greater quality post HIP. It is believed that this occurs as a result of stress relieving behaviour for the residual stressing often observed in AM components.
Paired samples with the same parameter sets that displayed distinguishable differences in tearing post HIP were statistically examined in order to gauge an understanding as to the cause. It was noted that despite exhibiting very similar average melt track sizing, the variance was significantly different, with the samples that displayed larger degrees of variance being more susceptible to tearing. As such, an understanding as to why these variances occurred took precedence. Contour mapping for variance as a function of location on the build plate was constructed, with larger variance values being noted towards the back-right section of the build plate. It is thought that this occurs due to the proximity of the recoater and argon gas flow, where a gas trappage phenomenon becomes evident leading to non-uniform rates of cooling.
Author Contributions
The work presented in this paper was carried out as a collaboration between all authors. The research theme was defined by R.L., D.S. and G.B., H.H., R.L. and D.S. prepared the scientific manuscript, with H.H. performing the analysis. R.L., D.S. and G.B. secured the relevant funding to enable the research programme to take place. All authors have contributed to, seen and approved the final manuscript.
Funding
The current research was funded by EPSRC Rolls-Royce Strategic Partnership in Structural Metallic Systems for Gas Turbines (grants EP/H500383/1 and EP/H022309/1) alongside The Materials and Manufacturing Academy (M2A) supported through the European Social Fund. The provision of materials and supporting information from Rolls-Royce plc is gratefully acknowledged. Mechanical tests were performed at Swansea Materials Research and Testing Ltd. (SMaRT).
Conflicts of Interest
The funders had no role in the design of the study; in the collection, analyses, or interpretation of data; in the writing of the manuscript, or in the decision to publish the results.
References
- Reed, R.C. The Superalloys Fundamentals and Applications; Cambridge University Press: Cambridge, UK, 2006. [Google Scholar]
- Rolls-Royce plc. The Jet Engine; Wiley: Hoboken, NJ, USA, 2005. [Google Scholar]
- Frazier, W.E. Metal Additive Manufacturing: A Review. J. Mater. Eng. Perform. 2014, 23, 1917–1928. [Google Scholar] [CrossRef]
- Gokhare, V.G. A review paper on 3D-Printing aspects and various processes used in the 3D-Printing. Int. J. Eng. Res. Technol. 2017, 6, 953–959. [Google Scholar]
- DebRoy, T.; Wei, H.L.; Zuback, J.S.; Mukherjee, T.; Elmer, J.W.; Milewski, J.O.; Breese, A.M.; Wilson-Heid, A.; De, A.; Zhang, W. Additive manufacturing of metallic components-Process, structure and properties. Prog. Mater. Sci. 2018, 92, 112–224. [Google Scholar] [CrossRef]
- Hilal, H.; Lancaster, R.J.; Jeffs, S.P.; Ednie, L.; Boswell, J.; Stapleton, D.; Baxter, G.J. High temperature mechanical deformation of an additively manufactured nickel-based superalloy using small scale testing methods. In Proceedings of the 5th International Small Scale Testing Techniques Conference Proceedings, 2018, Swansea, UK, 10–12 July 2018. [Google Scholar]
- Hilal, H.; Lancaster, R.J.; Jeffs, S.P.; Boswell, J.; Stapleton, D.; Baxter, G.J. The Influence of Process Parameters and Build Orientation on the Creep Behviour of a Laser Powder Bed Fused Ni-based Superalloy for Aerospace Applications. Materials 2019, 12, 1390. [Google Scholar] [CrossRef] [PubMed]
- Boswell, J.; Clark, D.; Li, W.; Attallah, M. Cracking during thermal post-processing of a laser powder bed fabricated CM247LC Ni-superalloy. Mater. Des. 2019, 174, 107996. [Google Scholar] [CrossRef]
- Pollock, T.M.; Tin, S. Nickel-Based Superalloys for Advanced Turbine Engines: Chemistry, Microstructure, and Properties. J. Propul. Power 2006, 22, 361–374. [Google Scholar] [CrossRef]
- Kozar, R.W.; Suzuki, A.; Milligan, W.W.; Schirra, J.J.; Savage, M.F. Strengthening Mechanisms in Polycrystalline Multimodal Nickel-Base Superalloys. Metall. Mater. Trans. A 2009, 40, 1588–1603. [Google Scholar] [CrossRef]
- Harris, K.; Erickson, G.L.; Schwer, R.E. MAR M 247 derivations–CM 247 LC DS alloy, CMSX single crystal alloys: Performance and properties. In Proceedings of the Fifth International Symposium on Superalloys, Seven Springs Mountain Resort Champion, PA, USA, 7–11 October 1984. [Google Scholar]
- Thomas, M.; Baxter, G.J.; Todd, I. Normalised model-based processing diagrams for additive layer manufacture of engineering alloys. Acta Mater. 2016, 108, 26–35. [Google Scholar] [CrossRef] [Green Version]
Figure 1.
Experimental procedure for melt track measurements for both height and width.

Figure 2.
Experimental procedure for hot isostatic pressed (HIP’ed) cracking measurements including (a) cracking depth and (b) five crack width measurements which are used to calculate an average value.
Figure 2.
Experimental procedure for hot isostatic pressed (HIP’ed) cracking measurements including (a) cracking depth and (b) five crack width measurements which are used to calculate an average value.

Figure 3.
Influence of (a) normalised beam speed and (b) normalised beam power on melt track size.

Figure 4.
SEM micrographs illustrating the influence of beam speed (a,c,e) and beam power (b,d,e) on melt track sizing.
Figure 4.
SEM micrographs illustrating the influence of beam speed (a,c,e) and beam power (b,d,e) on melt track sizing.

Figure 5.
Influence of normalised beam speed on (a) microcracking and porosity in the as-built (AB) condition and (b) cracking post H.
Figure 5.
Influence of normalised beam speed on (a) microcracking and porosity in the as-built (AB) condition and (b) cracking post H.

Figure 6.
Stitched and blended high-resolution images of material discontinuities in the AB state in relation to normalised beam speed.
Figure 6.
Stitched and blended high-resolution images of material discontinuities in the AB state in relation to normalised beam speed.

Figure 7.
Influence of normalised beam speed on the severity of macrocracking in AB material.

Figure 8.
Influence of normalised beam power on (a) microcracking and porosity in the AB state; (b) cracking post HIP.
Figure 8.
Influence of normalised beam power on (a) microcracking and porosity in the AB state; (b) cracking post HIP.

Figure 9.
Stitched and blended high-resolution images of material discontinuities in the AB state in relation to normalised beam power.
Figure 9.
Stitched and blended high-resolution images of material discontinuities in the AB state in relation to normalised beam power.

Figure 10.
HIP’ed rods and paired parameters cracking in relation to normalised beam speed.

Figure 11.
Melt track height and width variance for paired parameter samples 1 and 2, (a) box plot representation (b) sample 1 track heights; (c) sample 2 track heights; (d) sample 1 track widths; (e) sample 2 track widths.
Figure 11.
Melt track height and width variance for paired parameter samples 1 and 2, (a) box plot representation (b) sample 1 track heights; (c) sample 2 track heights; (d) sample 1 track widths; (e) sample 2 track widths.

Figure 12.
(a) Melt track height variance in relation to build position; (b) melt track width variance in relation to build position.
Figure 12.
(a) Melt track height variance in relation to build position; (b) melt track width variance in relation to build position.

Figure 13.
Melt track AR in relation to (a) beam speed and (b) beam power. Number of pores in relation to (c) beam speed and (d) beam power and average pore size in relation to (e) beam speed and (f) beam power.
Figure 13.
Melt track AR in relation to (a) beam speed and (b) beam power. Number of pores in relation to (c) beam speed and (d) beam power and average pore size in relation to (e) beam speed and (f) beam power.

Figure 14.
Influence of normalised energy density on (a) number of porosity sites and (b) average porosity size for all 30 laser powder bed fusion (LPBF) variants.
Figure 14.
Influence of normalised energy density on (a) number of porosity sites and (b) average porosity size for all 30 laser powder bed fusion (LPBF) variants.

Figure 15.
Influence of (a) normalised beam speed and (b) normalised beam power on average hardness values.
Figure 15.
Influence of (a) normalised beam speed and (b) normalised beam power on average hardness values.


Table 1.
Chemical composition of CM247LC (wt%).
| C | Cr | Ni | Co | Mo | W | Ta |
| 0.07 | 8 | Bal. | 9 | 0.5 | 10 | 3.2 |
| Ti | Al | B | Zr | Hf | Si | S |
| 0.7 | 5.6 | 0.015 | 0.01 | 1.4 | 0.03 | 15 ppm |
Table 2.
Standard metallurgical preparation procedure for nickel-based superalloys.
| Stage | Step 1 | Step 2 | Step 3 | Step 4 |
|---|---|---|---|---|
| Base | Piano-120 | Largo | Dac | MD-Chem |
| Media | Water | DiaPro Allegro Largo | DiaPro Dac | OP-S (0.04 micron) |
| Force (N) | 25 | 25 | 25 | 20 |
| Speed (rpm) | 300 | 150 | 150 | 150 |
| Time (min) | 1 | 4 | 5 | 7–8 |
© 2019 by the authors. Licensee MDPI, Basel, Switzerland. This article is an open access article distributed under the terms and conditions of the Creative Commons Attribution (CC BY) license (http://creativecommons.org/licenses/by/4.0/).
Share and Cite
MDPI and ACS Style
Hilal, H.; Lancaster, R.; Stapleton, D.; Baxter, G. Investigating the Influence of Process Parameters on the Structural Integrity of an Additively Manufactured Nickel-Based Superalloy. Metals 2019, 9, 1191. https://doi.org/10.3390/met9111191
AMA Style
Hilal H, Lancaster R, Stapleton D, Baxter G. Investigating the Influence of Process Parameters on the Structural Integrity of an Additively Manufactured Nickel-Based Superalloy. Metals. 2019; 9(11):1191. https://doi.org/10.3390/met9111191
Chicago/Turabian StyleHilal, Hani, Robert Lancaster, Dave Stapleton, and Gavin Baxter. 2019. "Investigating the Influence of Process Parameters on the Structural Integrity of an Additively Manufactured Nickel-Based Superalloy" Metals 9, no. 11: 1191. https://doi.org/10.3390/met9111191
Note that from the first issue of 2016, this journal uses article numbers instead of page numbers. See further details here.