1. Introduction
Marine energy is recognized as a reliable alternative to energy generated by burning fossil fuels in countries surrounded by the seas and oceans. According to the International Energy Agency (IEA) [
1] oceans contain 93,100 TWh/year of marine energy globally. Among the marine energy resources, wave energy is widely available and contains the highest energy density worldwide [
2]. The wide-spread availability of wave power resource and relatively low impact of energy intake on the ocean environment [
3] have led to numerous research and development of wave energy-harvesting.
Wave power potential at any given location is determined by the ocean wave climate. It is well understood that ocean waves may vary at a range of timescales. Those timescales vary from a few days to a few years, as a result of extreme events such as storms and tropical and extra-tropical cyclones, seasonal events such as tropical monsoons and annual/inter-annual climatic variabilities such as North Atlantic Oscillation, Southern Oscillation, and Indian Ocean Dipole among others. Furthermore, global climate change may have the potential to impact the ocean wave climate at much longer timescales of several decades or longer. Charles et al., [
4] using numerically simulated future waves, reported that wave height in the Bay of Biscay, France will be decreased in future because of global climate change. Wolf and Woolf [
5] stated, based on climate model predictions of the North Atlantic Oscillation, that wave heights in the North Atlantic are likely to be larger in future. However, they noted the need for further studies to confirm this observation. Based on global wave climate projections from a multi-model ensemble, Hemer et al. [
6] concluded that future significant wave heights decrease over 25.8% and increase over 7.1% of global ocean surface area. Woolf and Wolf [
7] concluded that there is no clear pattern how global wave climate will respond to future climate variabilities. Young et al., [
8] studied climate change-induced global trends of wind speed and wave height using a 23-year database. They found that the rate of increase of wave height is larger for extreme events than for the mean conditions. Based on wave projections from a super-high-resolution model, Kamranzad and Mori [
9] concluded that the northern Indian Ocean will have less stable wave climate while the opposite is true for the Southern Indian Ocean. They also found that while wave periods will not notably change in future, significant wave heights will be affected by the future change in the Indian Ocean monsoons. Bashkaran et al. [
10] using wind-generated wave climate derived based on satellite observations, postulated that waves in the northern Indian Ocean will be increased in future as a result of increasing wave activity in the Southern Indian Ocean due to global climate change. Numerous other studies on climate change impacts of ocean waves have been reported at a range of locations worldwide.
Multi-scale temporal variability of the ocean wave climate highlights the importance of detailed spatio-temporal assessments before embarking wave energy-harvesting projects. Liang et al. [
11] carried out a spatio-temporal wave energy resource evaluation in a small coastal area in China using simulated wave data for a period of 16 years. They identified monthly variations in mean wave power although no attempt has been made to investigate longer term variabilities. Kamranzad et al. [
12] evaluated wave energy resource in the Persian Gulf using a set of numerically simulated wave data over a period of 25 years between 1984 and 2008. They recognized seasonal and decadal-scale variations in wave power and concluded that a small variation in wind climate may lead to significant changes in the available wave power resource. Mirzaei et al. [
13] assessed wave power potential along the east coast of Malaysia using numerically simulated waves over a period of 31 years since 1979. They identified seasonal and inter-annual variations of the wave power resource and established a correlation between wave power fluctuation and local climatic variabilities. Hughes and Heap [
14] assessed the available wave power resource in the Australian shelf using 25 years of wave hindcasts. They identified seasonal variabilities in the wave power resource, consistent with regional weather patterns. Ozcan and May [
15] investigated wave power resource around Florida Peninsular using a set of measured wave data. Based on the currently observed temporal trends of variability to the available wave power resource they speculated future change in wave power as a result of global climate change, but no evidence was provided to form a conclusion. Cutler et al. [
16] assessed seasonal and inter-annual variability of wave power in south-western Australia. They concluded that there may be a reduction in nearshore wave energy in the south-western Australia due to the observed positive trend in the Southern Annular Mode. Numerous other studies have also been reported on multi-temporal variations of wave power resource (e.g., Mirzaei et al., [
13]; Neill et al., [
17]; Sierra et al., [
18]; Lin et al., [
19]; and many others) which highlight the importance of considering numerous timescales when assessing wave power resource.
Most reported studies have been focused on temporal assessments of the currently available wave power resource and its fluctuation over timescales from seasonal to a few decades. However, wave power resource can be significantly influenced by global climate change-induced changes to ocean waves, which can take place at timescales over a several decades to centuries [
20]. As the design life of a wave power development project will in general surpasses a few decades, it is important to investigate long-term variations of available wave power resource that can be potentially linked with global climate change. Although short- to medium-term future variabilities of wave power potential may be evaluated by extrapolating historic trends of variations determined by observed, hindcast, or simulated historic wind and wave data, long-term future changes associated with global climate change can only be assessed using future wave projections using atmospheric outputs from AGCMs or high-resolution Regional Climate Models (RCMs).
Mackey et al. [
21] examined climate change impacts on ocean wave climate and the predictability of wave power in an area off the north coast of Scotland using hindcast wave data for the fifty-year period between 1954 and 2004. They concluded that anthropogenic climate change impacts over a lifetime of a wave farm may be smaller than the natural variability. However, it should be noted that their conclusion was based on hindcasts of historic waves at a time where global climate variabilities may be smaller than the most recent predictions. As a result, the validity of their conclusion may not hold true in future where global climate and its impacts on the oceans rapidly varies over time (IPCC2018). Regero et al. [
22] analyzed seasonal, inter-annual, and long-term variability of global wave power using 60 years of wave data. They concluded that inter-annual change of wave power in the Northern Hemisphere, where seasonality is highest, is significant. They also concluded that natural variability of wave power over a lifetime of a wave farm will be more relevant than the historic long-term changes. Regero et al. [
23] studied global change in wave power because of oceanic warming due to climate change. They found that the wave power in ocean basins has increased globally by 0.4% since 1948. Reeve et al. [
24], using wave forecasts based on Inter-governmental Panel for Climate Change 2009 (IPCC2009) A1B and B1 wind scenarios from the Coupled Model Inter-comparison Project phase 3 (CMIP3) between 2061 and 2100, found that available wave power in the south-west of the UK will decrease by 2–3% in future. Kamranzad et al. [
25] investigated the climate change impacts on wave energy resource in the Persian Gulf, using future wave projections derived based on atmospheric wind outputs from a global climate model, covering a 30-year period from 2071 to 2100. They found that wave energy resource in the Persian Gulf will notably change in future and the amount of variability depends on the global climate change scenario. Sierra et al. [
26] investigated climate change impacts on wave power resource around Menorca, Spain using wave data generated by a multi-model ensemble. They found a slight reduction in seasonal and annual average future wave power. Kamranzad et al. [
27] assessed climate change impacts on the available wave energy resource in the Indian Ocean using numerically simulated wave data over a period 25 years at the end of the 21st century. They used several time-dependent criteria and identified wave energy hotspots in the Indian Ocean which includes the south of Sri Lanka.
The above studies highlight the importance of detailed analysis of climate change impacts on the future wave power resource before embarking any future wave energy development. In this paper, we will assess the implications of global climate change on the ocean wave power resource around Sri Lanka, which has been identified as a wave energy hotspot in the Indian Ocean. We will also investigate the stability and sustainability of the wave power resource in future, when compared to the present situation that prevails under the current global climate. Present and future wave data used in this study are derived from the spectral wave model SWAN, using climate information provided by the GCM MRI-AGCM3.2S [
28].
2. The Study Area and Its Characteristics
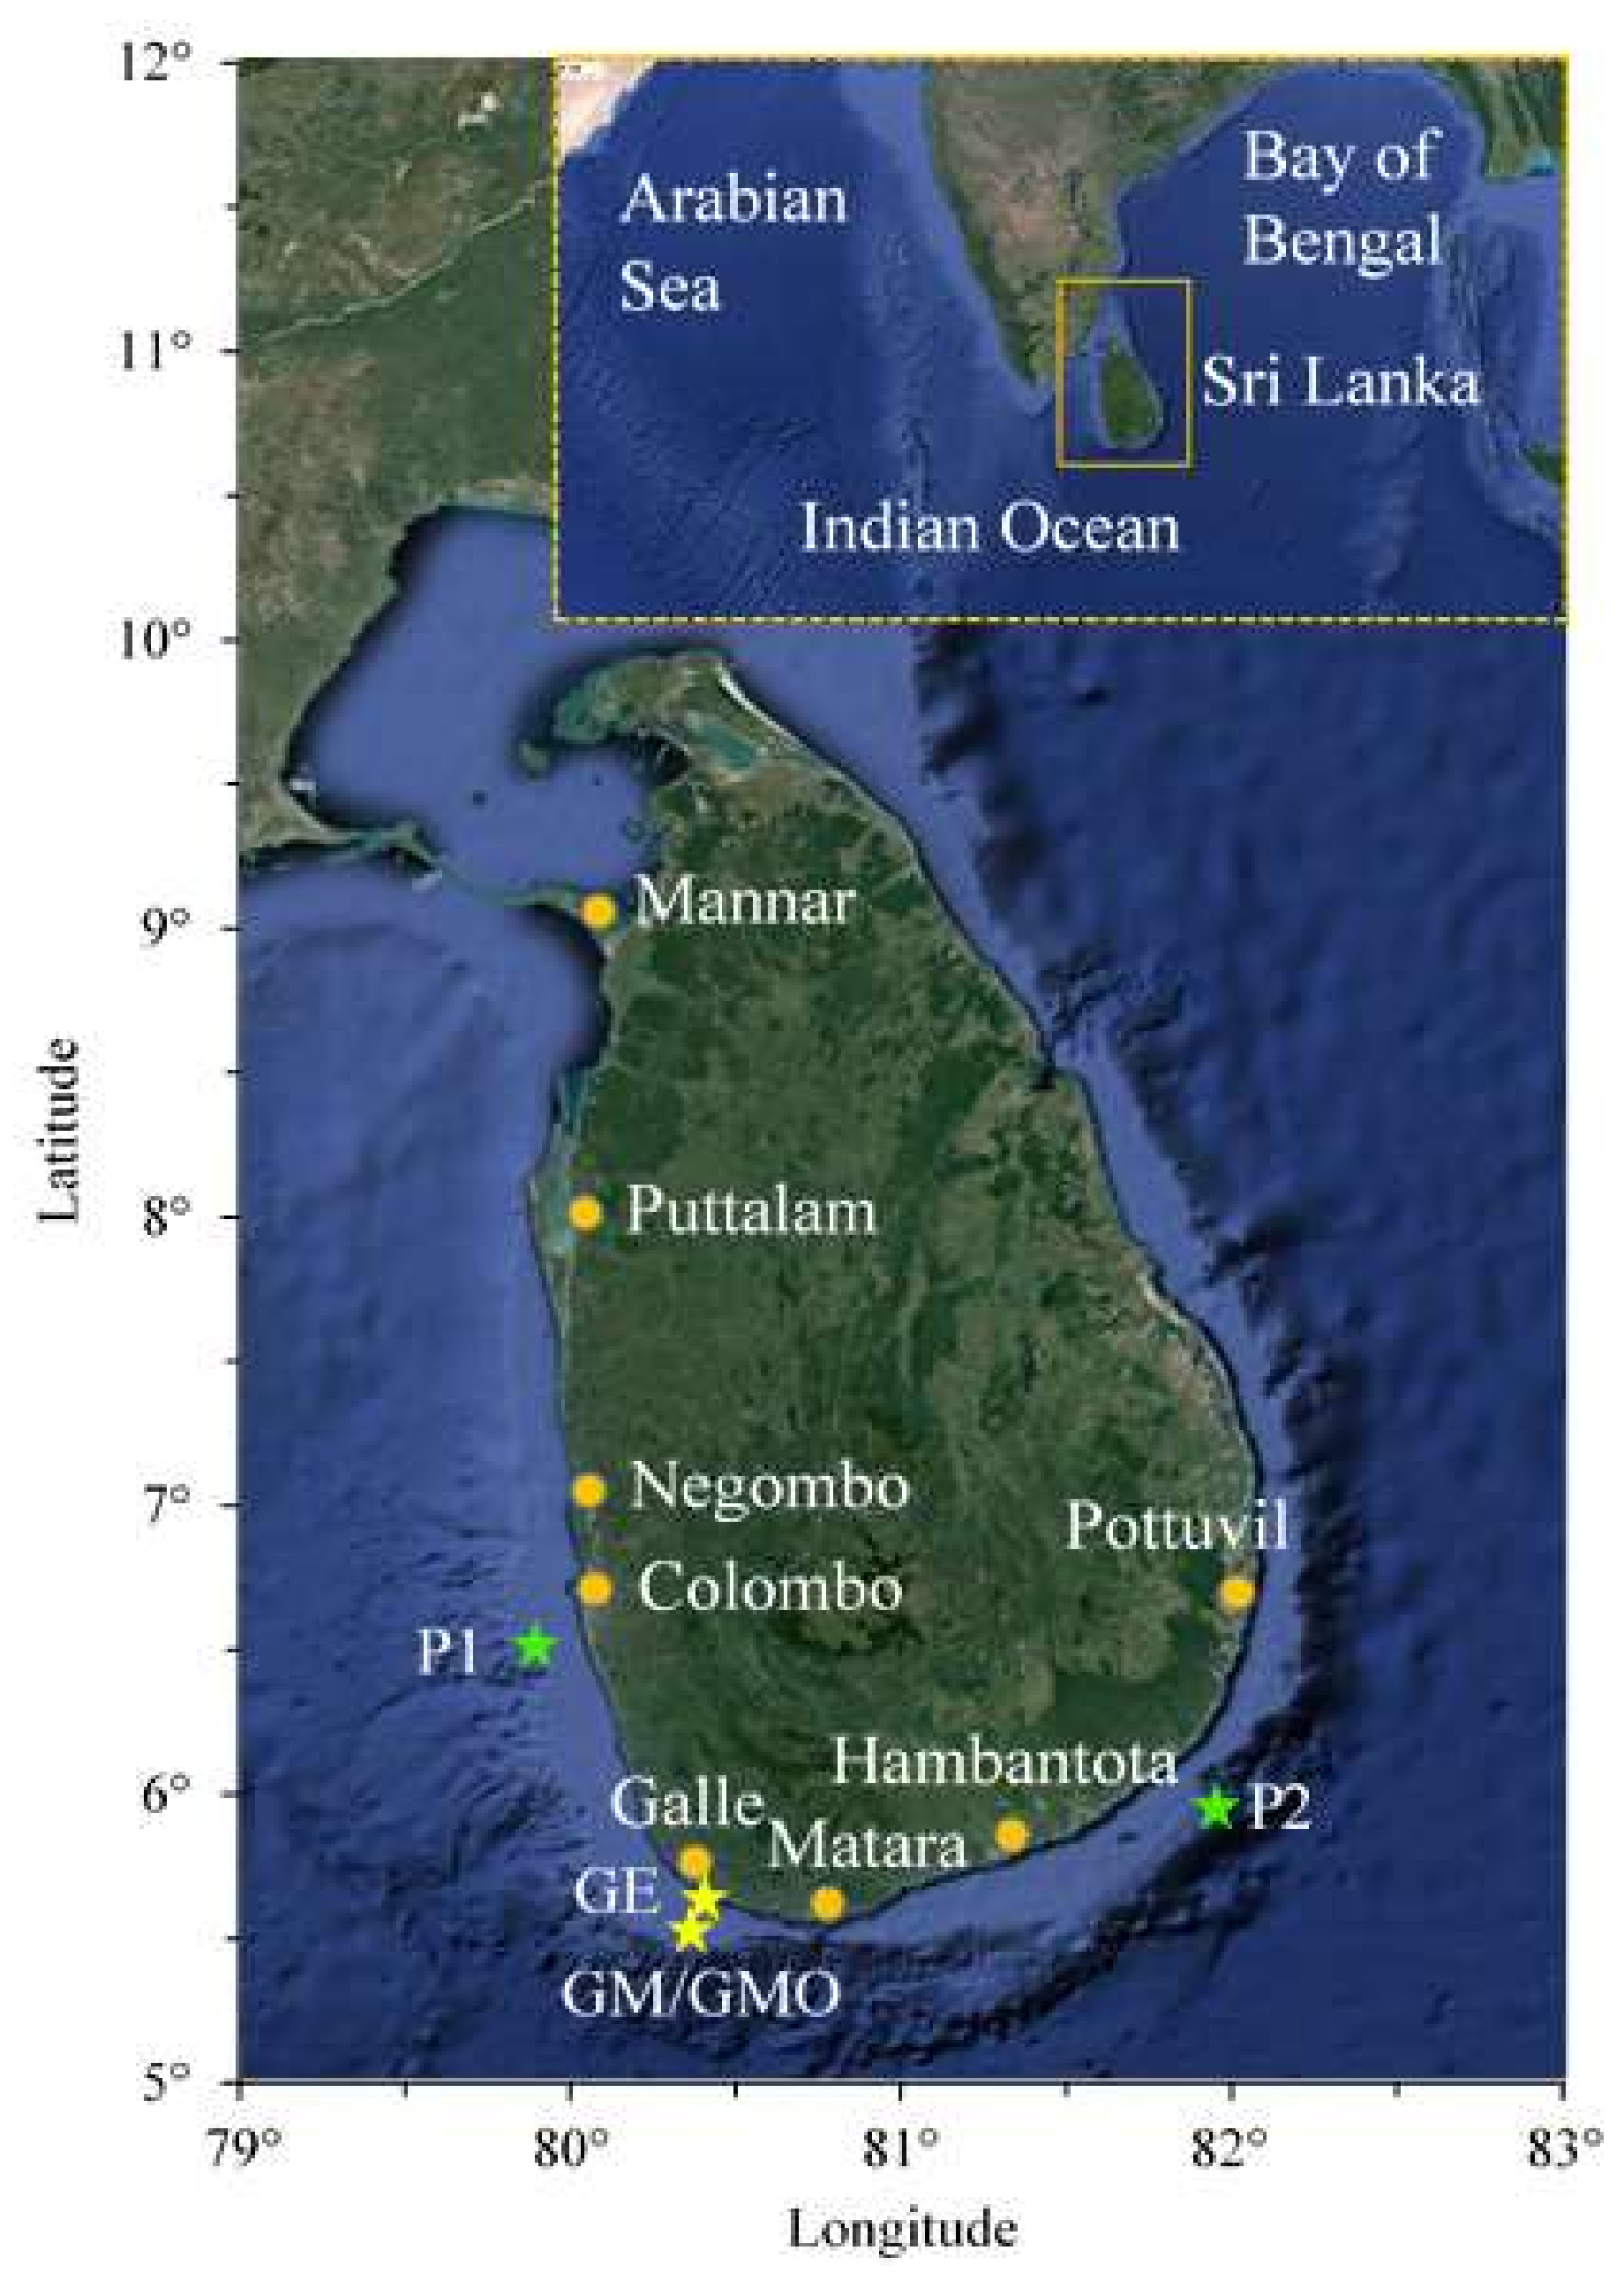
Sri Lanka is in the northern Indian Ocean between 5–10° north of the equator and between 79–82° longitude (
Figure 1). The country receives energetic swell waves propagating from the south, thus making it an ideal location for ocean wave energy-harvesting [
29]. As a member of the Global Vulnerability Forum, Sri Lanka is currently exploring renewable alternatives for its heavily fossil fuel-dependent power generation. The Sri Lankan Government has identified ocean wave power as a potential green energy alternative which needs to be explored further.
Sri Lanka is surrounded by a narrow continental shelf of width varying between 5 km and 25 km, which separates the island from the Indian sub-continent. The narrowest shelf is located off the coast of Matara (
Figure 1) in the south coast. The water depth at the margin of the shelf varies between 50 m to 200 m. The water depth beyond the edge of the shelf sharply increases to more than 1000 m within a very short distance because of the extremely steep slope at the shelf. Long-distance swell waves generated in the Southern Indian Ocean directly approaches the western and southern shores of Sri Lanka all year round. The swell wave approach direction is found to be predominantly south [
29]. The swell waves are superimposed and modulated by the highly energetic south-westerly wind waves generated during the tropical south-west monsoon that operates in the northern Indian Ocean between May and September. The tropical north-east monsoon, which falls between December and February, generates high wind waves in the north and east [
30]. Wave measurements have been reported in the south-west coast offshore of Galle [GM-(5.93° N, 80.23° E) in
Figure 1] at a water depth of 70 m over a period of 3.5 years between 1989 and 1992. Waves had been measured using a DATAWELL B.V. directional wave rider buoy for a 30 min duration over every 3 h. The measurements had been carried out by the Coast Conservation and Coastal Resources Department of Sri Lanka in collaboration with the German Agency for Technical Corporation (GTZ) [
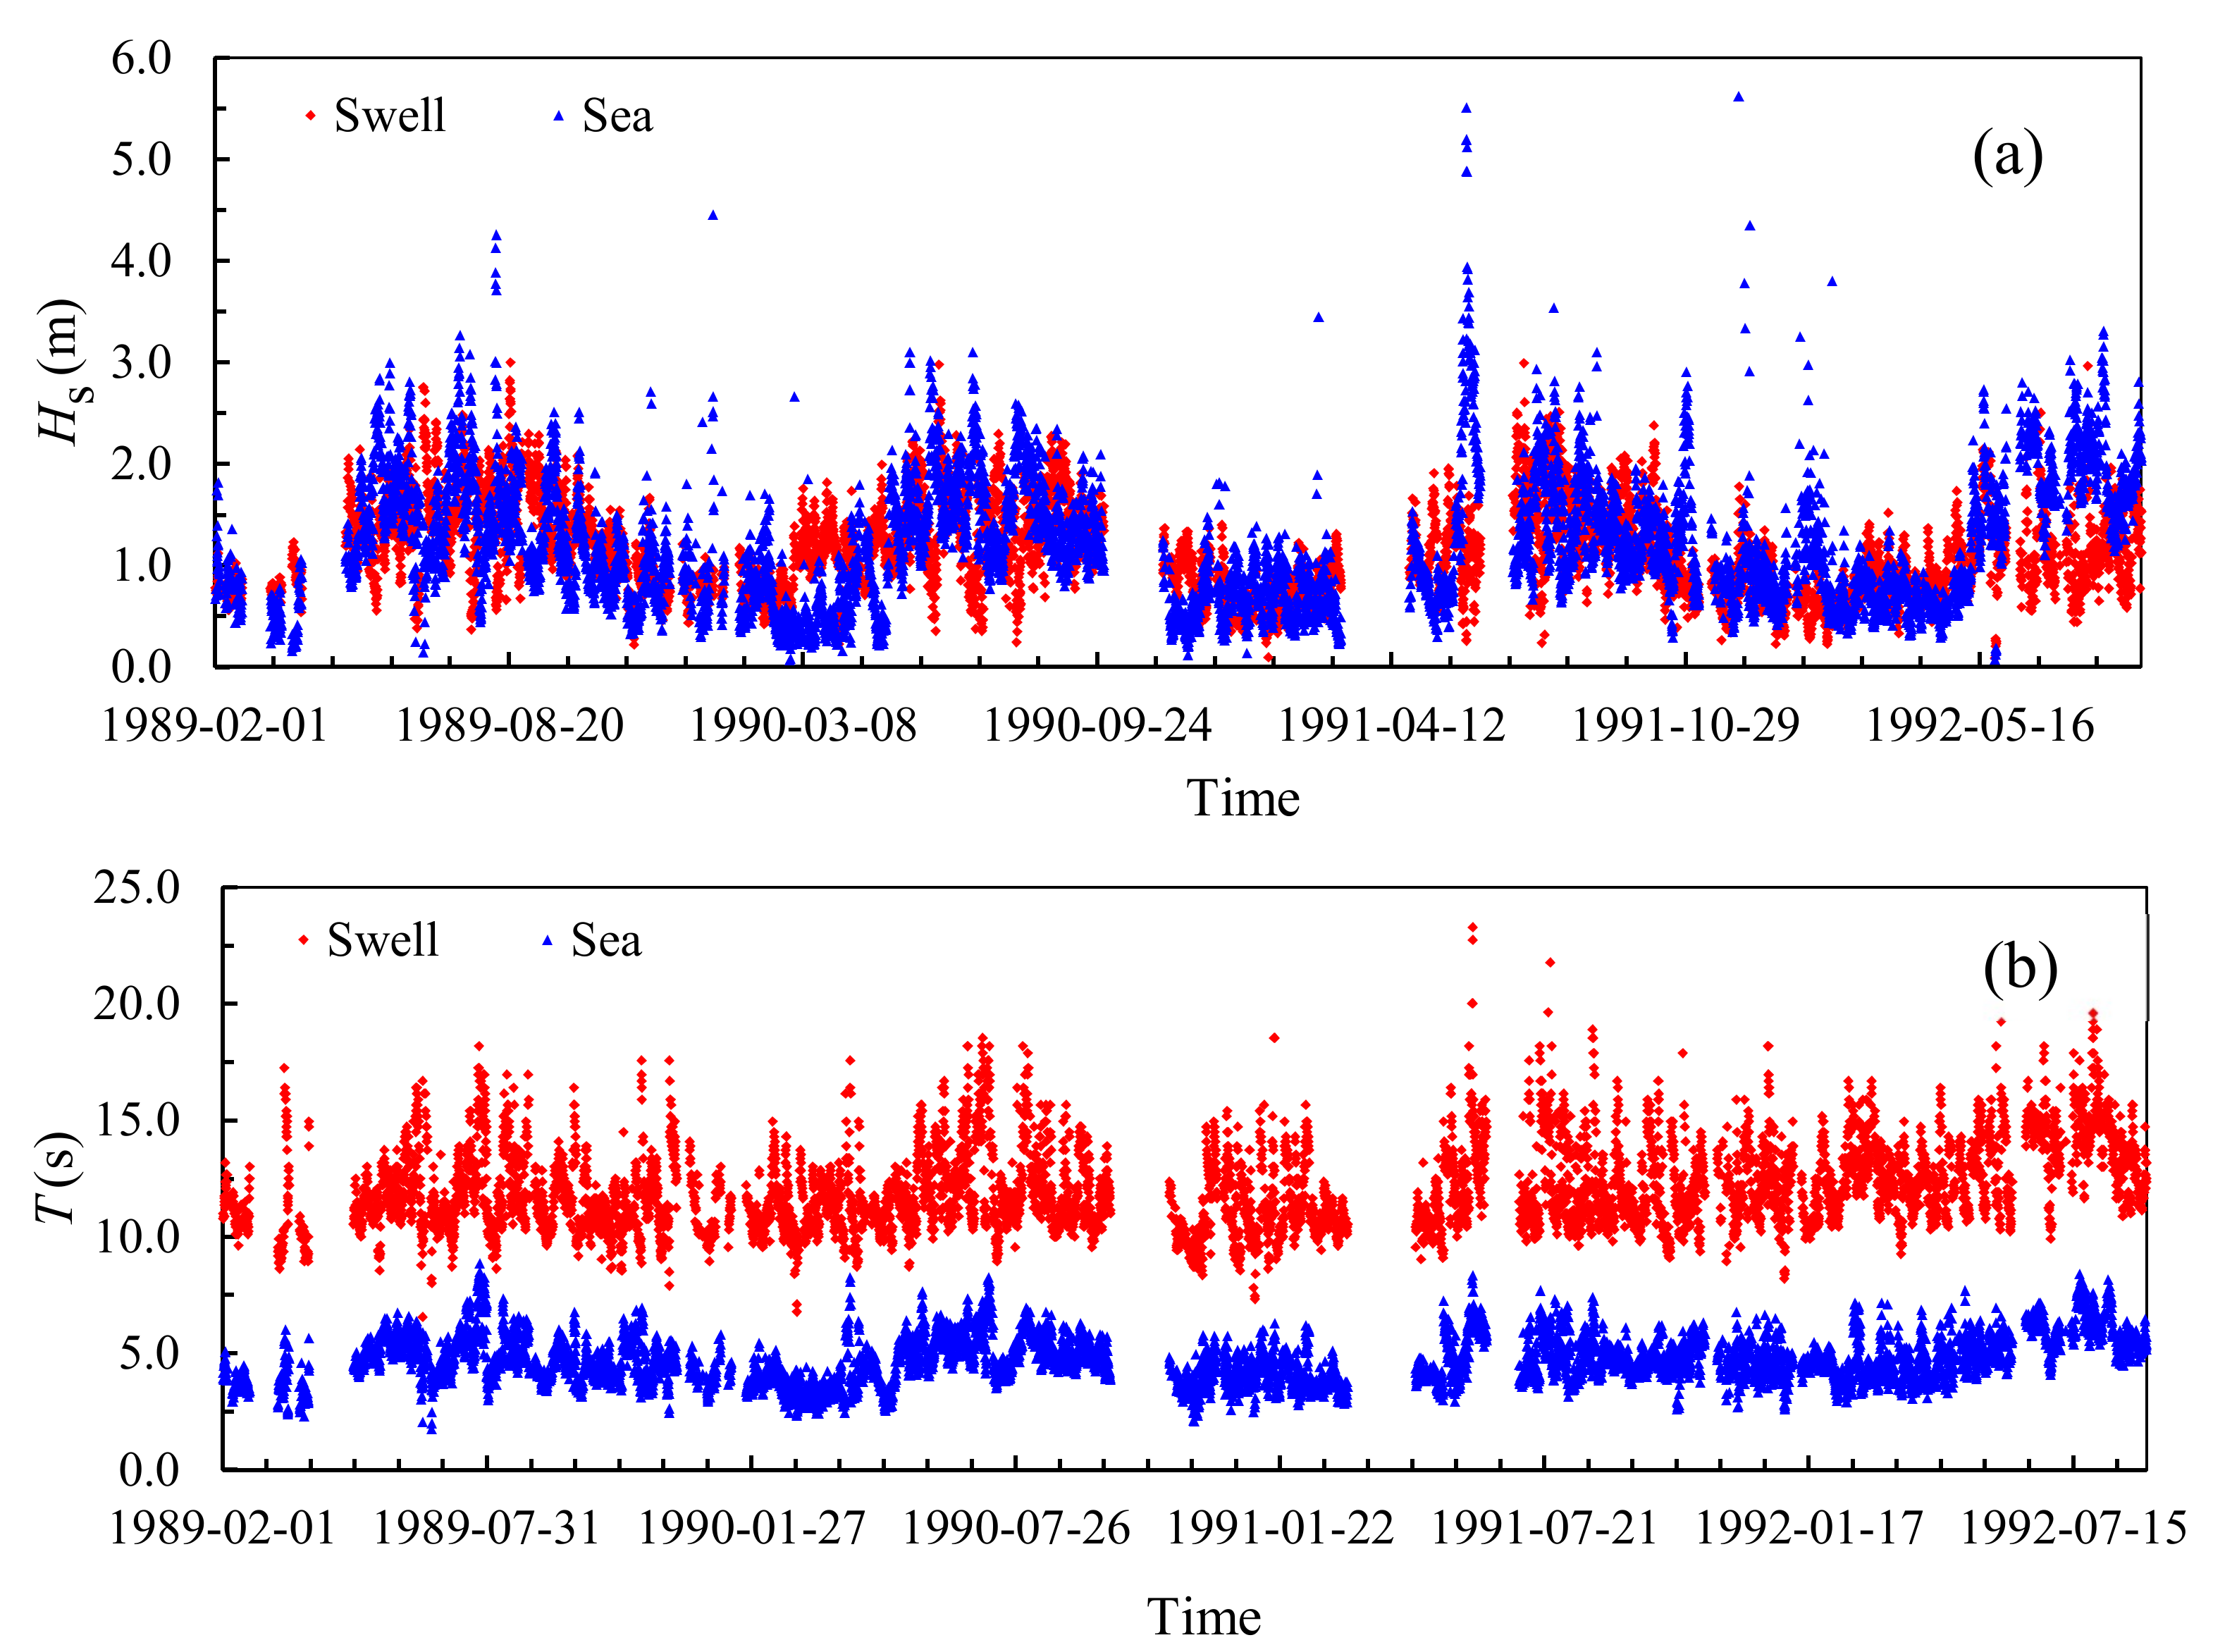
29]. According to those measurements the significant swell wave heights vary between 0.5 m and 2.5 m while that of locally generated wind waves vary between 0.2 m and 3.0 m. Local wind waves found to have average wave period of 4 s while that of swell waves is 11 s [
29]. The predominant swell approach direction is south while wind waves approach predominantly from the south-west direction. The 5, 50, and 100-year return period significant wind wave heights during the south-west monsoon are found to be 4.12 m, 5.22 m and 5.58 m and that of swell waves are 2.82 m, 3.00 m and 3.03 m respectively [
31]. A typical wind-sea and swell significant wave height and wave period time series collected at this location is shown in
Figure 2, which clearly indicates the impact of the south-west monsoon on the incident wave climate.
Sri Lanka is vulnerable to tropical cyclones although they are not frequent. Most cyclones affect the east and north-east coasts of Sri Lanka while a few, which were generated in the Arabian Sea, have been reported to reach from the west [
32]. However, impact of cyclones on the wave power resource may be small because of the rarity of these extreme events.
3. Present and Future Ocean Wave Projections for Sri Lanka Region
Present and future ocean wave climate around Sri Lanka was simulated using a cascade of computational wave models. The waves have been simulated using wind outputs from the super-high-resolution Atmospheric Global Climate Model (AGCM) of the Japan Meteorological Agency, MRI-AGCM3.2S [
28]. The AGCM has used future climate scenario of Representative Concentration Pathway (RCP) 8.5, as defined by representative trajectories of increasing global radiative forcing reaching +8.5 W m
−2, by the year 2100 compared to pre-industrial conditions [
33]. The spatial and temporal resolution of wind inputs provided by the AGCM were 20 km and 1 h, respectively. SWAN spectral wave modelling software [
34] was used to simulate waves, as reported in detail in Kamranzad and Mori [
9]. In SWAN, wave spectrum is described by the spectral action balance equation given in Hesselmann and Hesselmann [
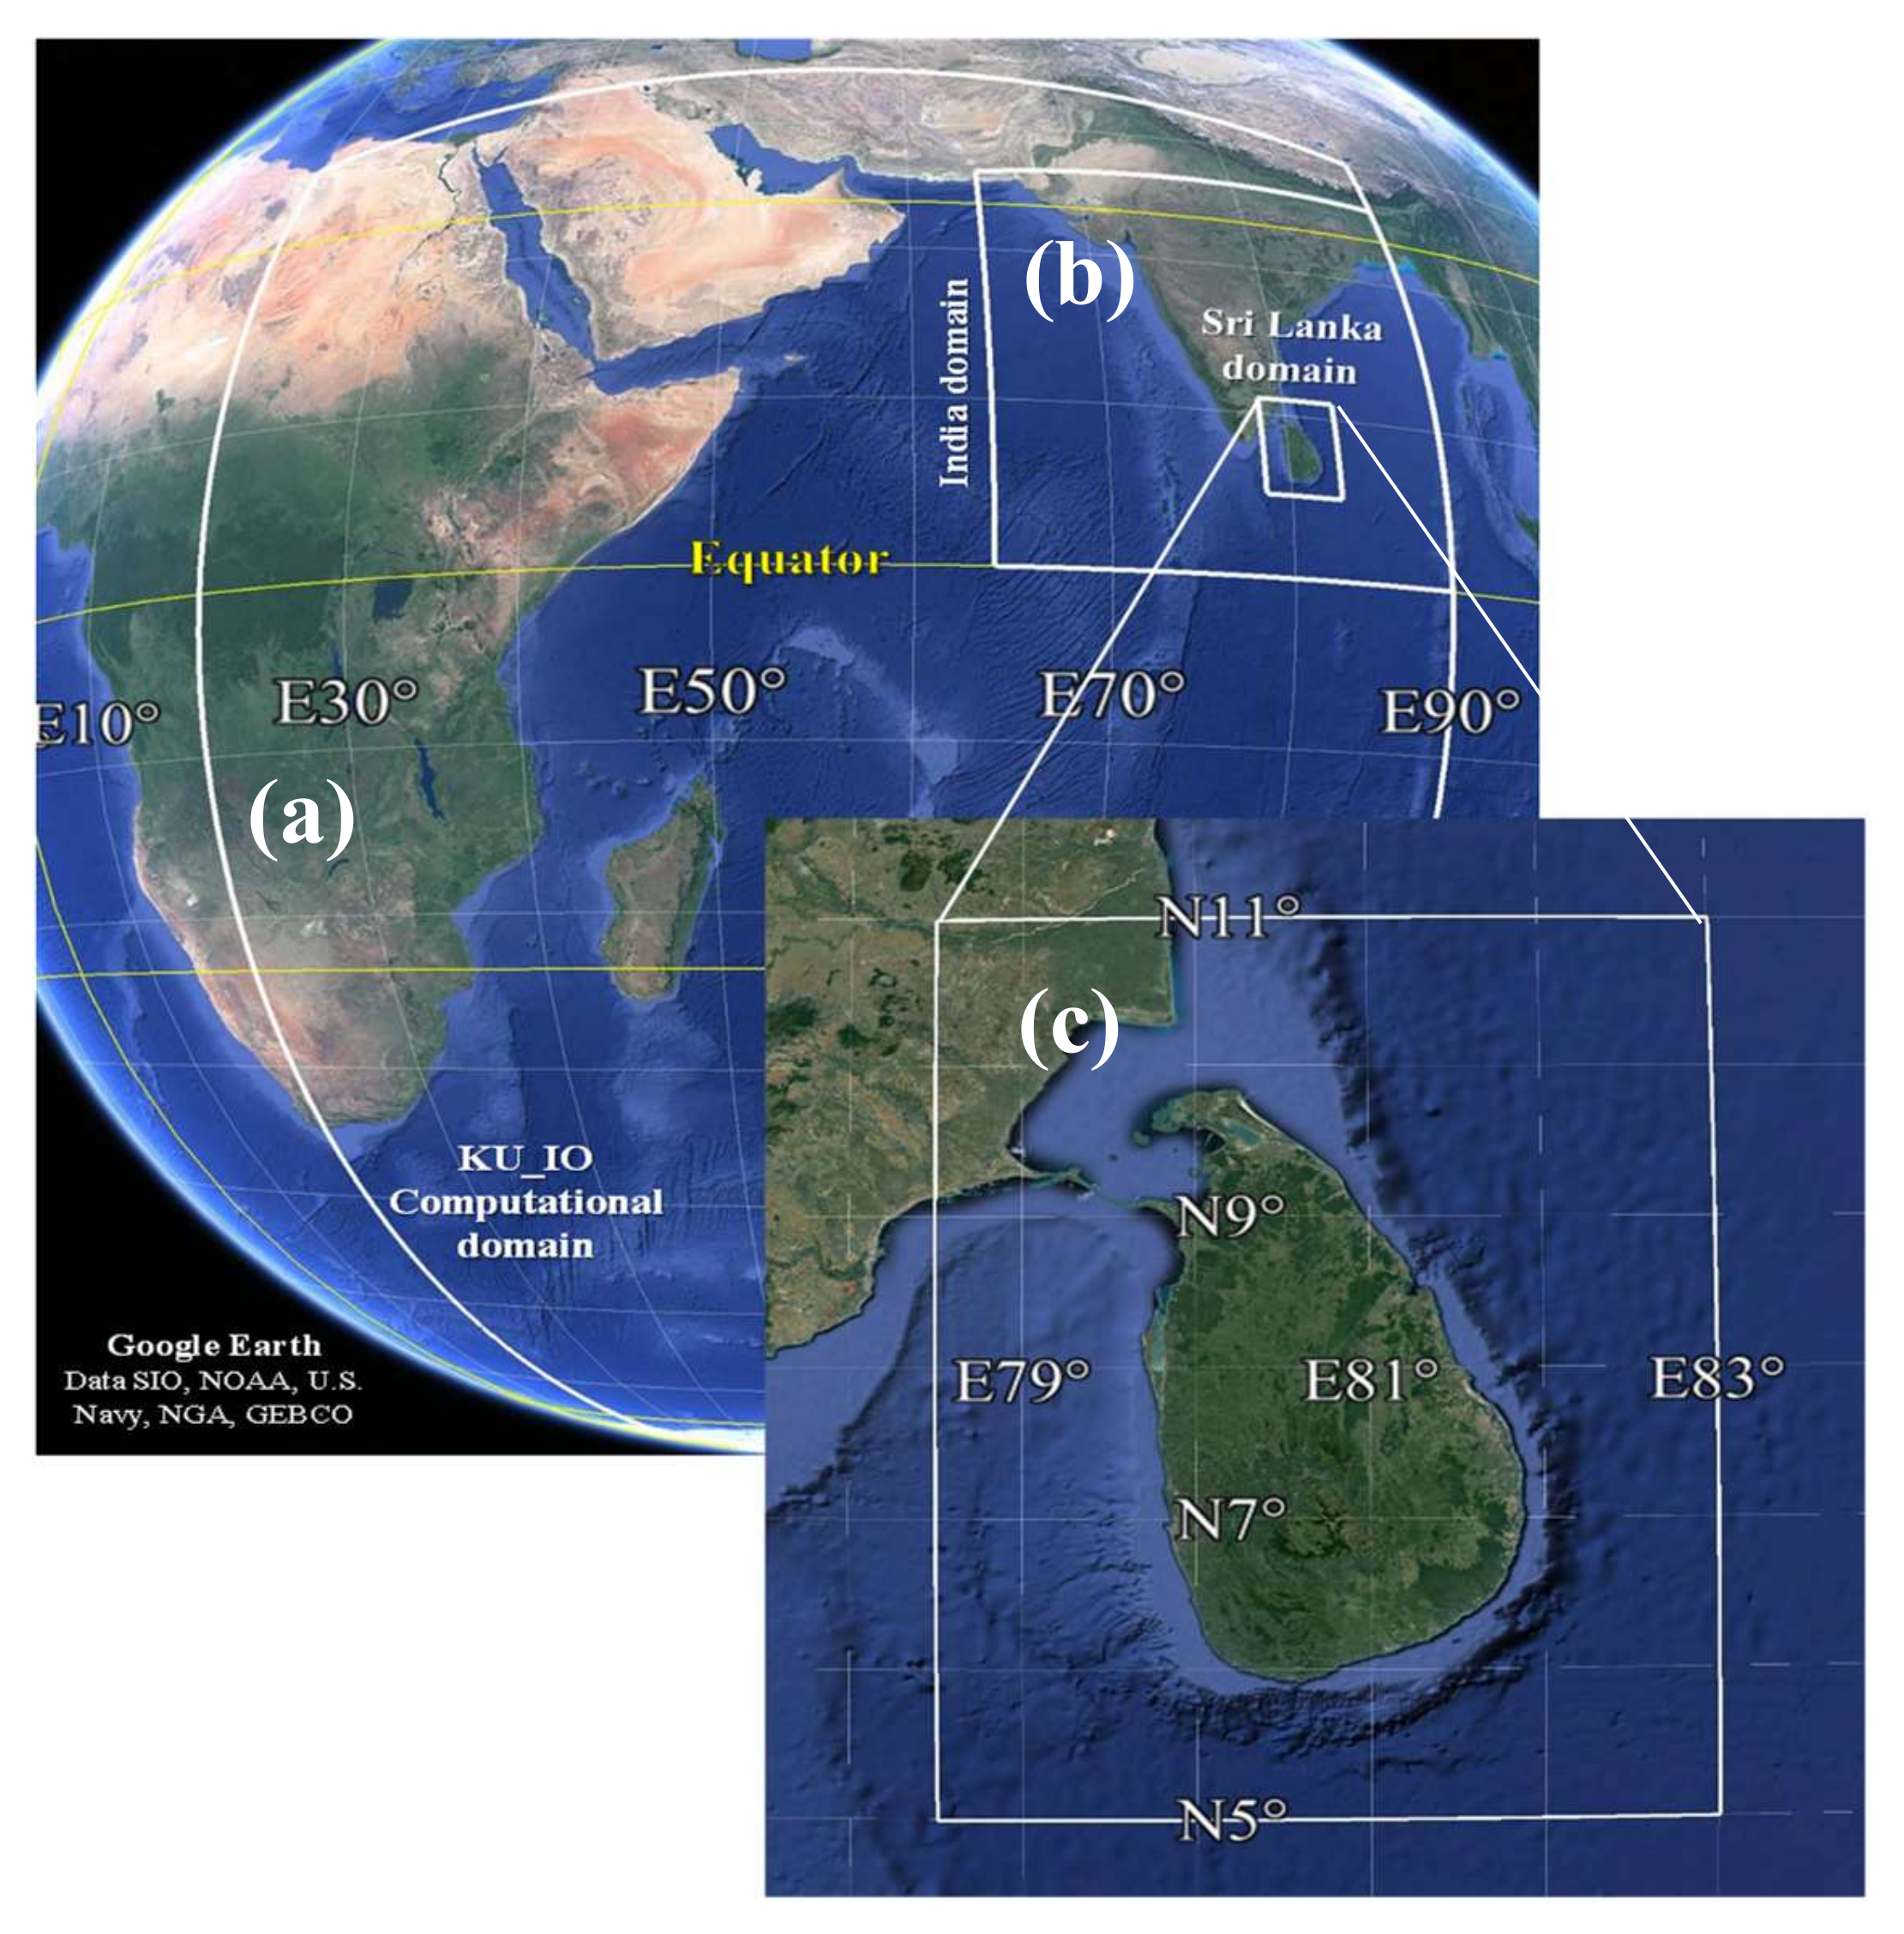
35]. Wave dissipation in the model takes place due to white capping, bottom friction, and depth-induced breaking. However, waves simulated in this study are either in deep or in intermediate water depths. Therefore, depth-induced breaking and dissipation due to bottom friction are not applicable. Wind outputs were first used to simulate the Indian Ocean wave climate, using the KU_IO model domain shown in
Figure 3. The KU_IO model domain covers the area between 20–90° E in longitude and −70–30° N in latitude of the Indian Ocean. The wind source term required for generating waves in the wave model was calculated following Komen et al. [
36]. Non-nonlinear quadruplet wave-wave interaction formulation of Hesselmann and Hesselmann [
35] was used. The frequency domain consists of frequencies from 0.03 to 1 Hz with 36 bins on a logarithmic scale. The directional computational grid was divided into 36 bins of 10°.
The KU_IO wave model has been extensively validated using satellite derived historic wave data at several locations in the Indian Ocean. The validation results reveal that the model can simulate the current wave climate of the entire Indian Ocean very satisfactorily. A detailed description of the model development, calibration and validation is given in Kamranzad and Mori [
9]. The validated KU_IO model was used to generate significant wave height (
Hs), mean spectral wave period
Tm01 and wave direction for two 25-year time slices; (i) between 1979–2003, representing the “present” wave climate and; (ii) between 2075–2099, representing the “future” wave climate.
KU_IO wave model predictions provided boundary conditions for a smaller, India regional scale wave model (KU_IND) that covers 64–90° E and 0–26° N region with spatial resolution of 0.166° × 0.166°. KU_IND generated 25 years “present” and “future” wave climate at 6 h intervals. Finally, a small-scale Sri Lanka local model (KU_SLK) (5–11° N, 79.5–83.5° E) was nested to KU_IND to determine high-resolution ocean wave climate around Sri Lanka for the same “present” and “future” time slices. The spatial resolution of the Sri Lanka model domain was 0.05° × 0.05°. The wave outputs were generated with the same temporal resolution as that of the KU_IND model. The three model domains used for wave simulations are shown in
Figure 3. The models use General Bathymetric Charts of the Oceans (GEBCO) seabed bathymetry data with 30 arc-second spatial resolution (
https://www.gebco.net/data_and_products/gridded_bathymetry_data/).
The KU_SLK model was validated against the wave data collected Galle (GM in
Figure 1) and also against Interim Global Atmospheric Reanalysis wave data produced by the European Centre for Medium-range Weather Forecasts (ECMWF) (ERA-Interim) (
https://apps.ecmwf.int/datasets/) at three locations around the coast (GE, P1, and P2 in
Figure 1). A summary of the wave data used for model validation is given in
Table 1.
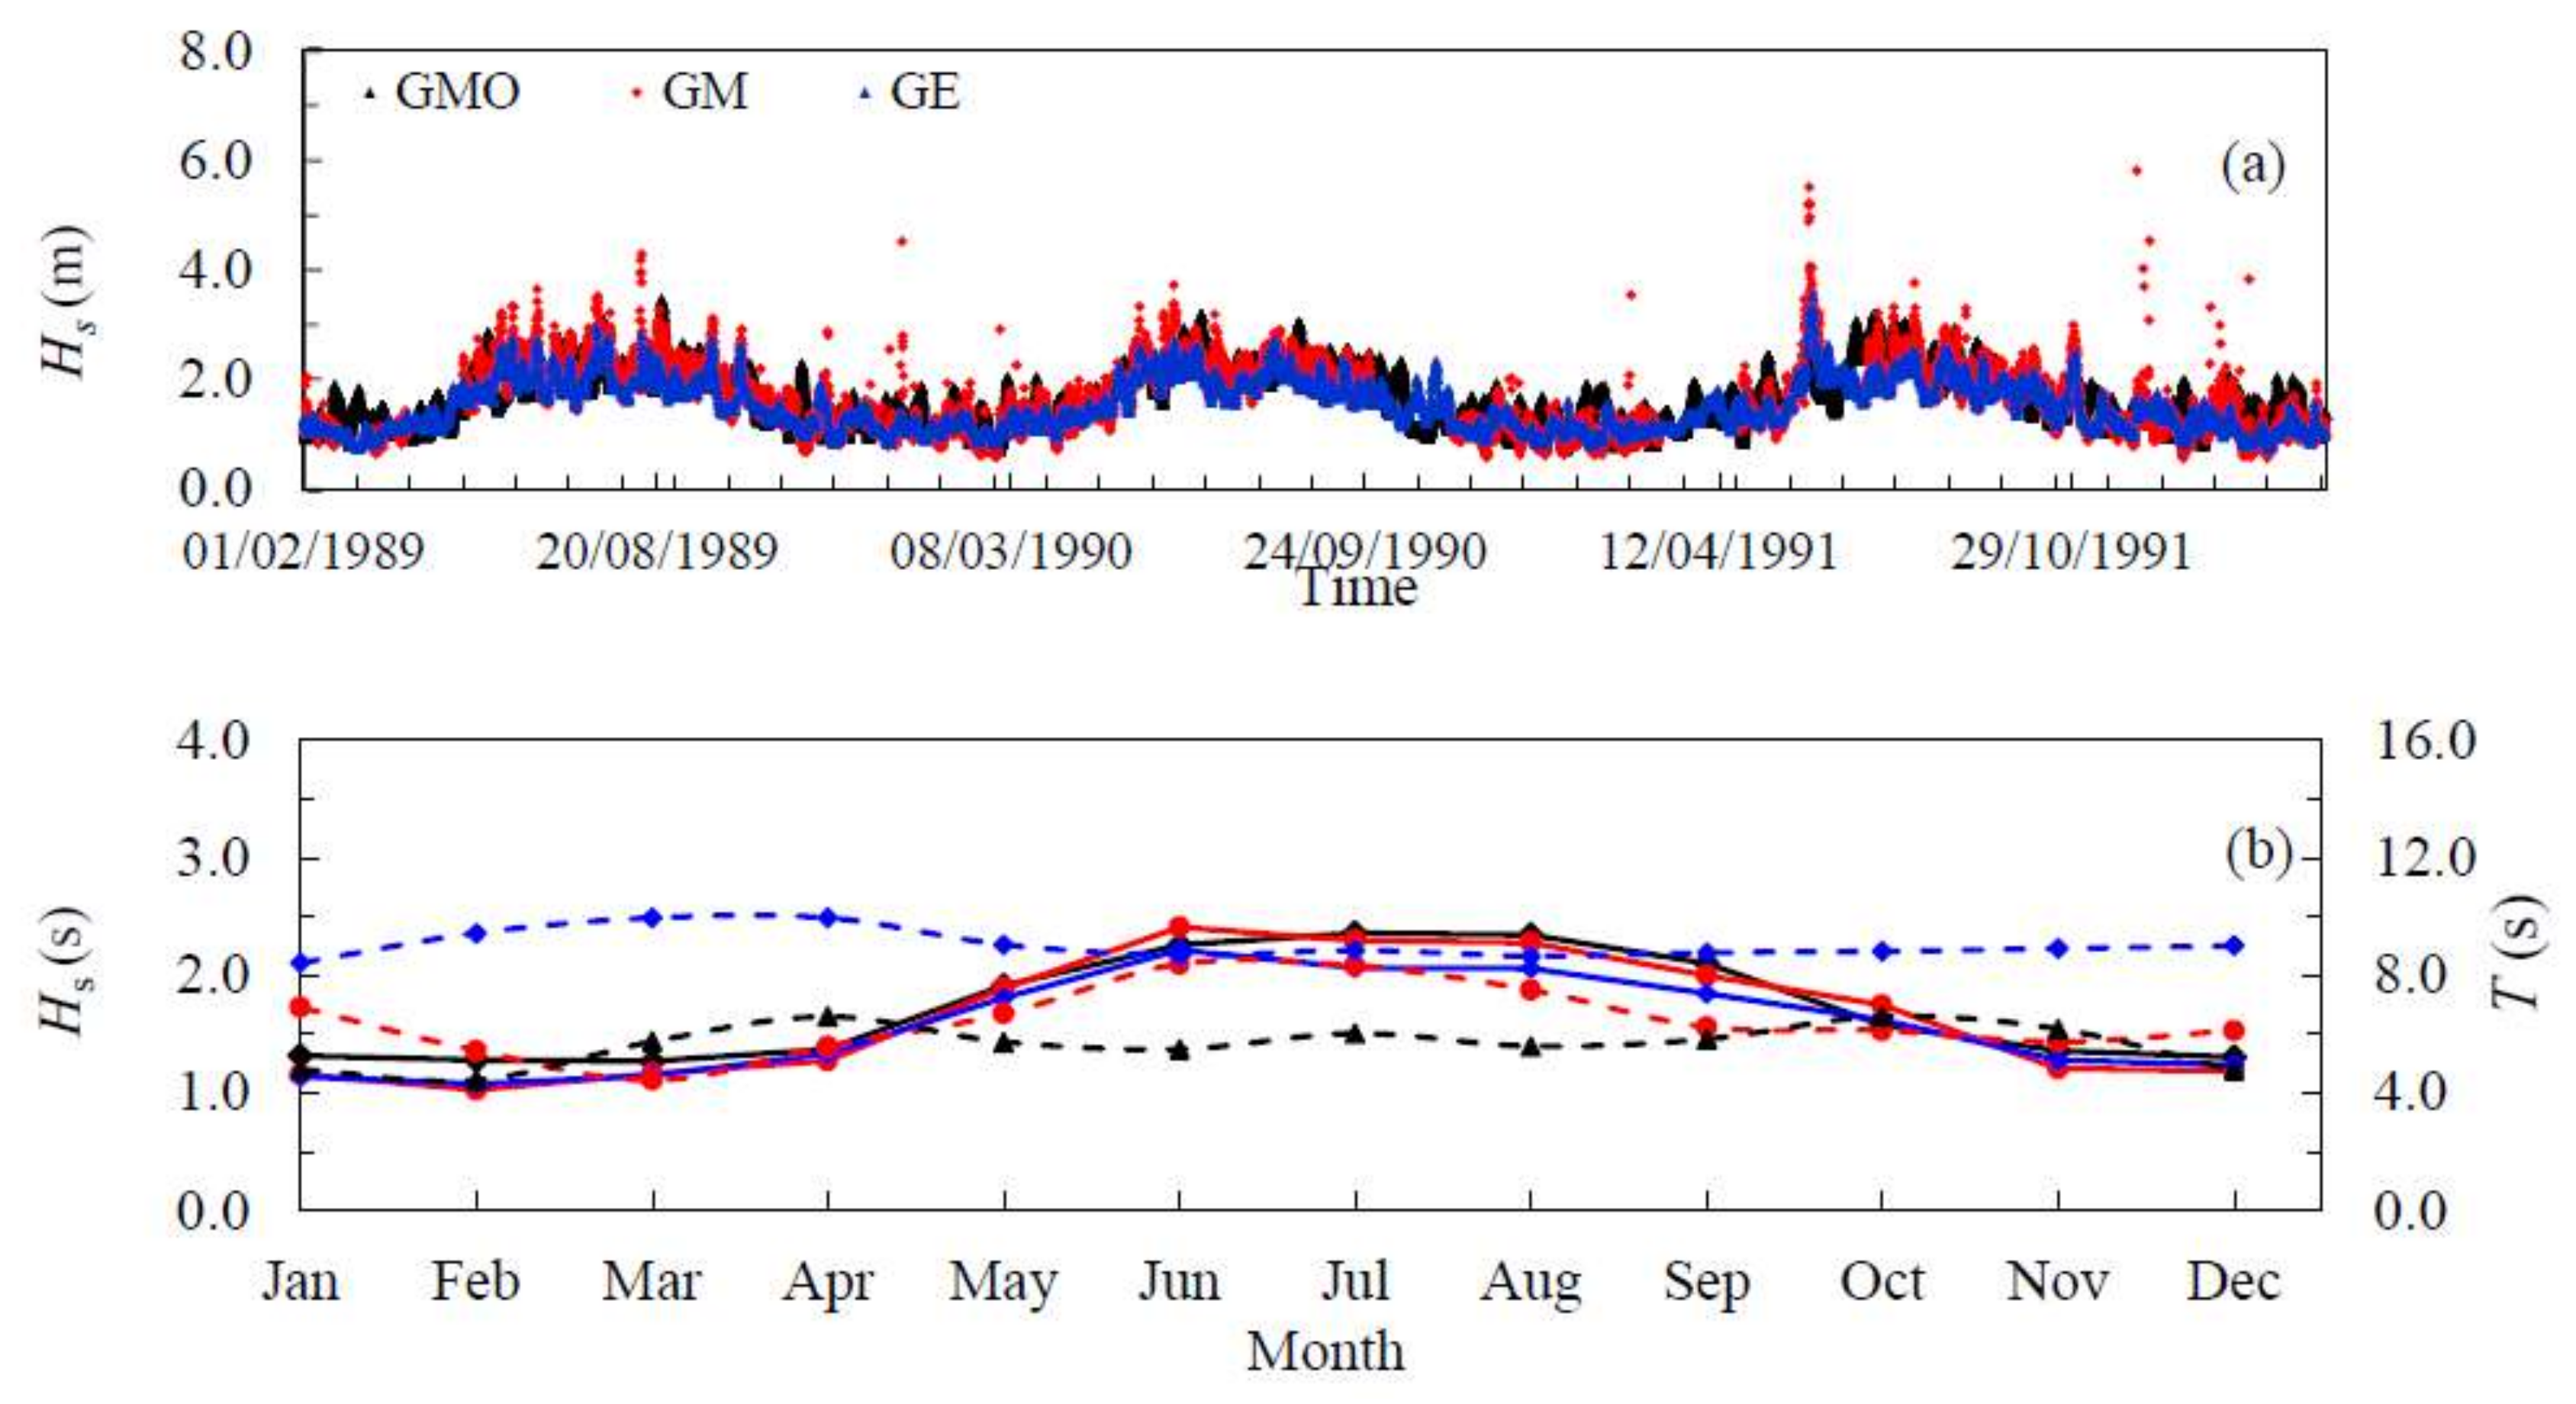
In
Figure 4, a comparison of measured, ERA-Interim Reanalysis and simulated wave data is shown. The model-derived significant wave heights satisfactorily resemble the measured and ERA Interim significant wave heights. Some differences are seen between measured, model-derived, and ERA Interim wave periods. It should be noted that measured and model-derived wave periods are
Tm01 (=
where
m0 and
m1 are the zeroth and the first moment of the wave frequency spectrum) while ERA-Interim wave data provides
Tm02 (=
where m
2 is the second moment of the wave frequency spectrum). Further results and an extensive discussion on validation of the Sri Lanka local wave model can be found in Karunarathna et al. [
33].
4. Climate Change Impacts on the Ocean Wave Energy Resource
The KU_SLK wave model provided wave simulations for two time slices, representing “present” and “future” wave climate of the Sri Lanka region: 25-years wave data for the period between 1979–2003, representing the present wave climate and between 2075–2099, representing the future climate, as described in
Section 3, to investigate climate change impacts on wave power potential of Sri Lanka.
The tropical monsoon systems operating in the northern Indian Ocean generates a complex seasonal variability of ocean wave climate around Sri Lanka. Although monthly averaged modelled and measured wave heights and periods agree well as seen in
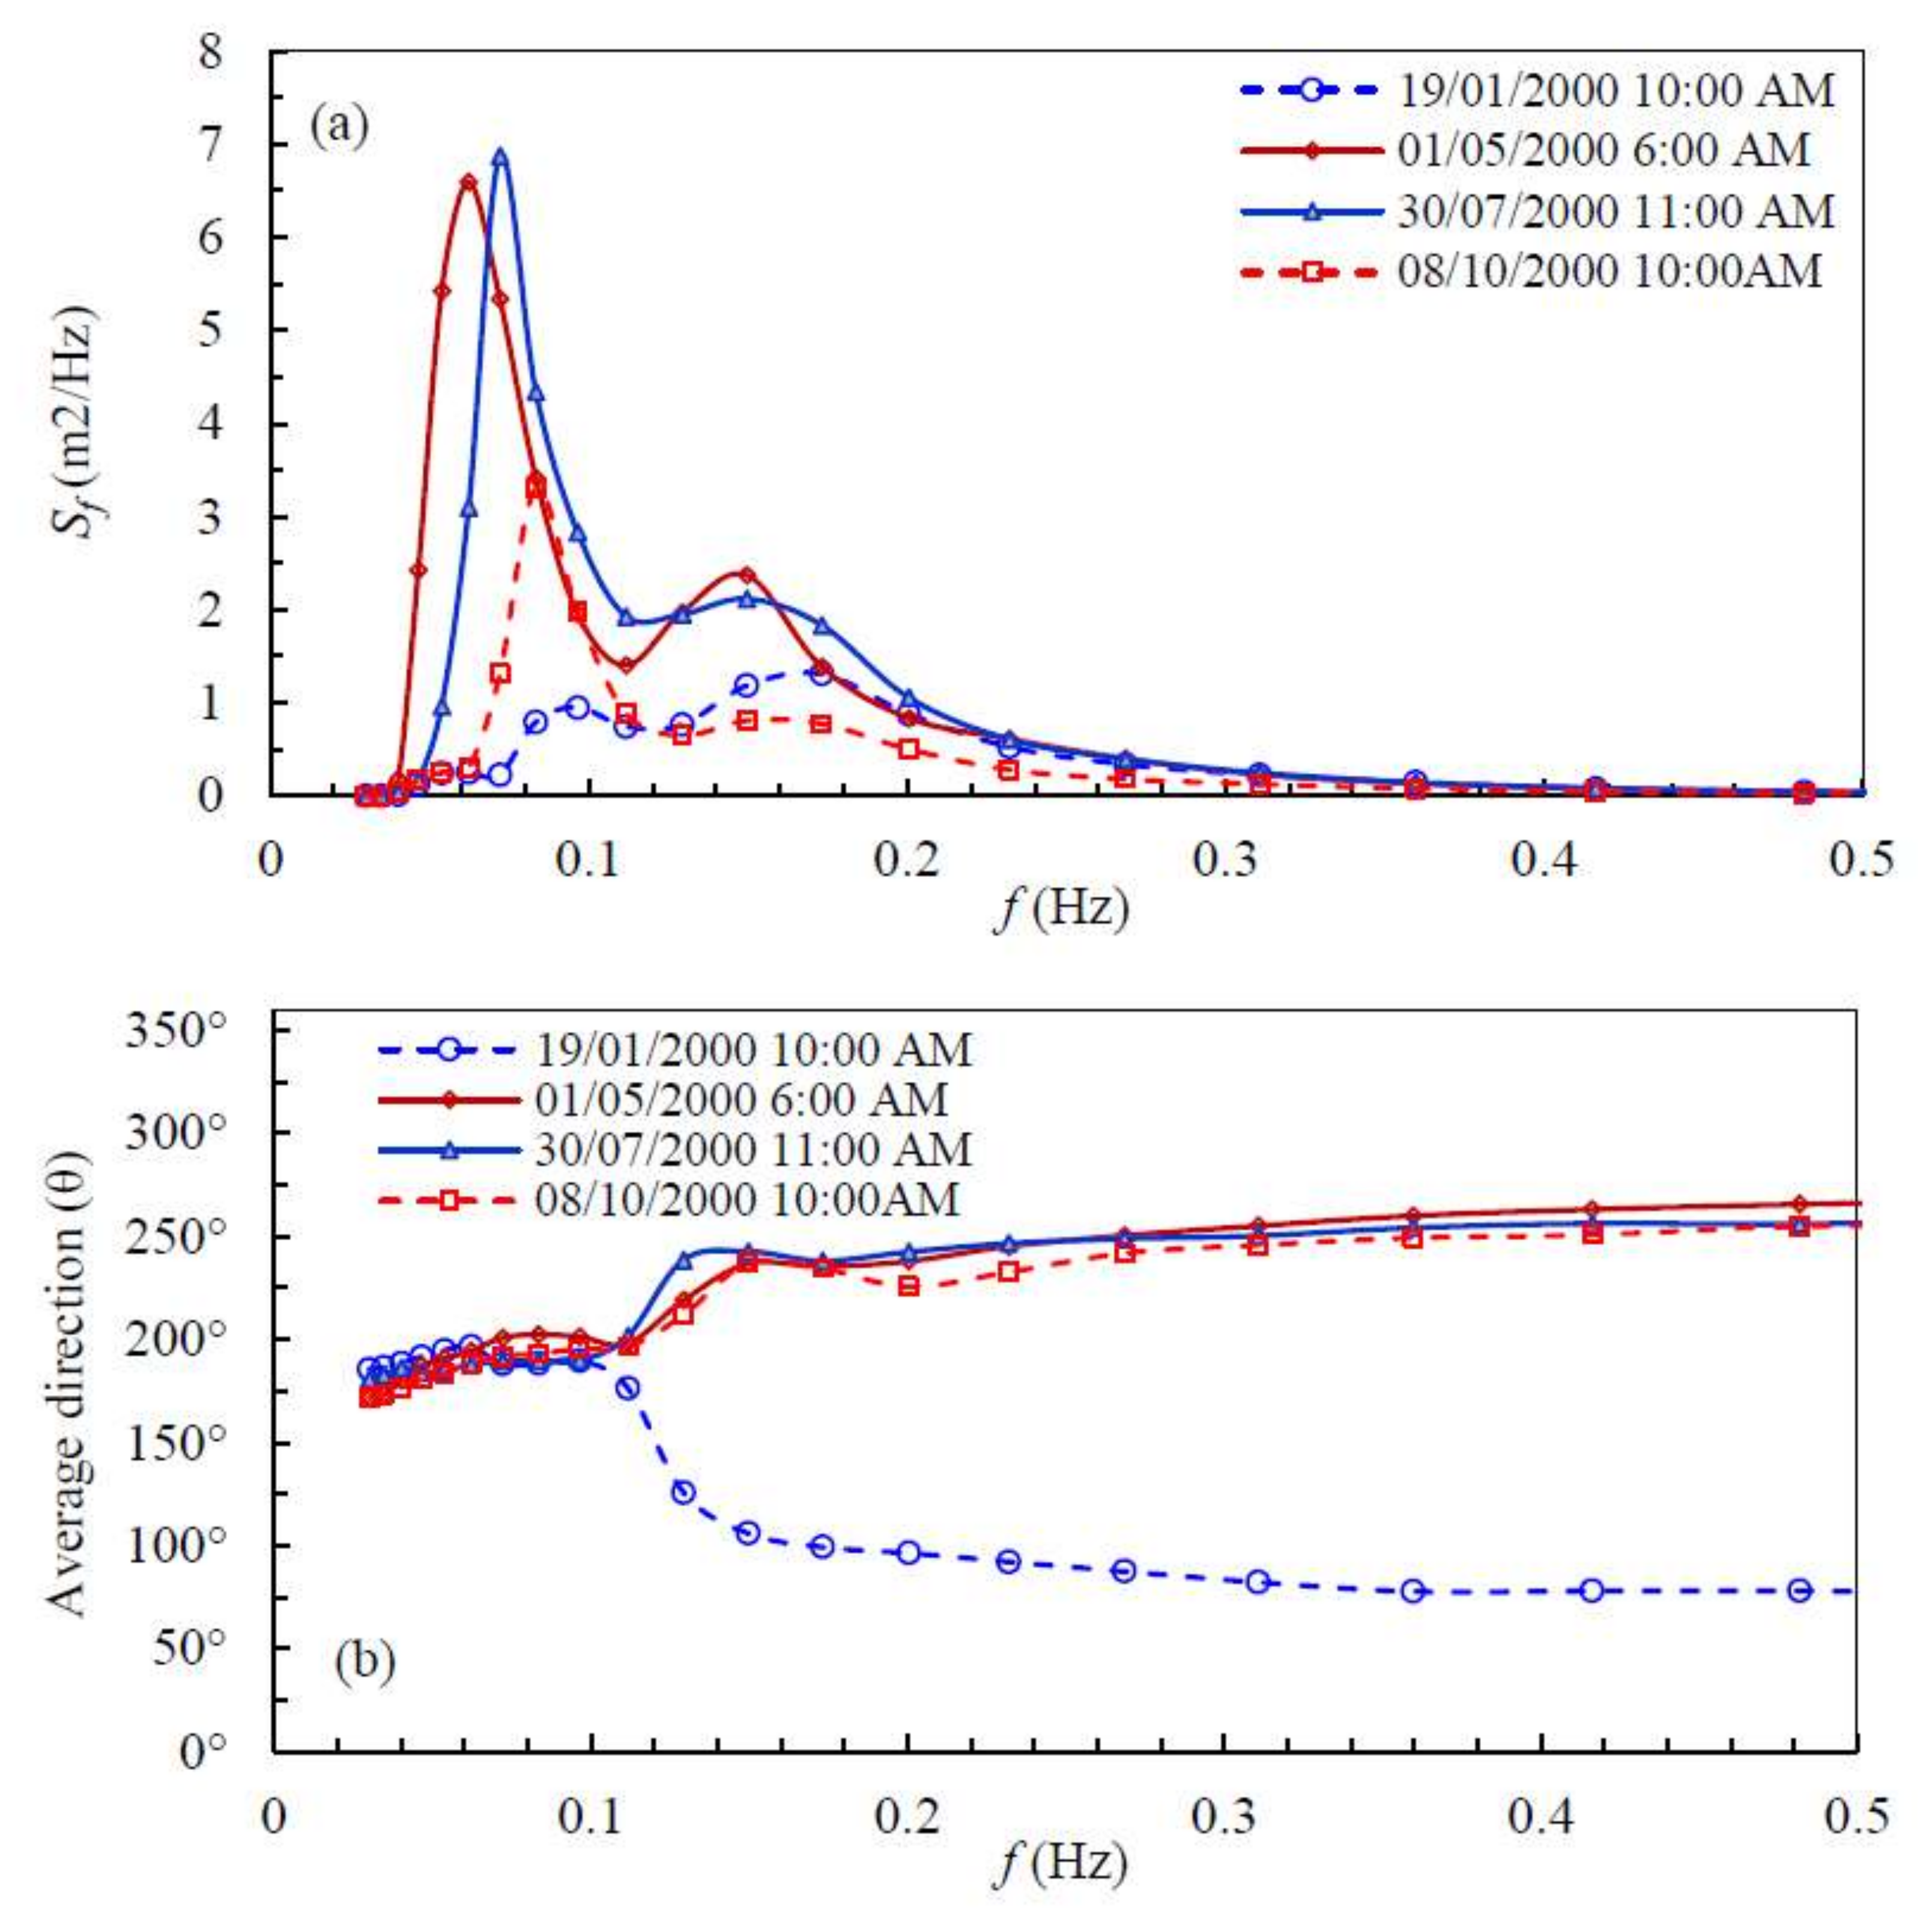
Figure 4, modelled intra-annual variation of wave climate at a location south-west of Sri Lanka is also examined in detail to ensure the model’s ability to capture the seasonal variation of the wave climate, before using the model outputs to investigate climate change impacts on the wave power resource. The spectral densities
Sf (m
2/Hz) and wave approach direction of the incident waves at GMO (the closest model grid point to Galle wave buoy location GM) at four different times in 2000 are shown in
Figure 5. The dominance of swell waves during most of the year is apparent from the bi-modal wave frequency spectrum. A significant proportion of local wind waves (peak frequency fp ~ 0.15 Hz) can be seen during the south-west monsoon period which falls between May to September. The predominant swell wave approach direction is the south while that of sea waves is south-west except for January which falls within the north-east monsoon period where predominant wind direction is north-east. The modelled wave frequency spectra are in excellent agreement with the measured spectra given in Sheffer et al. [
29]. An extensive evaluation of wave power resource available under the current climate can be found in Karunarathna et al. [
37].
In
Figure 6, the spatial distribution of the average available wave power around Sri Lanka (time averaged over 25-year period between 1979 and 2003 for the “present” climate and between 2075 and 2099 for the “future” climate) is shown. Equation (1) [
38] was used to determine the wave power.
in which
Hs (
) is the significant wave height determined from the wave spectrum.
Tm-10 is the energy period given by Pitt [
39].
in which
m−1 is the first negative spectral moment of the wave frequency spectrum.
Under the present climate, on average, 10–16 kW/m of wave power is available on the continental shelf (except at very nearshore areas) of the south and west coasts of Sri Lanka. In contrast, only 2–6 kW/m of wave power is available in the north and east (
Figure 6a). The average wave power under the future climate scenario (2075–2099) given in
Figure 6b shows an overall reduction of 2–4 kW/m of average power in the south and west in future. No noticeable change is seen in the north and east.
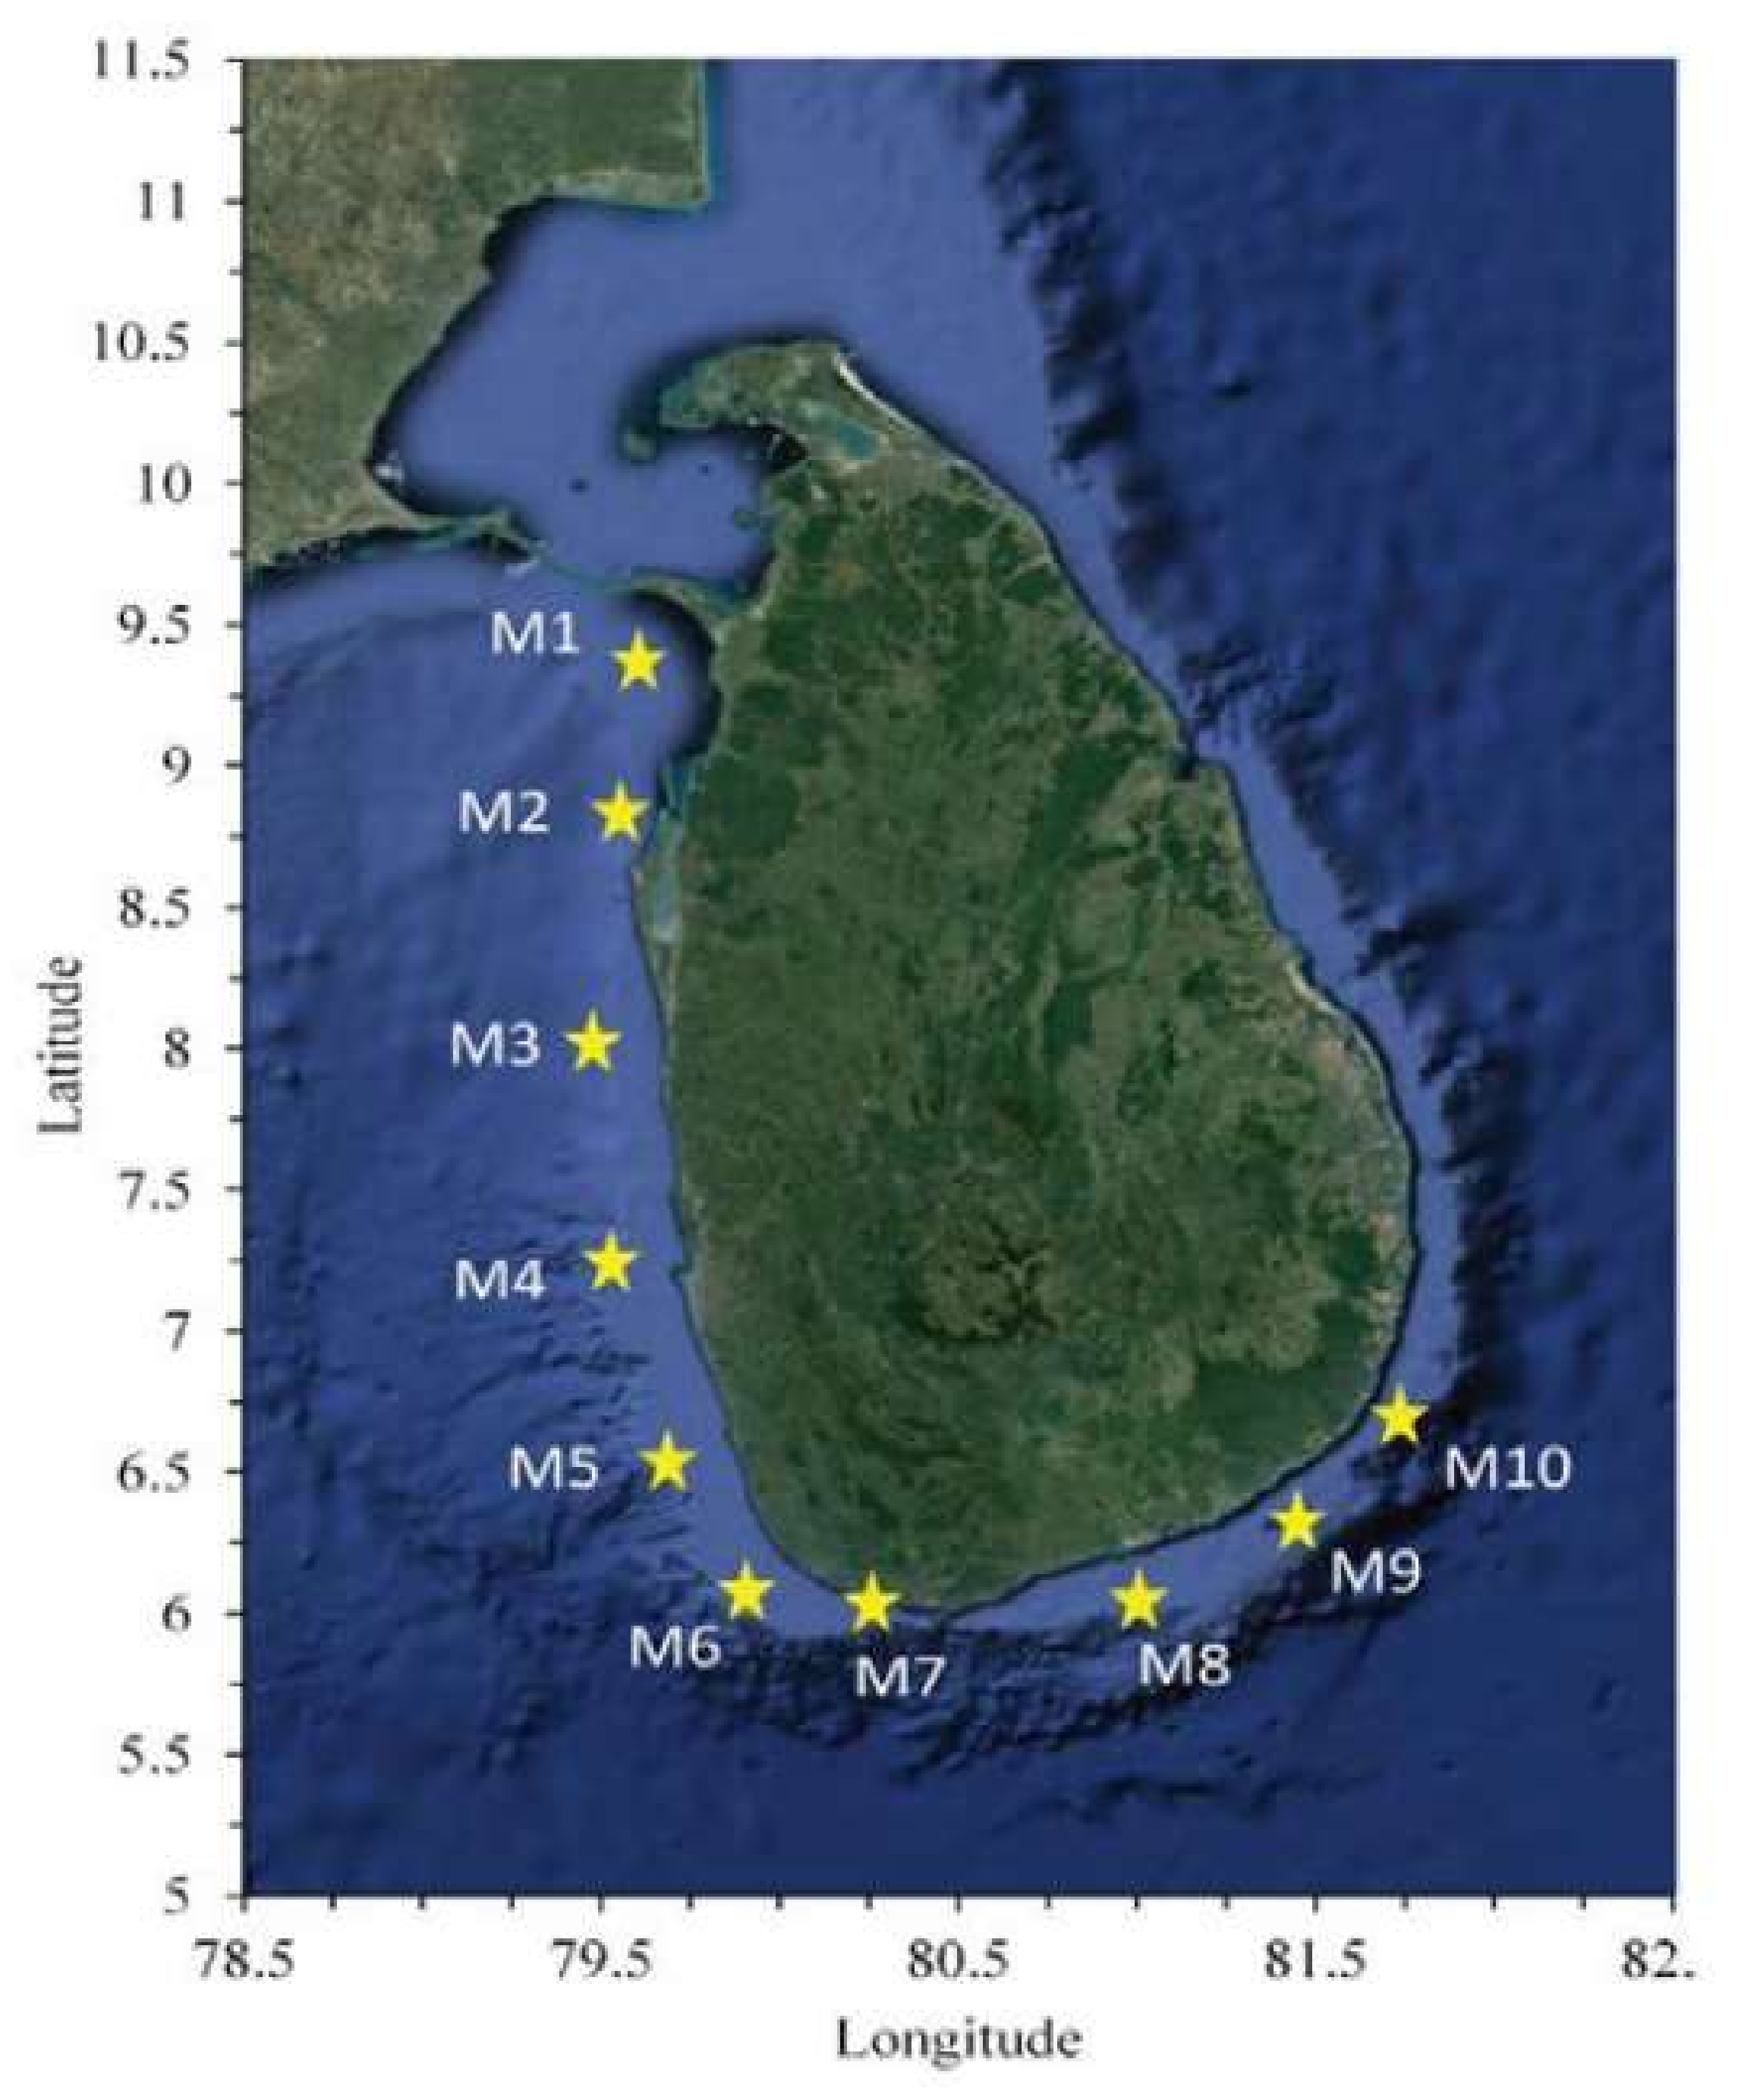
Since the north and east coasts of Sri Lanka have a very low wave power potential, we will focus on the south and west coasts herein where a substantial amount of wave power is available. To investigate the spatial distribution of available wave power in the south and west in greater detail, ten locations, M1 to M10, along the western and southern continental shelf margin of Sri Lanka were selected for further analysis (
Table 2,
Figure 7). The selected points are located close to the continental shelf margin and collectively cover the coast from north-west to south-east. “Present” and “future” time series of 25-year wave simulations at those ten points were used for the following analysis.
The annual average wave power at M1 to M10 during the “present” and “future” 25-year simulation periods is compared in
Figure 8. Averaging was done using all wave data during the simulation period. The difference between the present and future annual average wave power is also given. According to
Figure 8, M6 has the highest annual average wave power while M1 has the lowest. The low values at M1 to M3 can be attributed to the sheltered nature of the north-west coast of Sri Lanka from the southern swell approach and the locally generated south-westerly wind waves. Some inter-annual variability is observed at all locations, both at present and in future. The highest annual variability under both present (23%) and future (24%) climates and the highest average reduction of power in future (8%) are observed at M6. The “future” annual average wave power is smaller than that of the “present” at all locations except at M1, M2, and M3.
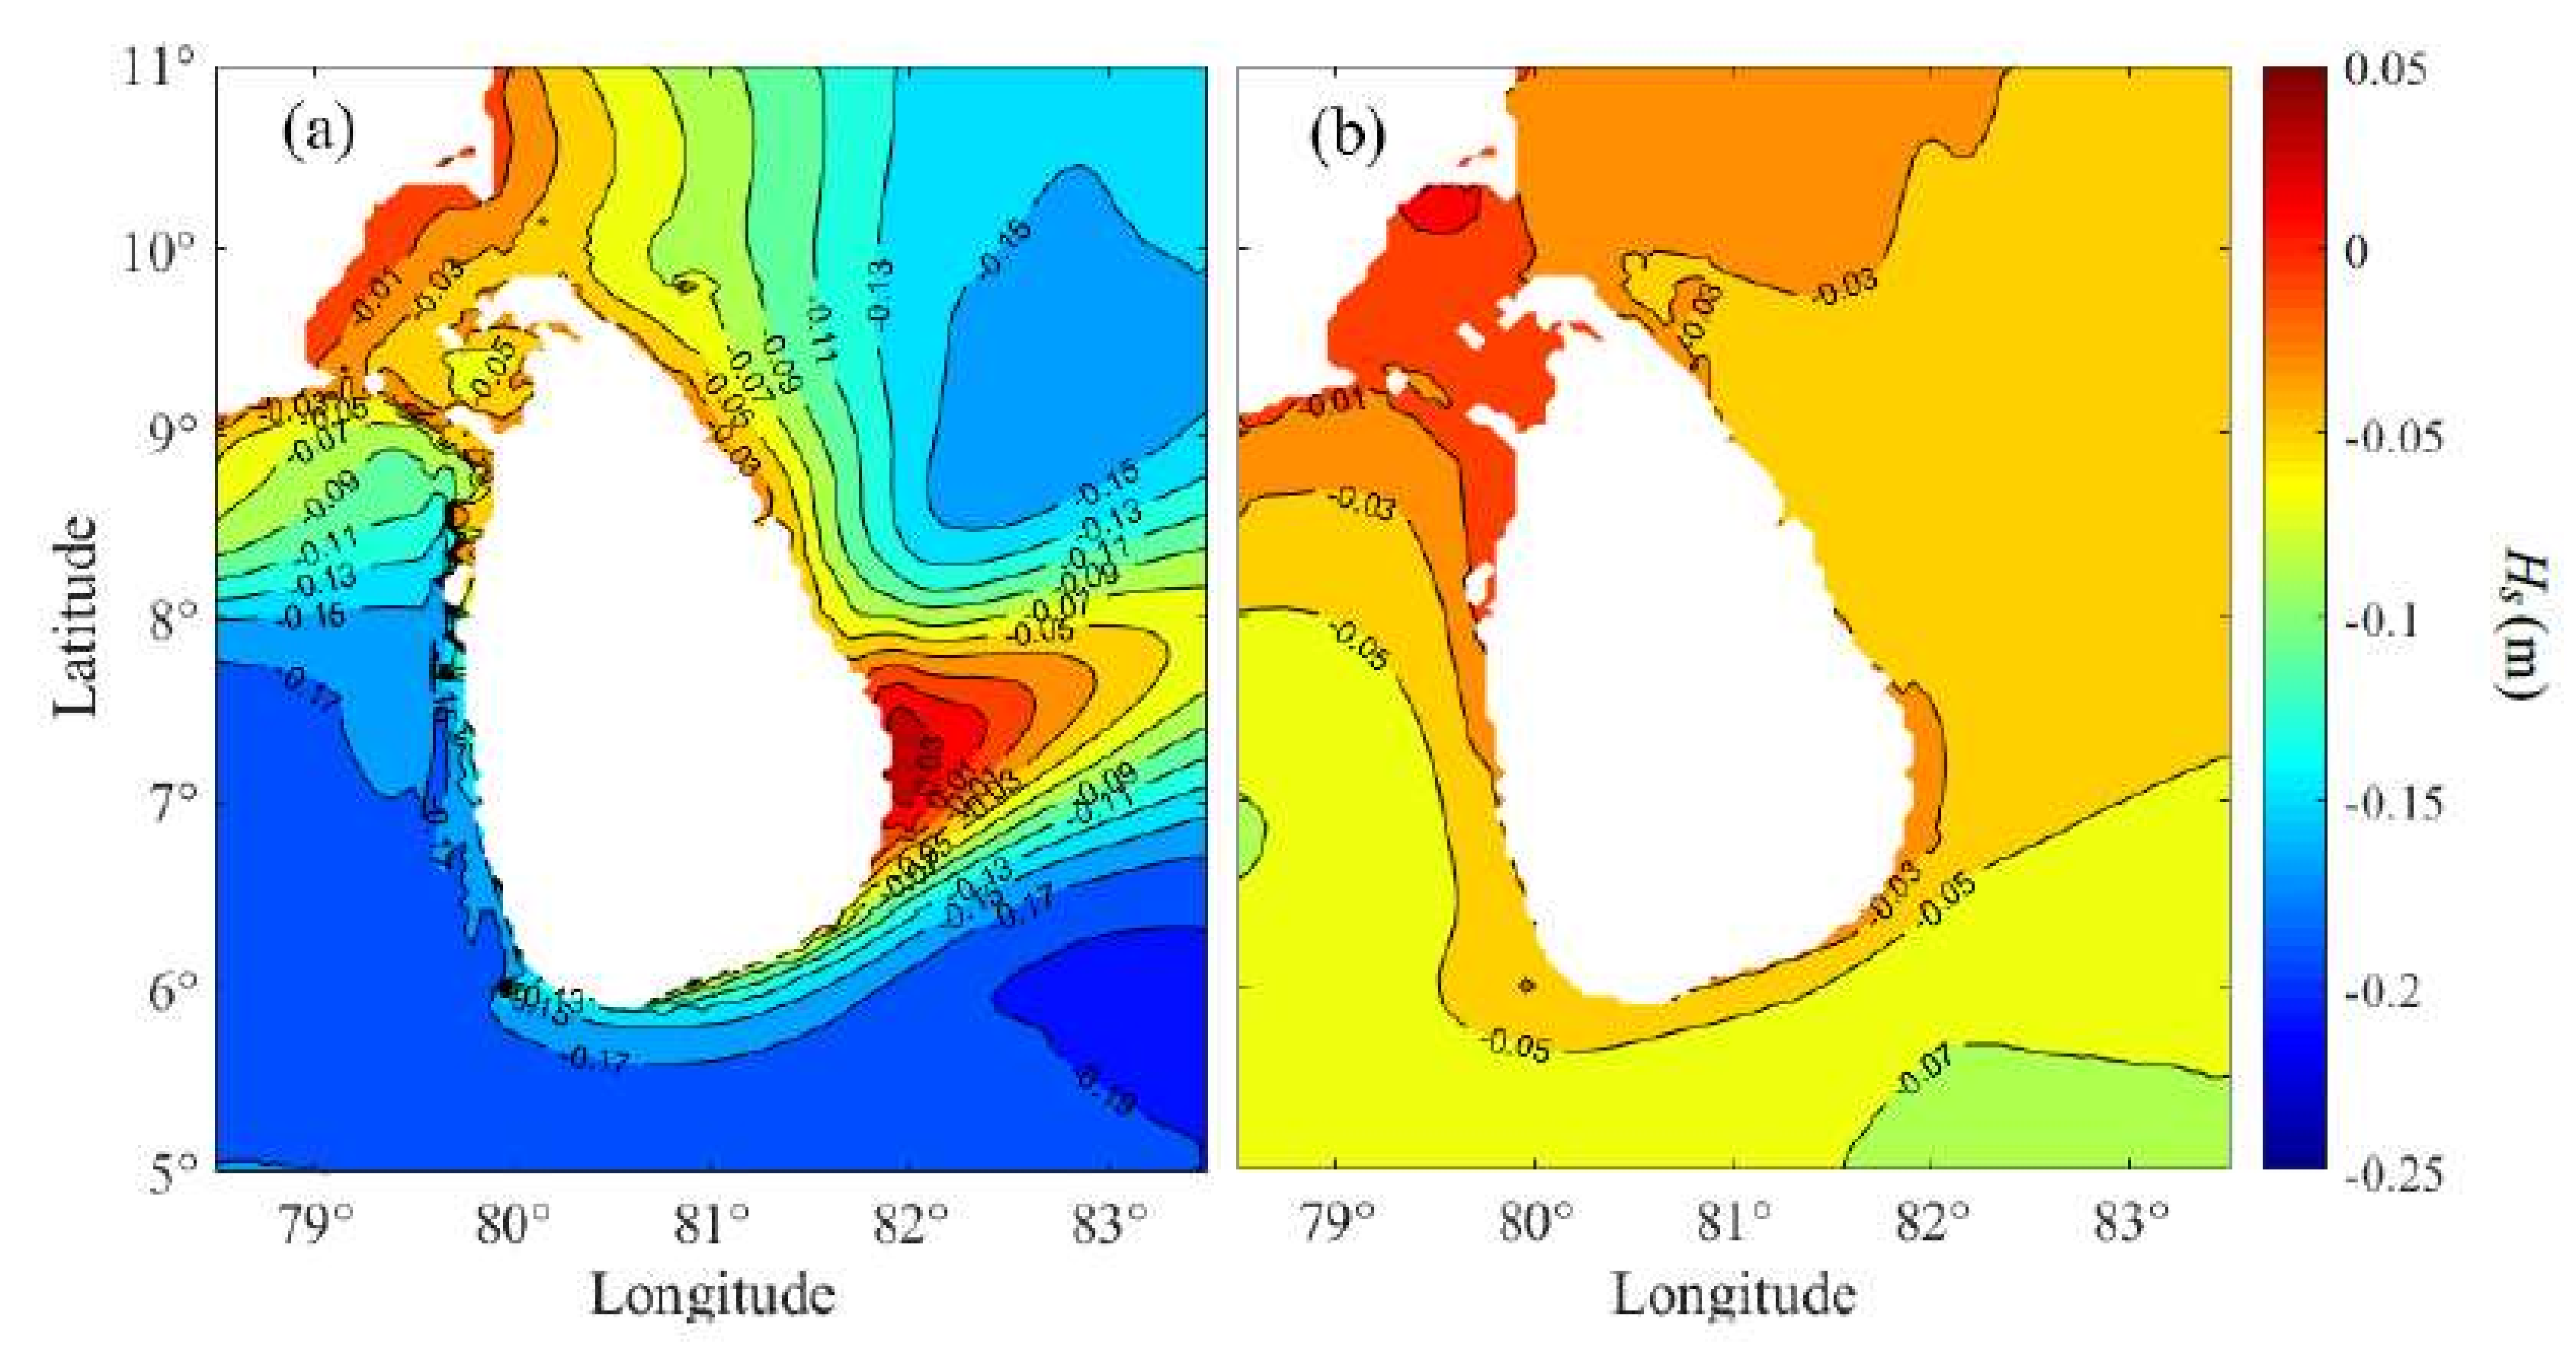
Future reduction of the available wave power around Sri Lanka can be a result of either the change in swell conditions of the Southern Indian Ocean or potential changes to the south-west tropical monsoon because of global climate change. In
Figure 9a, the difference between future and present average wave height during monsoon months (May–September, averaged over the 25-year period) is shown. The highest change is observed in the south-west as expected, where the average wave height on the continental shelf during the monsoon has reduced by around 0.12m on average in future. A similar figure for the non-monsoon period (October-April) is given in
Figure 9b. The reduction of the average wave height during this period is less than 0.04m. No notable changes to average
Tm-10 can be seen (not shown).
According to the results shown in
Figure 9, future reduction on average wave power around Sri Lanka may be attributed primarily to weakening of wind wave conditions during the tropical south-west monsoon. However, further evidence is needed to confirm this observation.
In
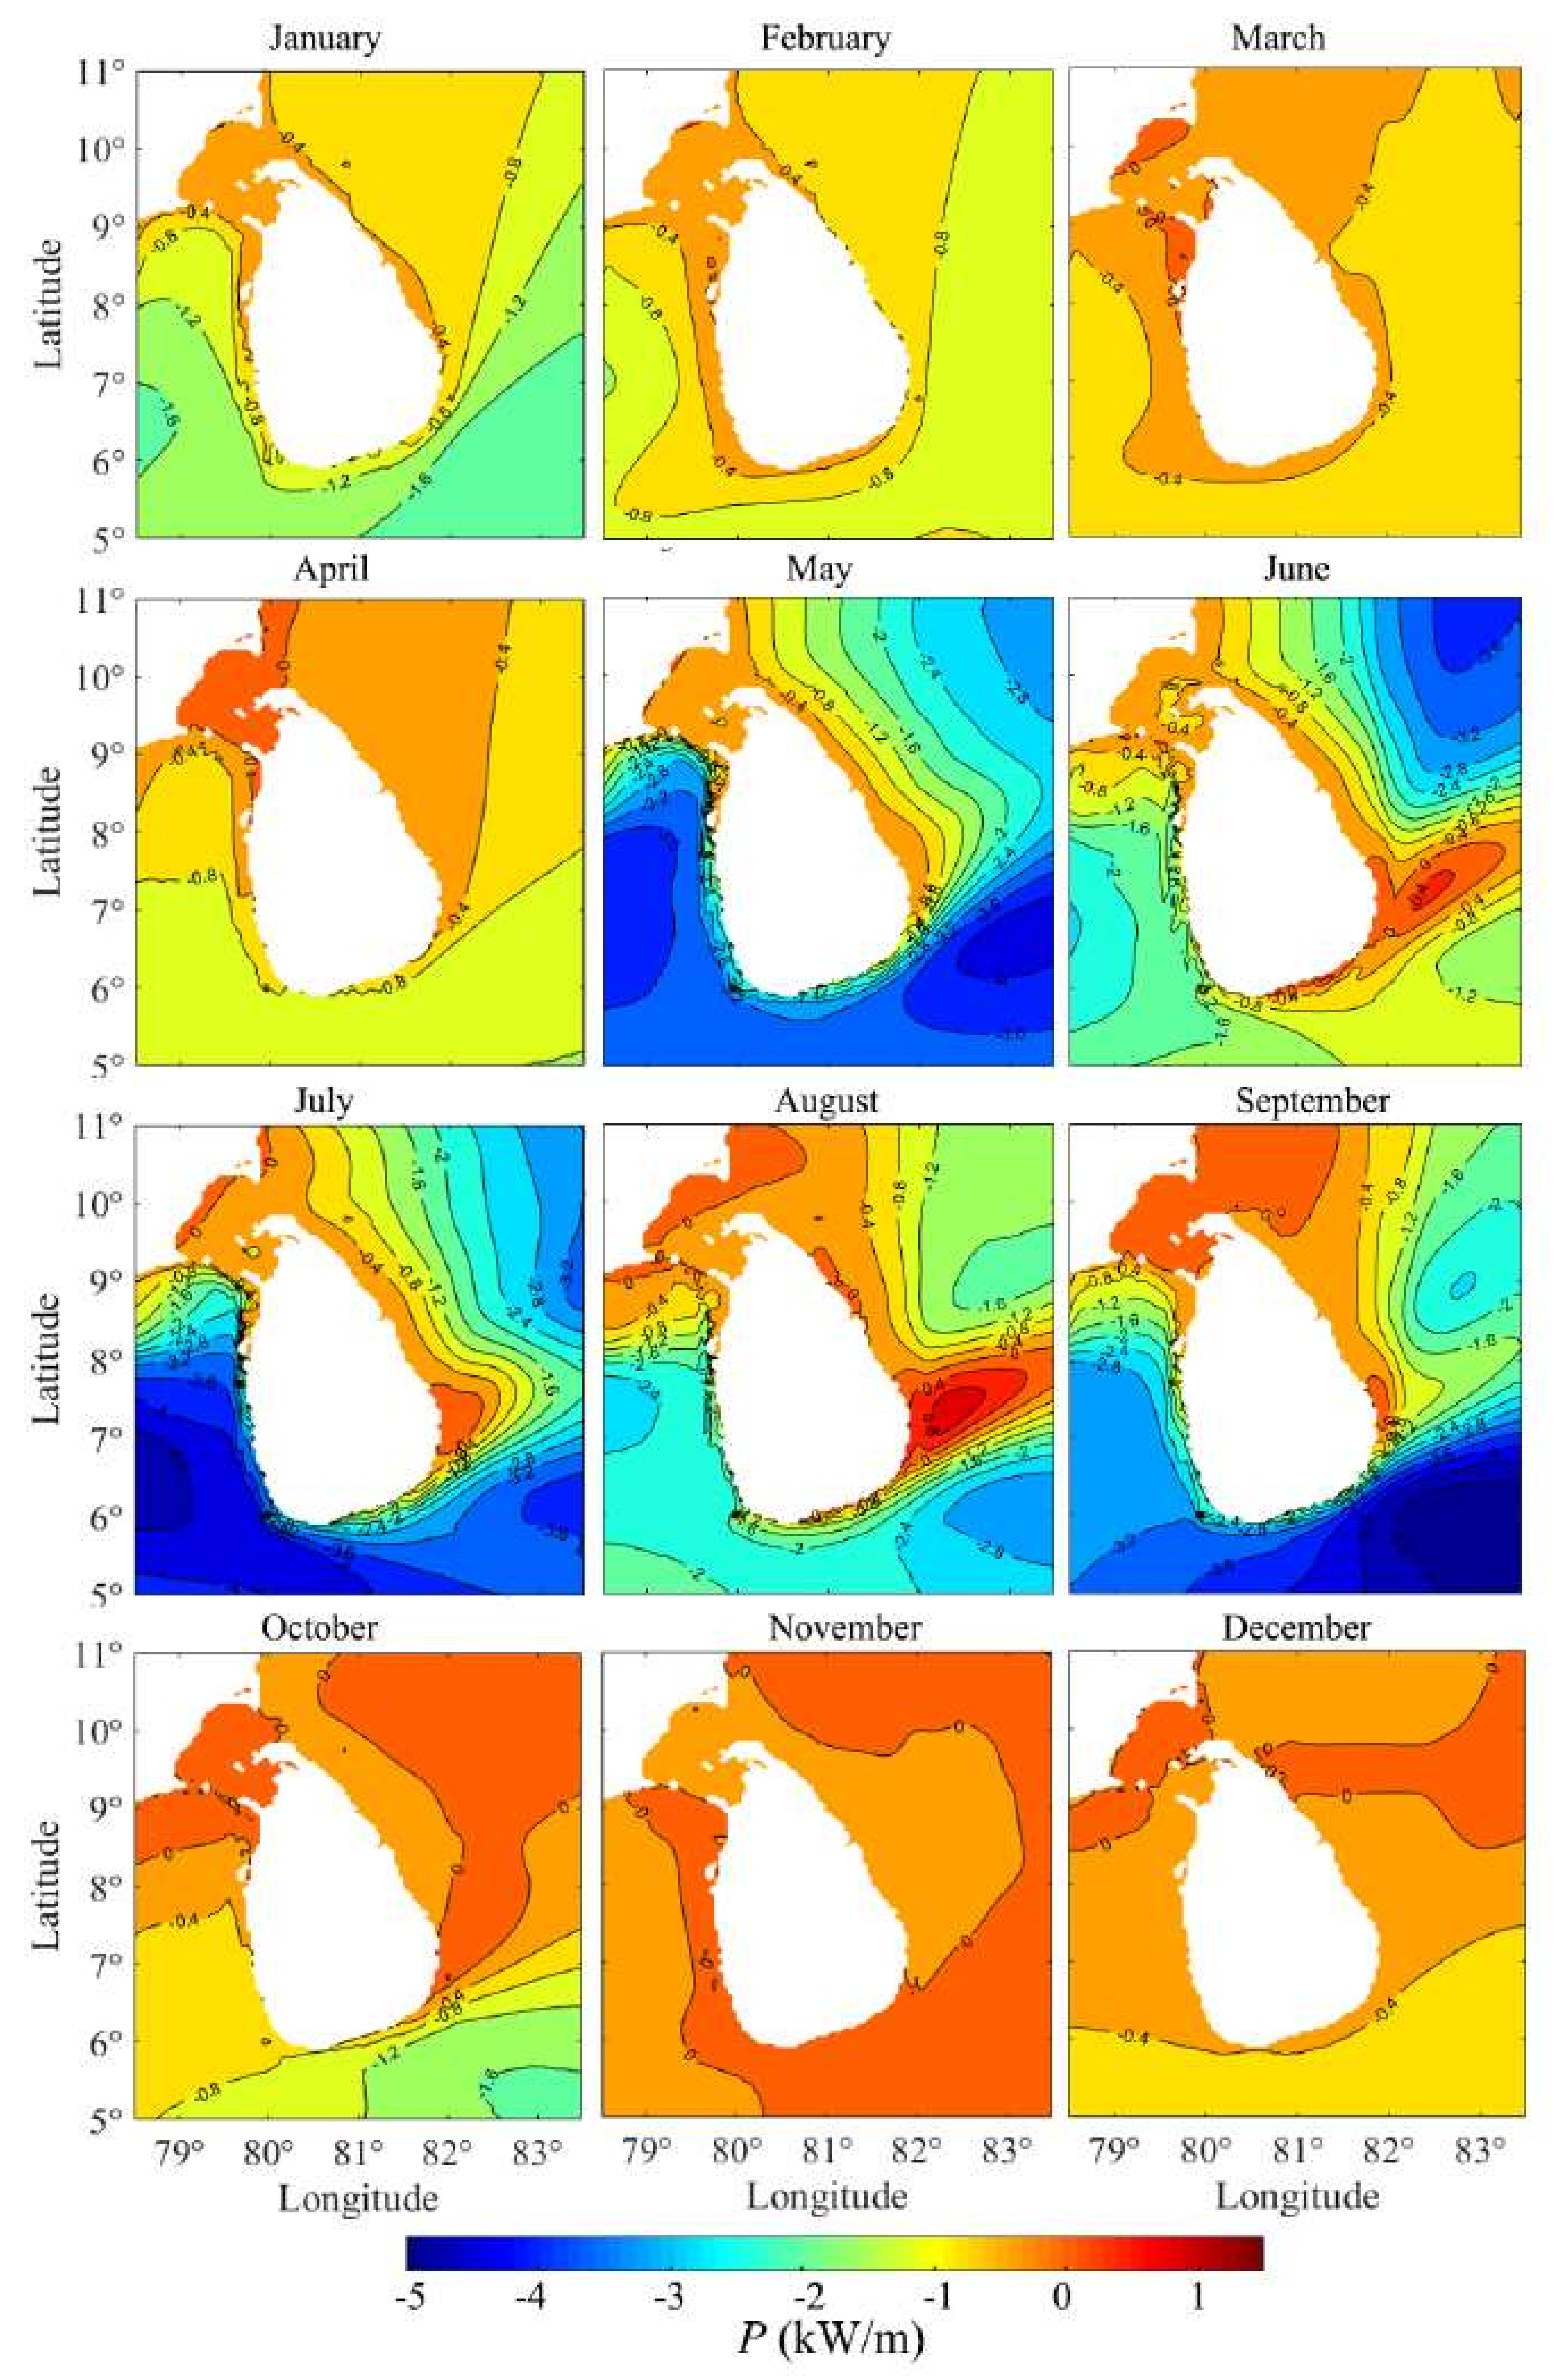
Figure 10, the difference between “future” and “present” monthly averaged wave power, averaged over the 25-year simulation periods, is shown. During the period outside the tropical south-west monsoon from October to April, the future reduction of monthly average wave power along the west and south coasts is fairly uniform and is less than 0.8 kW/m at any given location. On the other hand, monthly average wave power during the south-west tropical monsoon (May–September) is reduced by a maximum of 3.2 kW/m in future although this reduction is significantly space-dependent. The largest reduction is seen along the south-west and south-east coasts.
Figure 9;
Figure 10 reveal that according to the model simulations, the future reduction of wave power can be primarily attributed to the change in the south-west tropical monsoon generated wave heights as a result of global climate change.
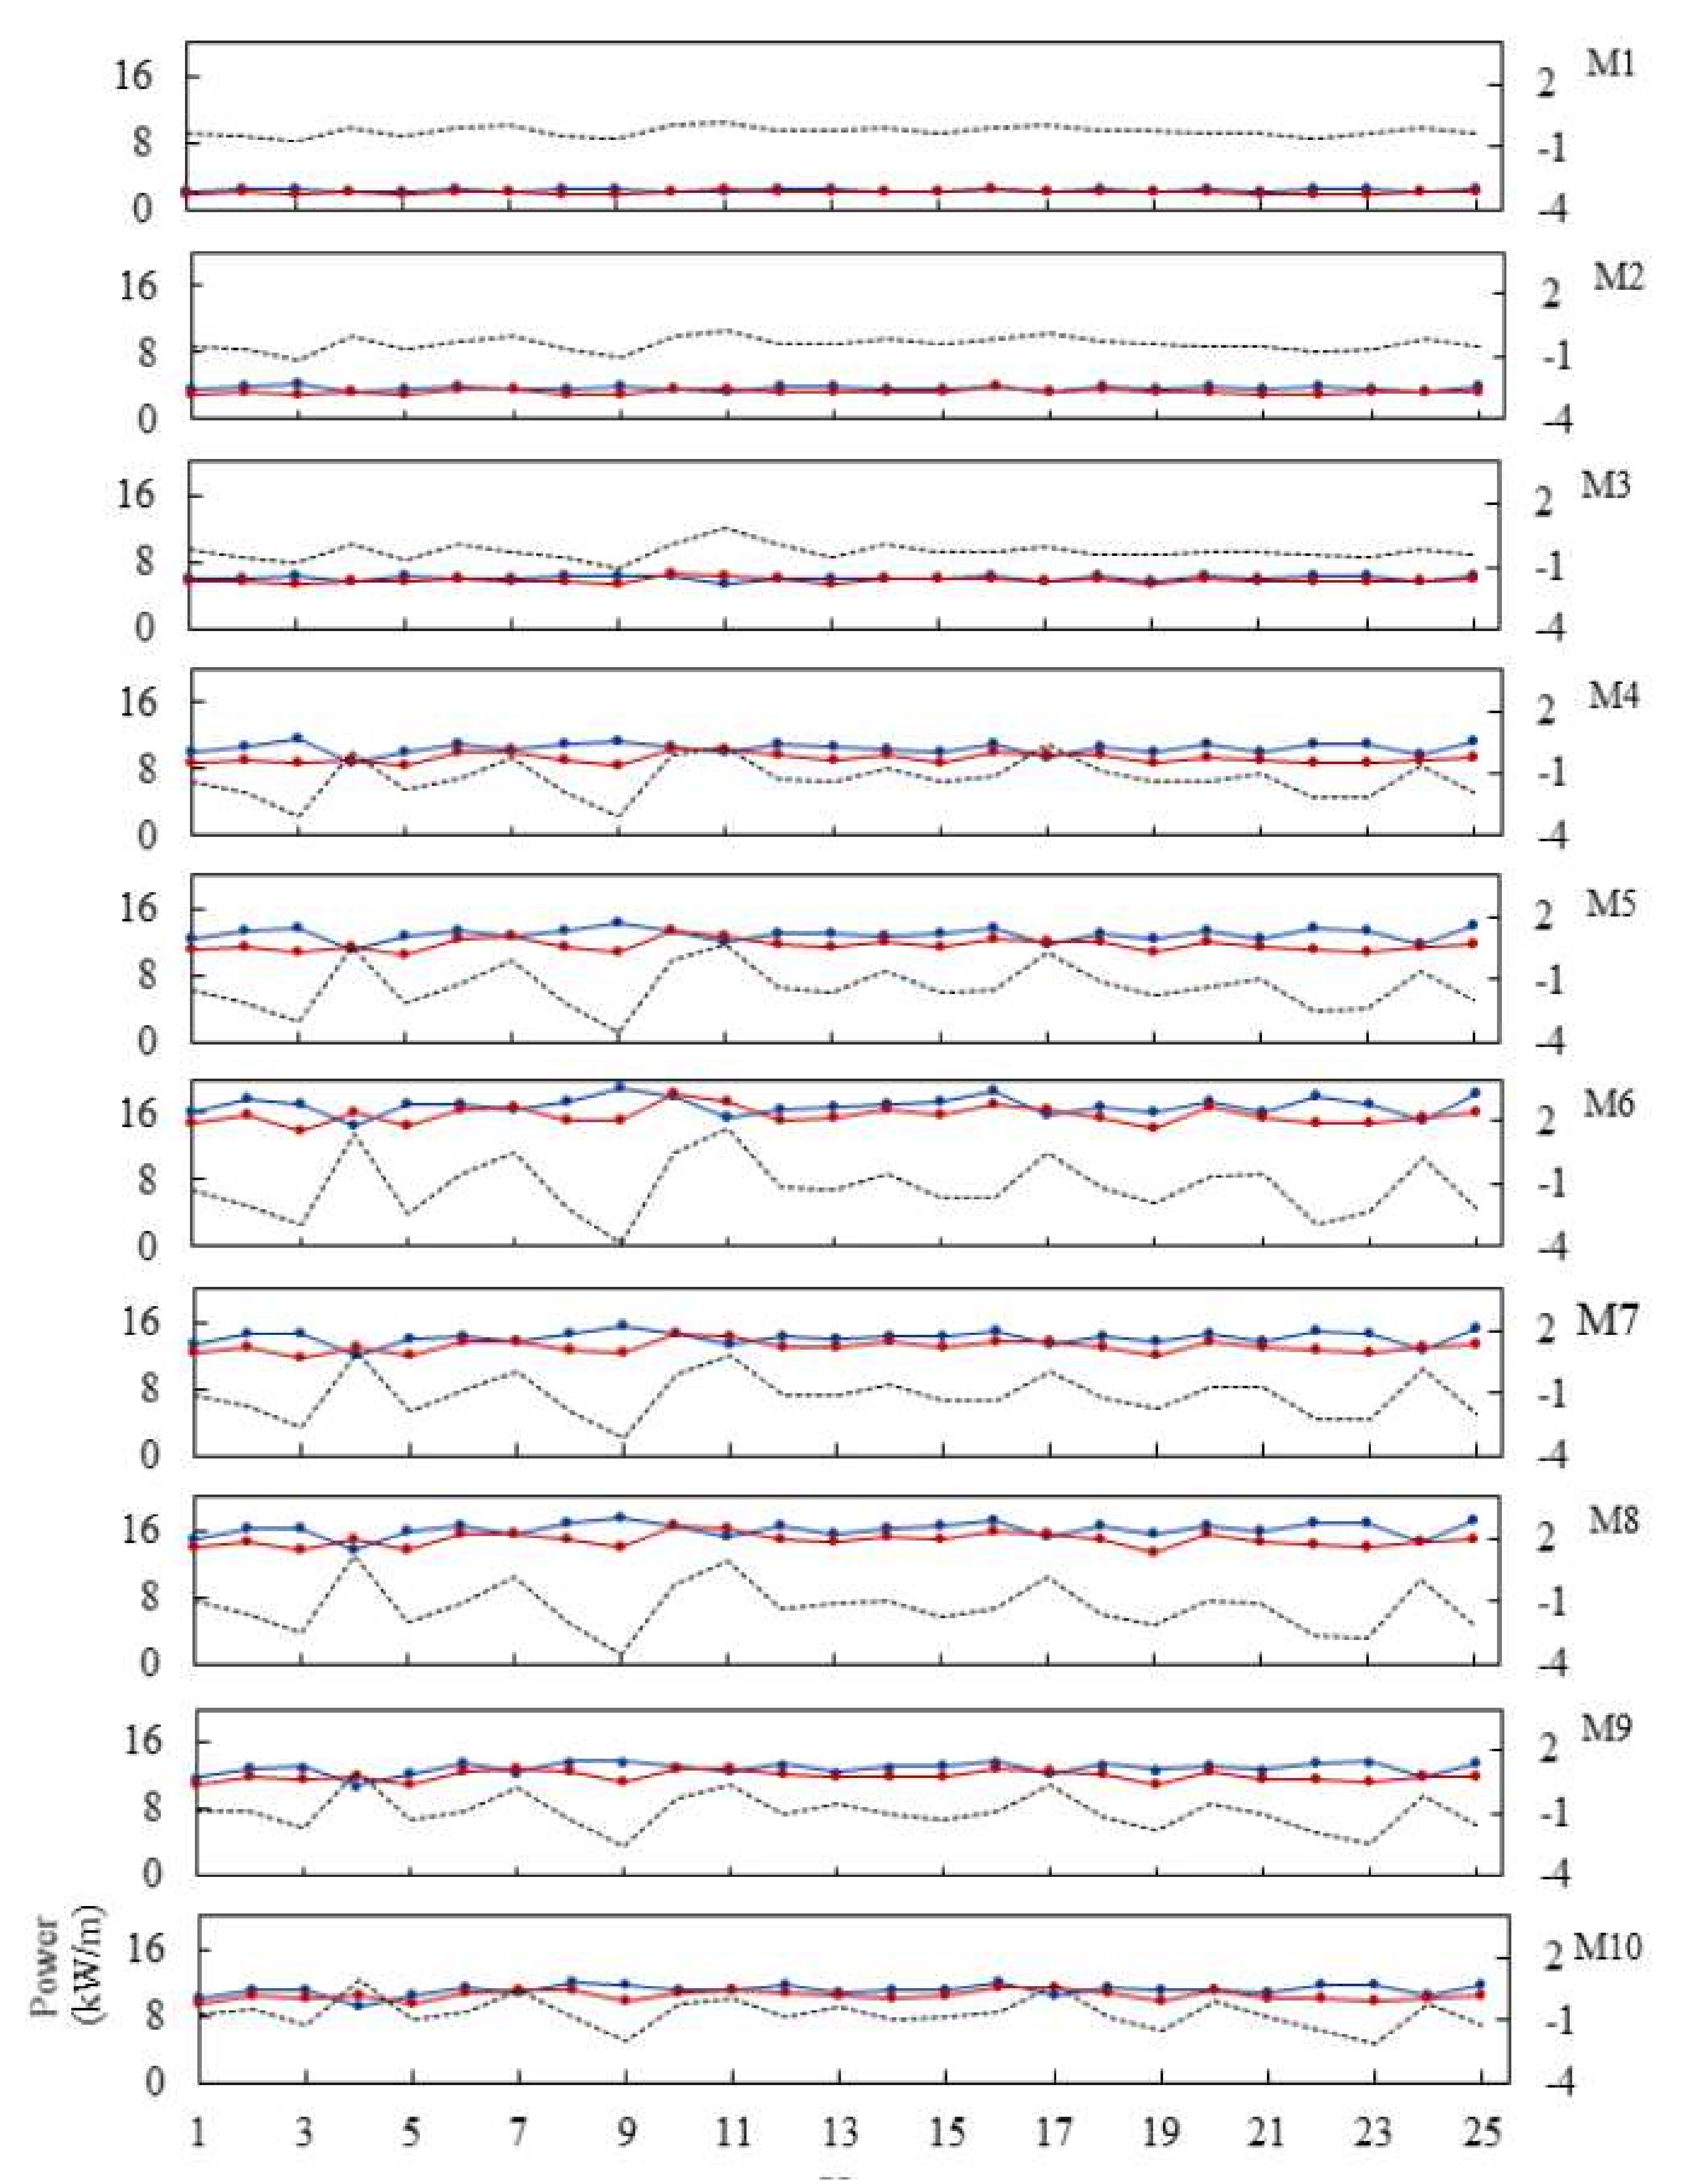
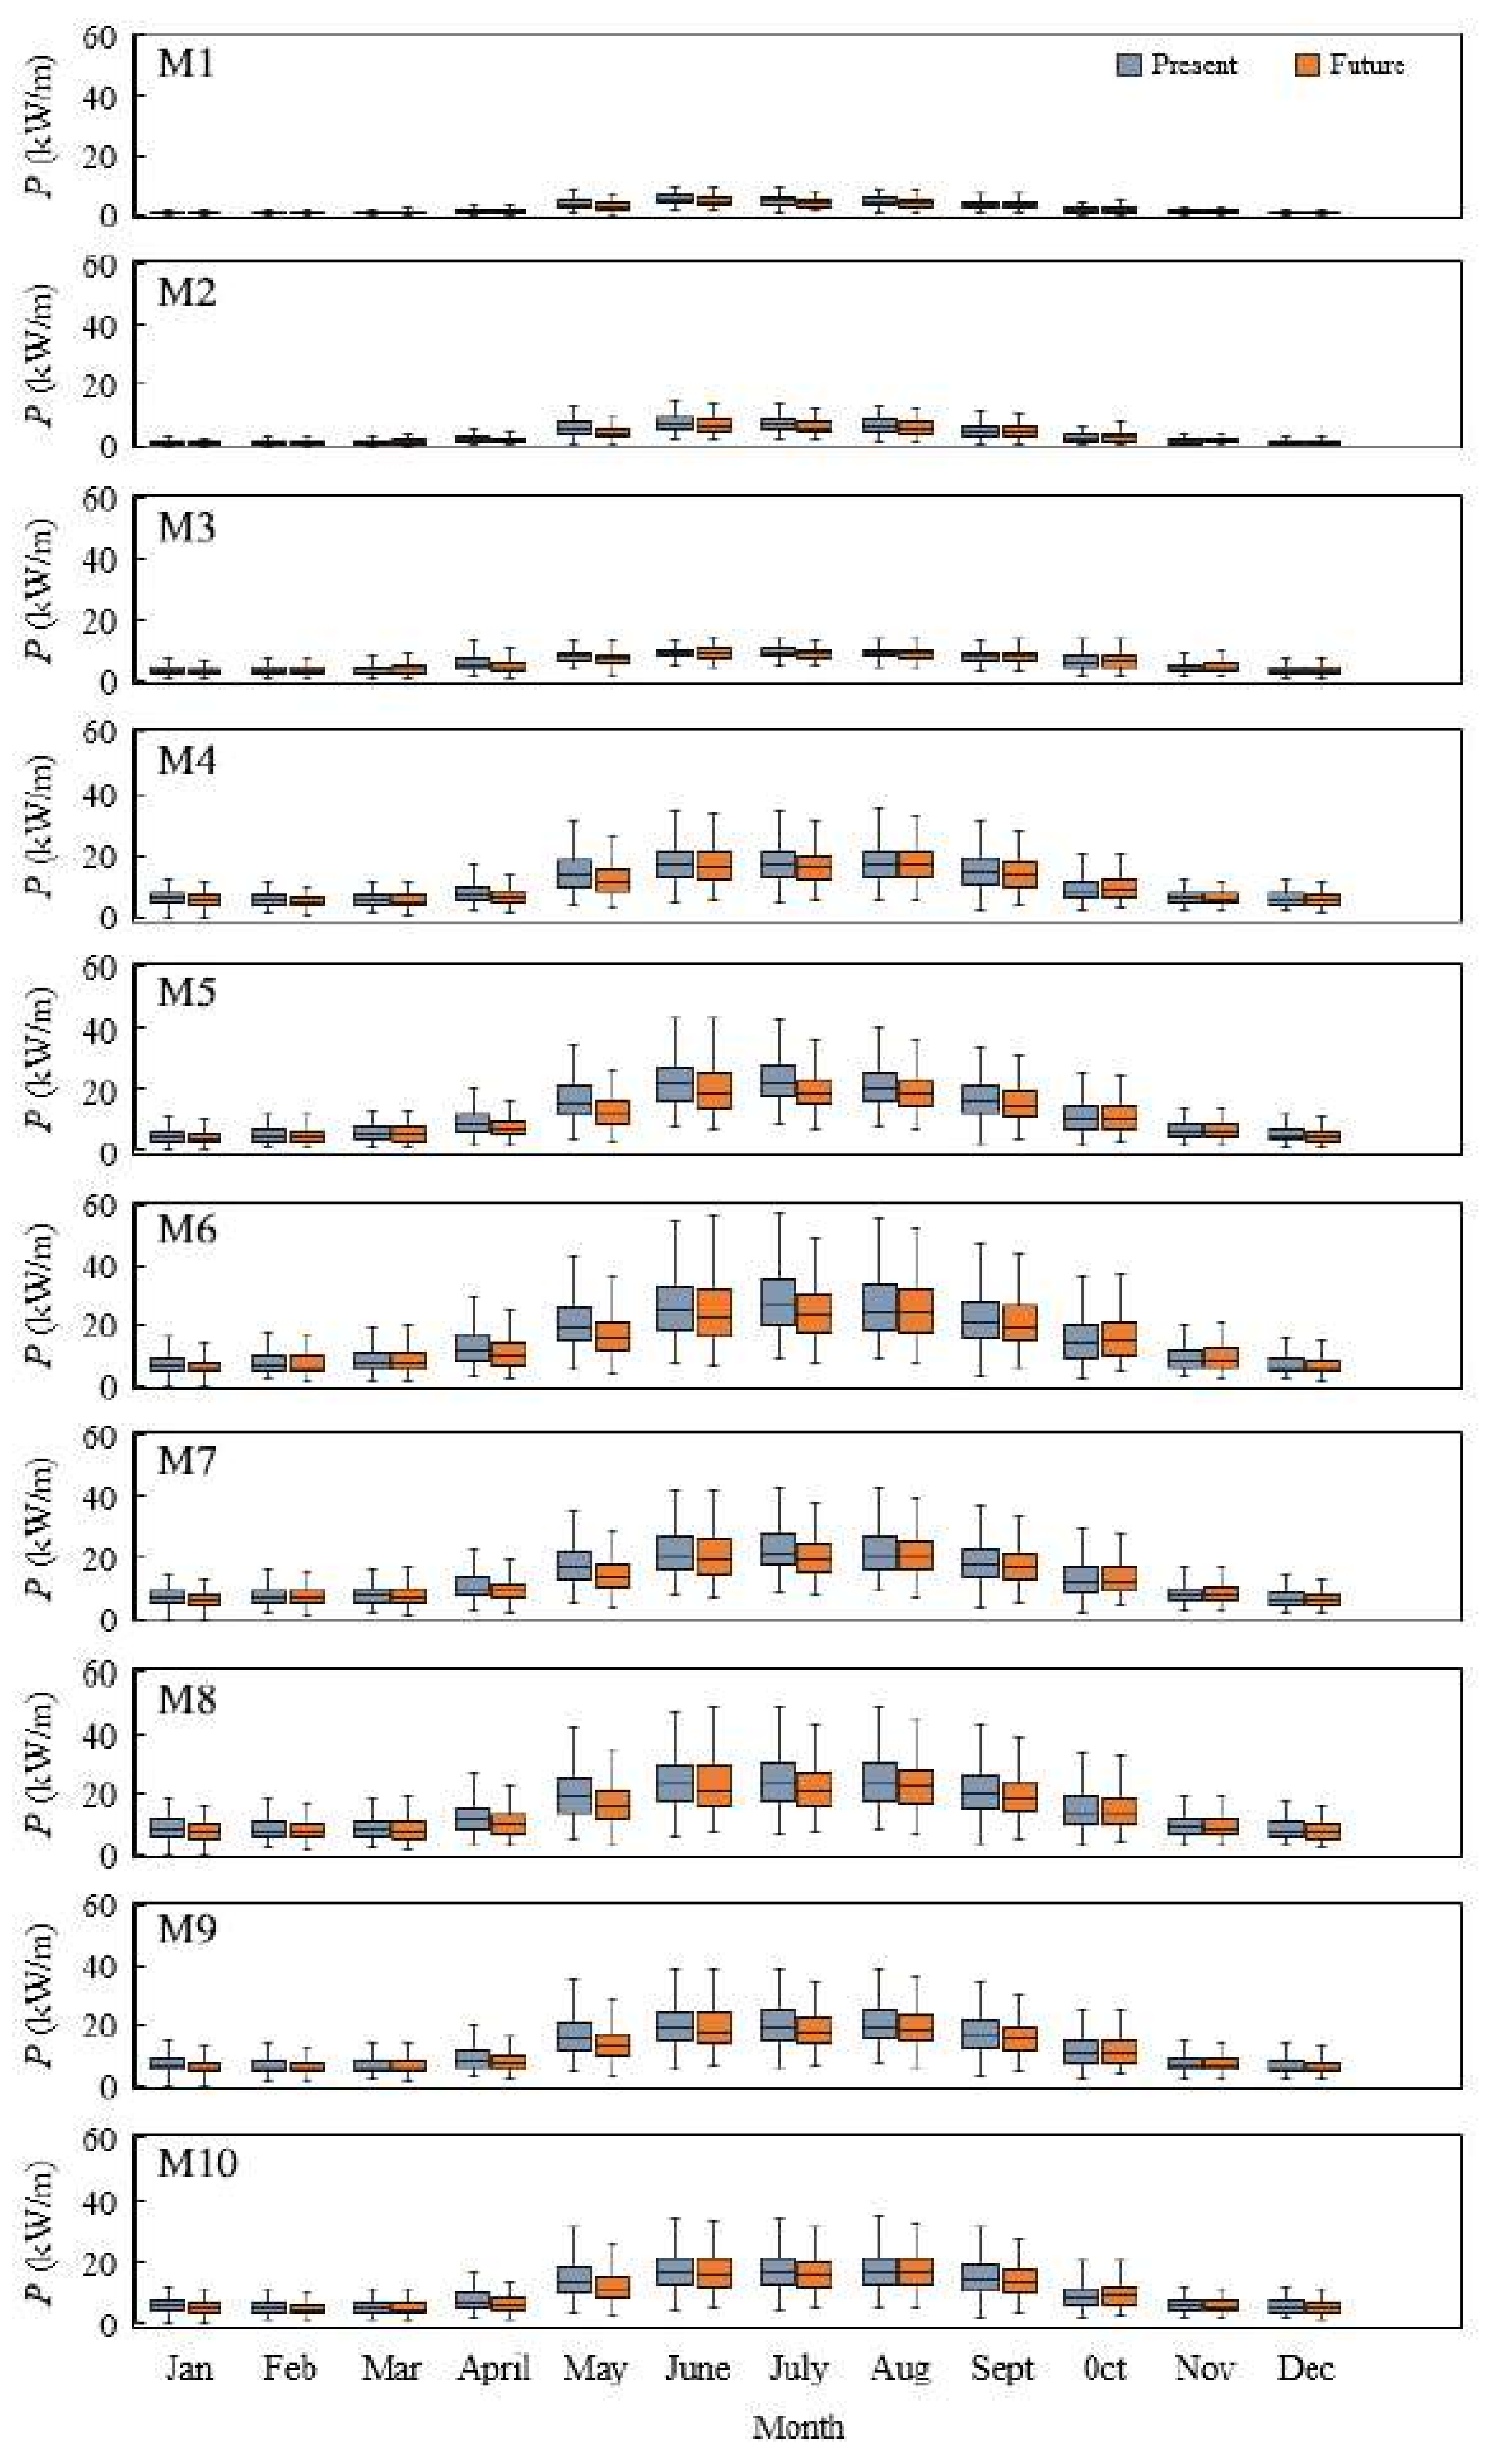
Although future reduction of the average available wave power and the contribution from the future changes to the south-west monsoon is apparent from the above analysis, intricate details of power variability is essential for planning and development of ocean wave energy-harvesting projects. Box-whisker plots given in
Figure 11 summarize the monthly variation of “present” and “future” wave power at locations M1–M10.
These plots illustrate present and future monthly median, 1st and the 3rd quartiles and the range of variability of wave power both present and future. The maximum available wave power spatially varies between 5 and 30 kW/m, lowest values being at M1 (north-west) and the highest at M6 (south-west). The south-west and south of Sri Lanka from Galle to Hambantota (points M4–M8) not only have the largest available wave power but also the largest monthly variation and the highest interquartile ranges, indicating the effect of the tropical south-west monsoon on the available wave power. Areas north of Negombo (
Figure 1) (locations M1 to M3) has the lowest available wave power, the lowest monthly variation and the lowest interquartile range. In the areas east of Hambantota (M9 and M10), some seasonal variation can be seen however, the impact of the south-west monsoon is lesser than that in the south-west.
Figure 11 also shows that the median wave power will be smaller in future at all locations other than M1 to M3.
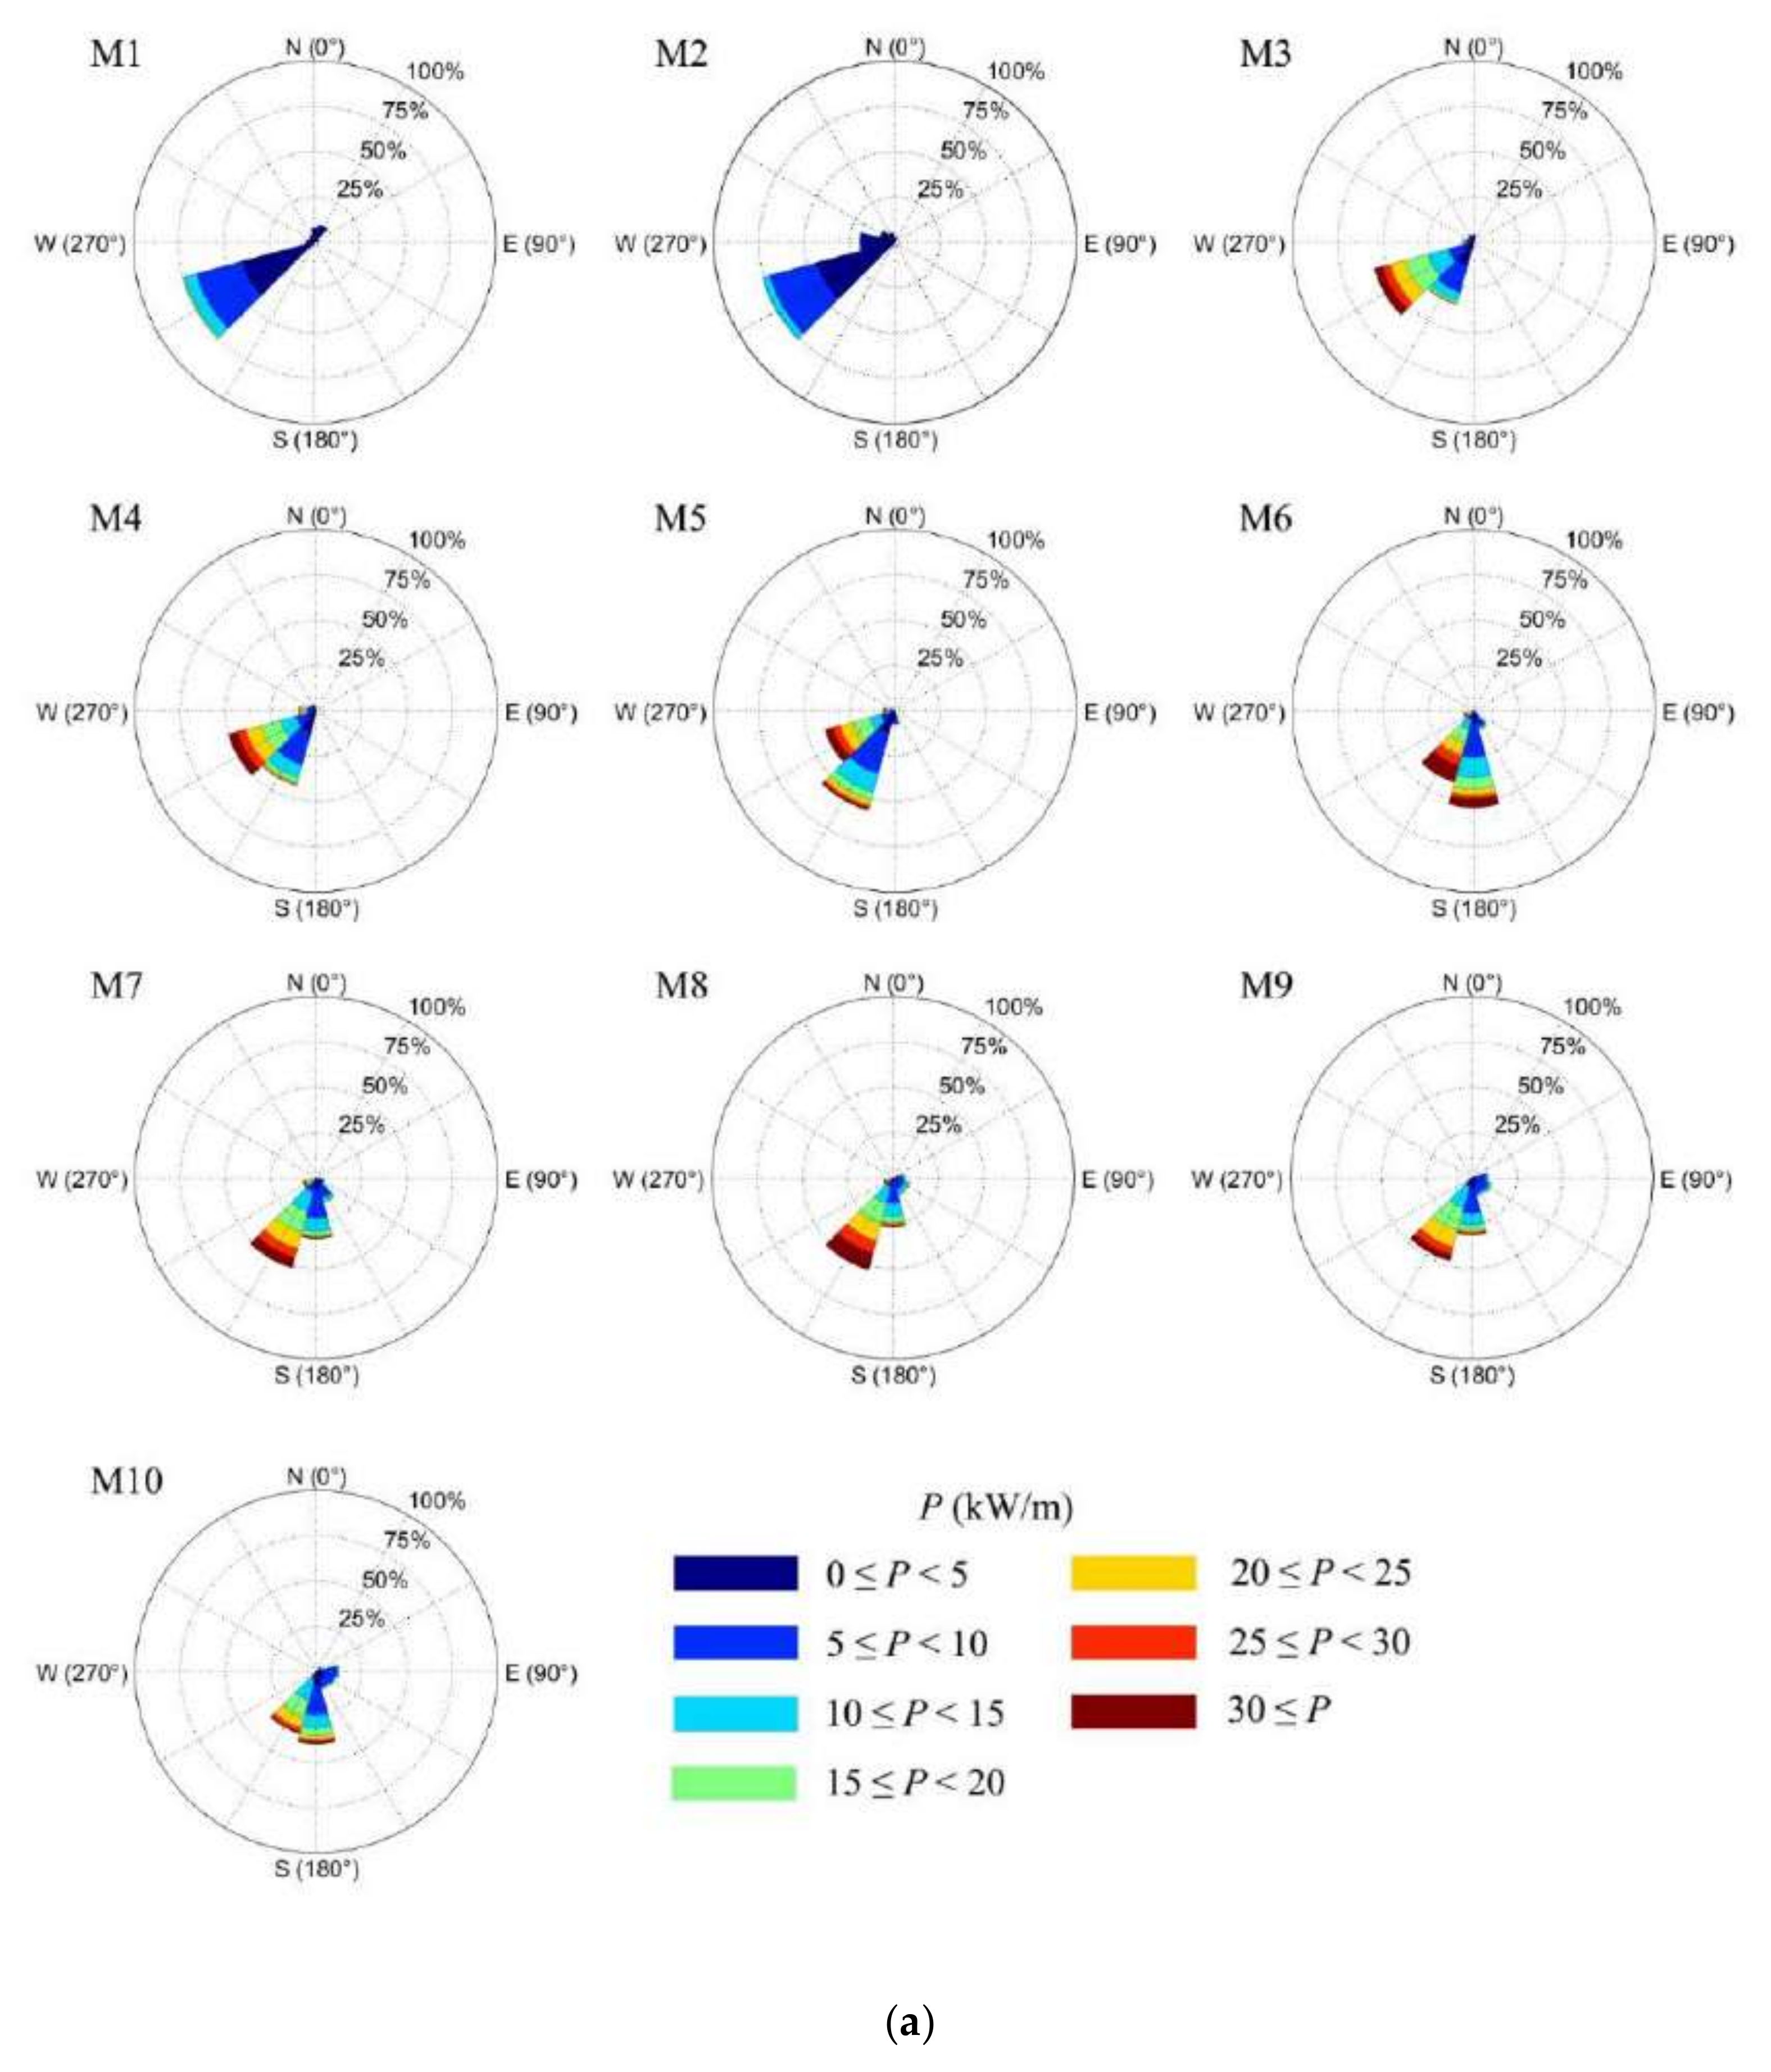
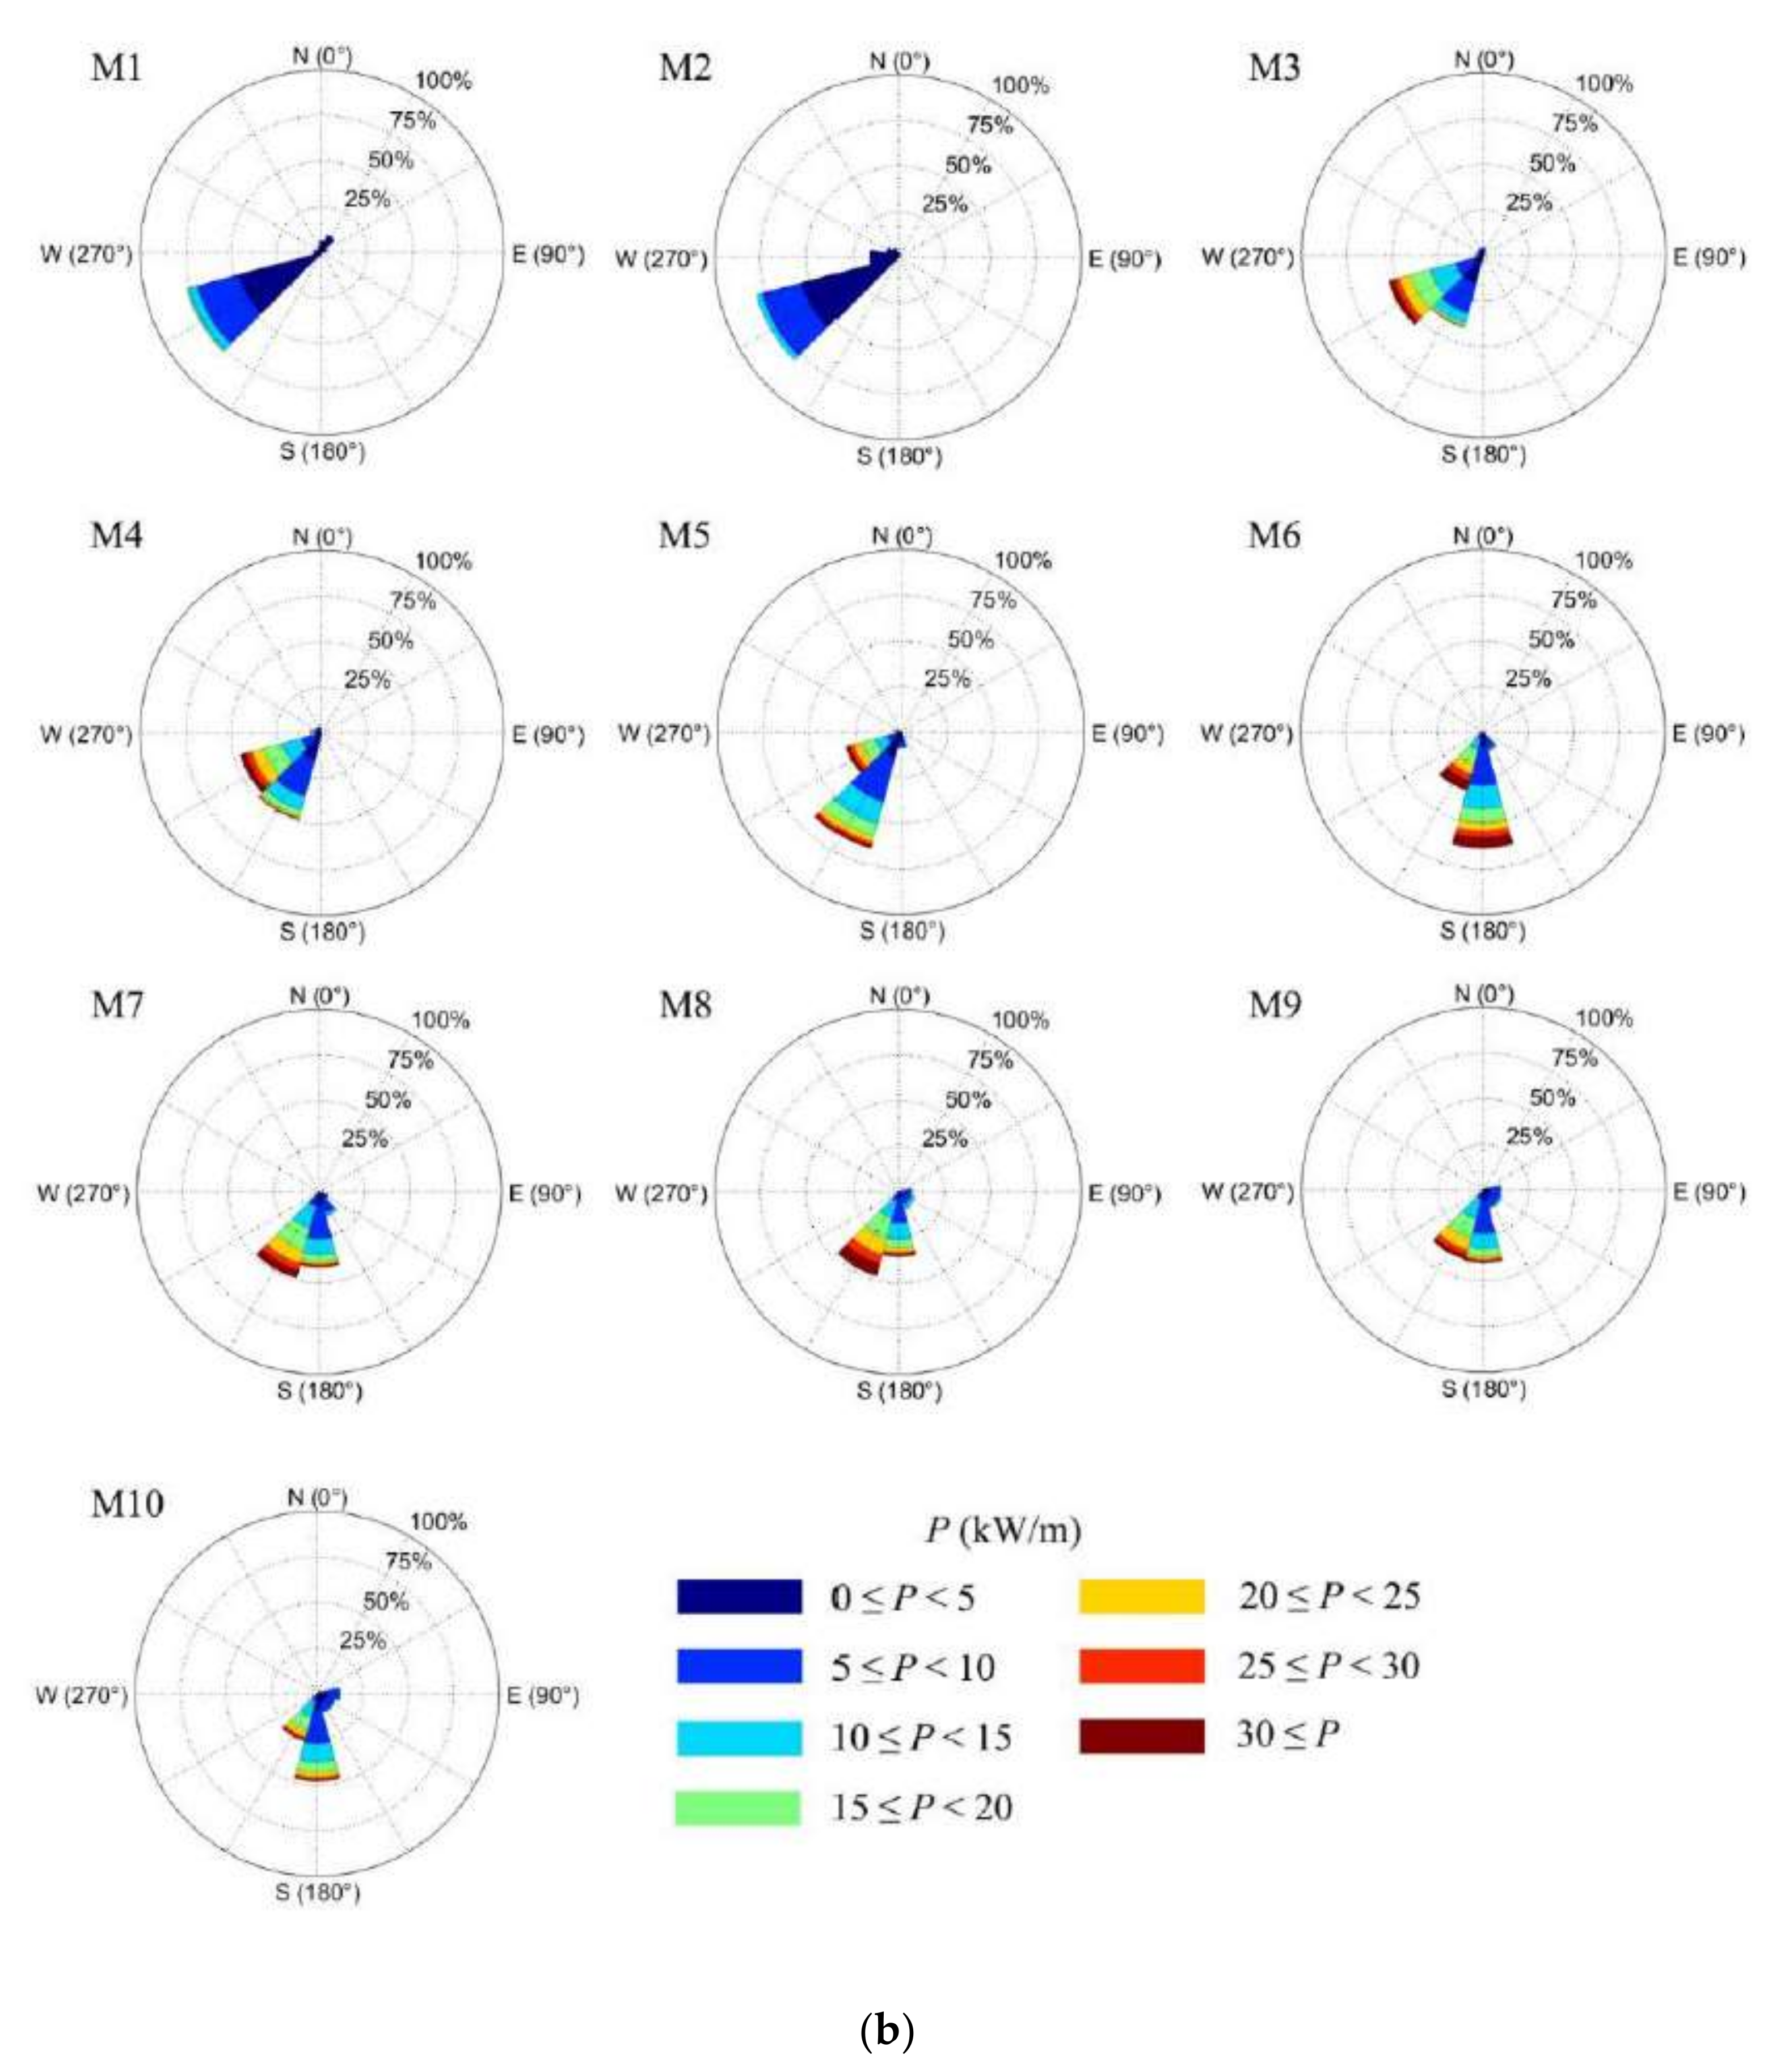
Incident wave approach direction, as well as the power availability, is a defining variable for the selection of suitable wave power devices and planning and development of wave energy projects. Wave power roses at M1 to M10, given in
Figure 12a,b, show the directional spread of available power percentages for “present” and “future” time slices, respectively. The predominant direction is south-west at all locations while a significant proportion of power is available from the south from M6 to M9. No notable change in predominant direction is observed in future except in M9 and M10 where some shift of power from the south to the south-west can be seen.
5. Future Stability of the Wave Power Resource
The spatio-temporal variability of the available wave power around Sri Lanka and the implications of global climate change are discussed in
Section 4. The results reveal that the wave power resource around Sri Lanka emanates from both wind and swell waves and that the available power from the locally generated wind wave component may change in future. The wave power corresponding to wind waves can be unpredictable and less stable while power available from the swell waves are predictable and stable. As a result, the most desirable power capture may be from the swell waves.
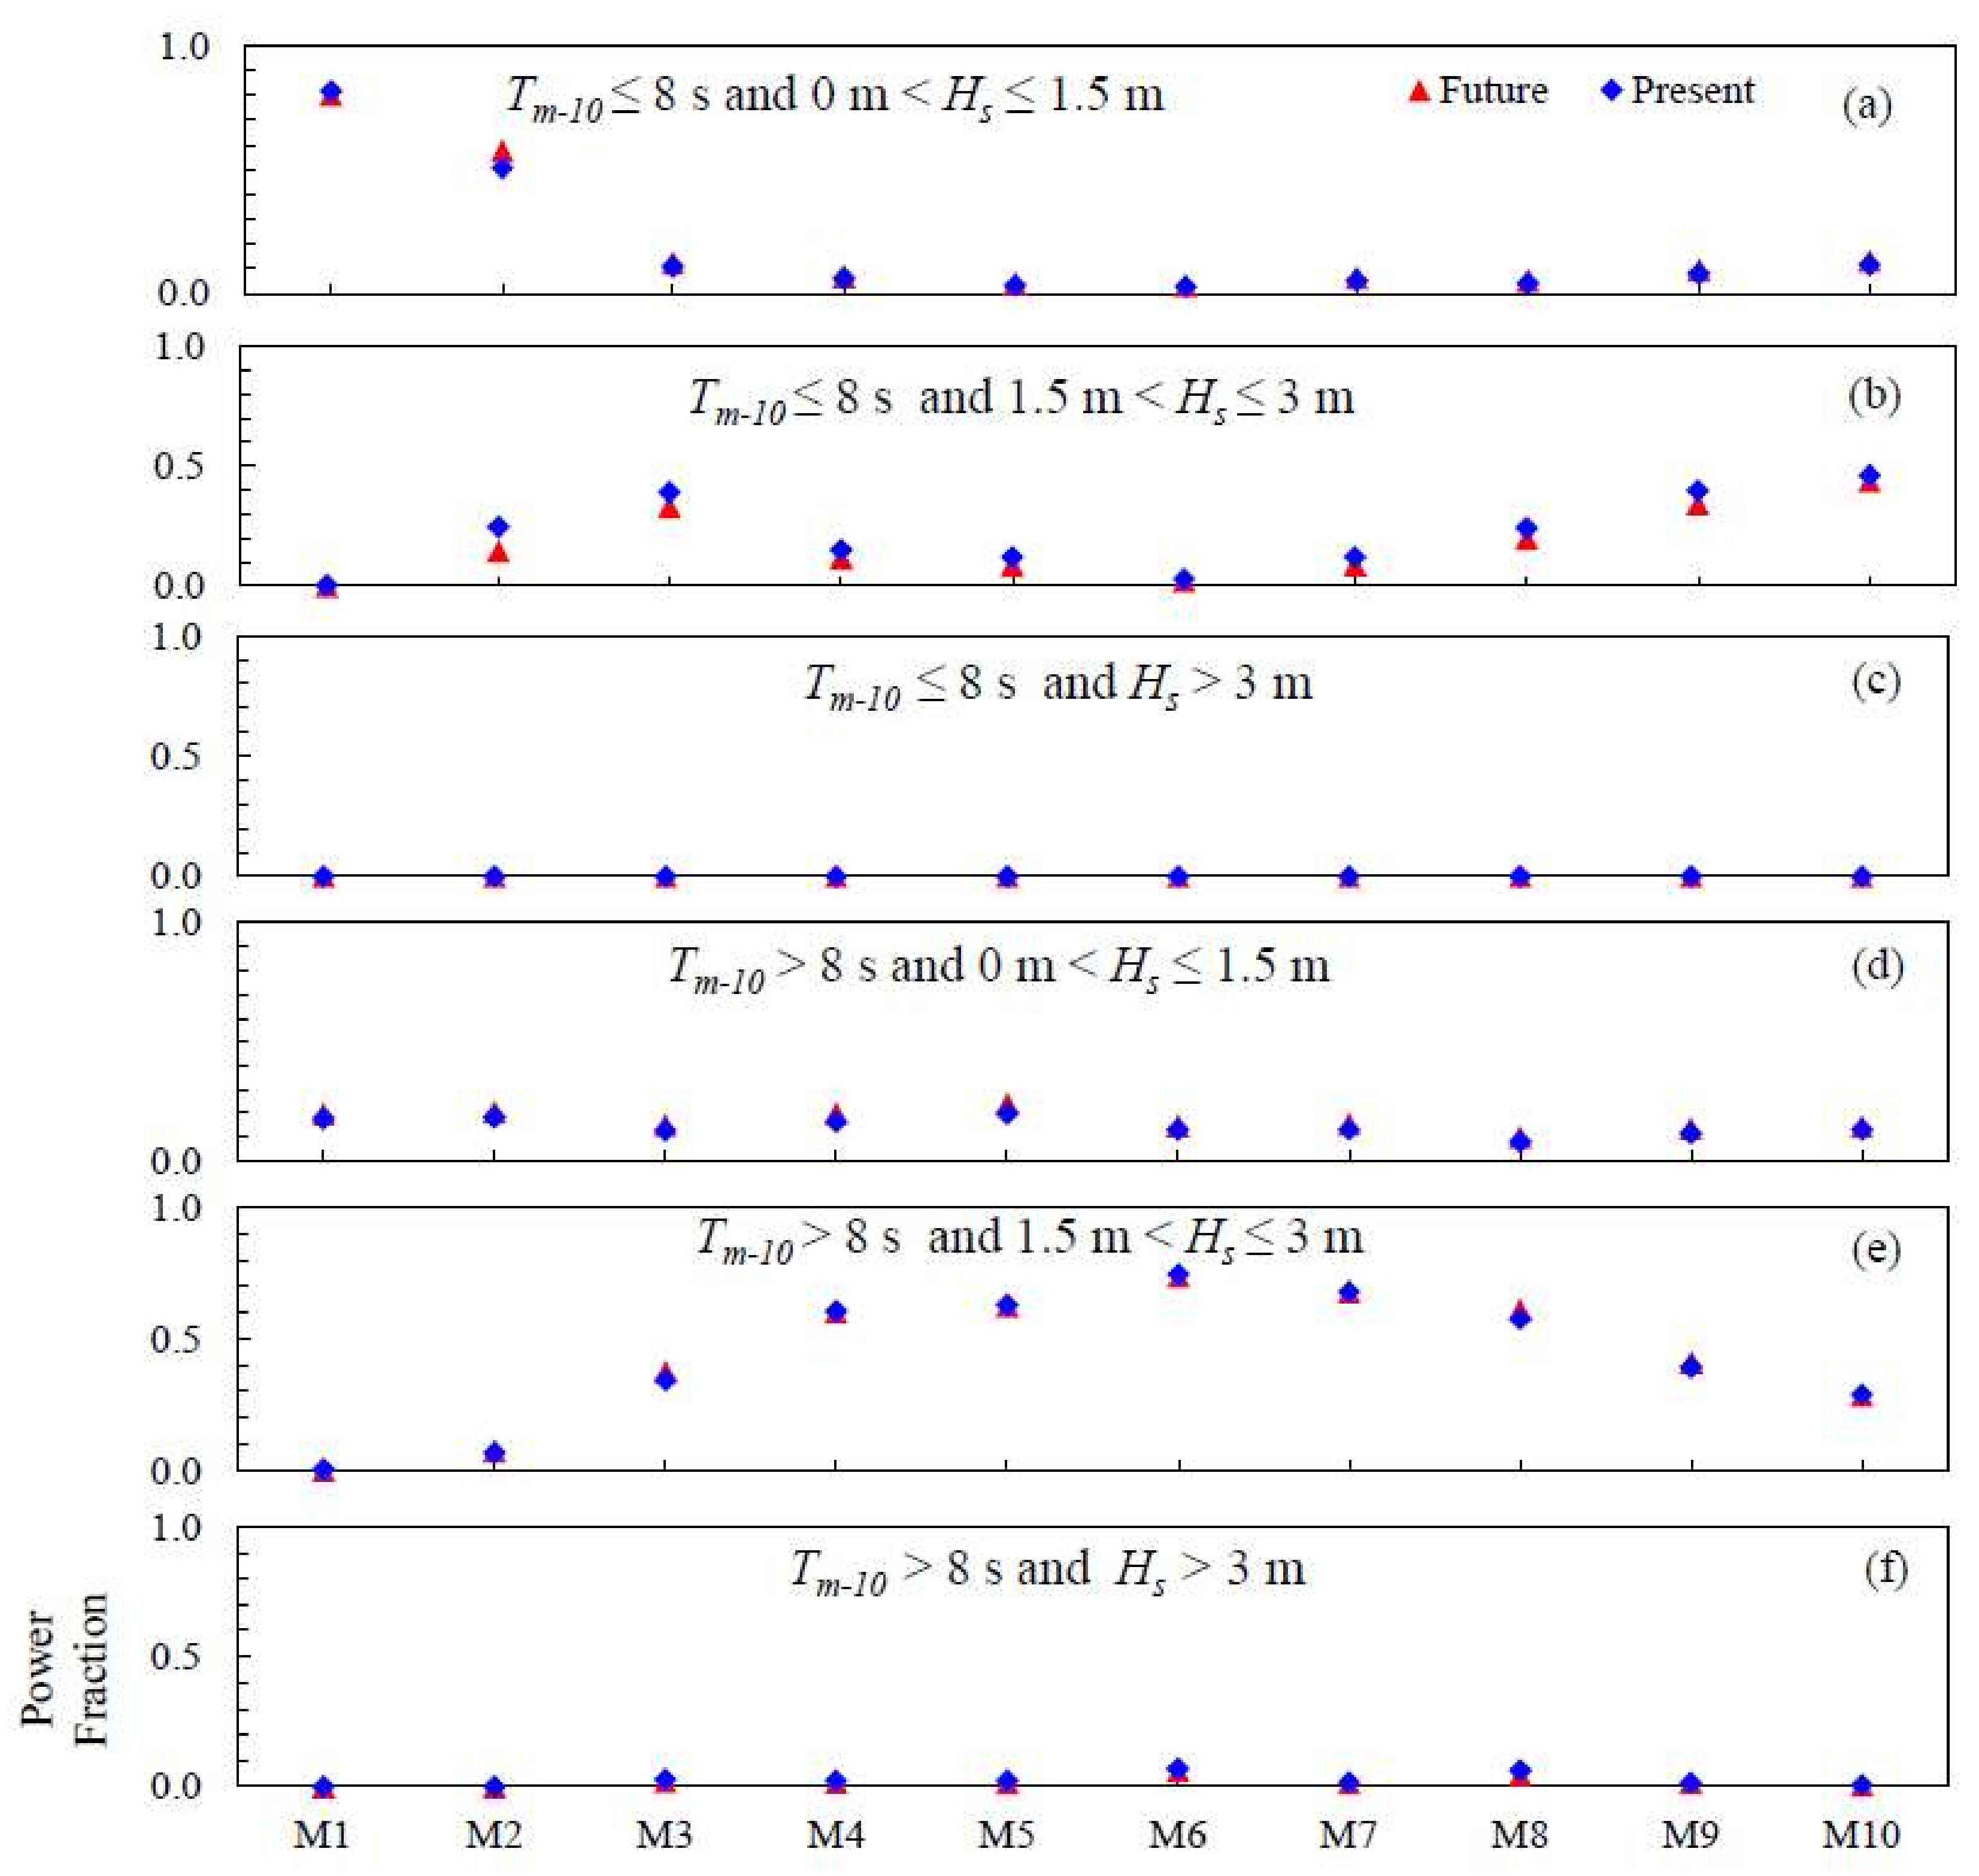
To study the percentage power availability from swell and wind waves in detail and to identify the waves with the highest power availability, we determined wave power from swell and wind waves for three significant wave height bands, at locations M1 to M10. The cut-off frequency between swell and wind waves was taken as 0.125 Hz, following Sheffer et al. [
29]. In
Figure 13a–c, present and future available wave power from wind waves (
Tm-10 ≤ 8 s) for three wave height ranges is shown as a fraction of total available power at each location.
Figure 13d–f shows similar values for swell waves (
Tm-10 > 8 s).
Figure 13 leads to several observations: (i) wave power from wave heights greater than 3.0 m is insignificant at all locations for both wind and swell waves; (ii) The largest fraction of wave power at wind wave frequencies are confined to significant wave heights between 1.5–3.0 m, except at M1 and M2 where the power fraction is larger for wave heights less than or equal to 1.5 m; (iii) Power available from swell waves is higher than wind waves for all locations from M4 to M8; (iv) Most power from swell waves is available from wave heights between 1.5 and 3.0 m; (v) The fraction of swell waves at M1 and M2 is very small for all significant wave heights; (vi) Power from wind waves of significant wave heights between 1.5 m and 3.0 m is smaller in future than under the present climate; and (vii) There is no notable change to power fraction from swell waves in future.
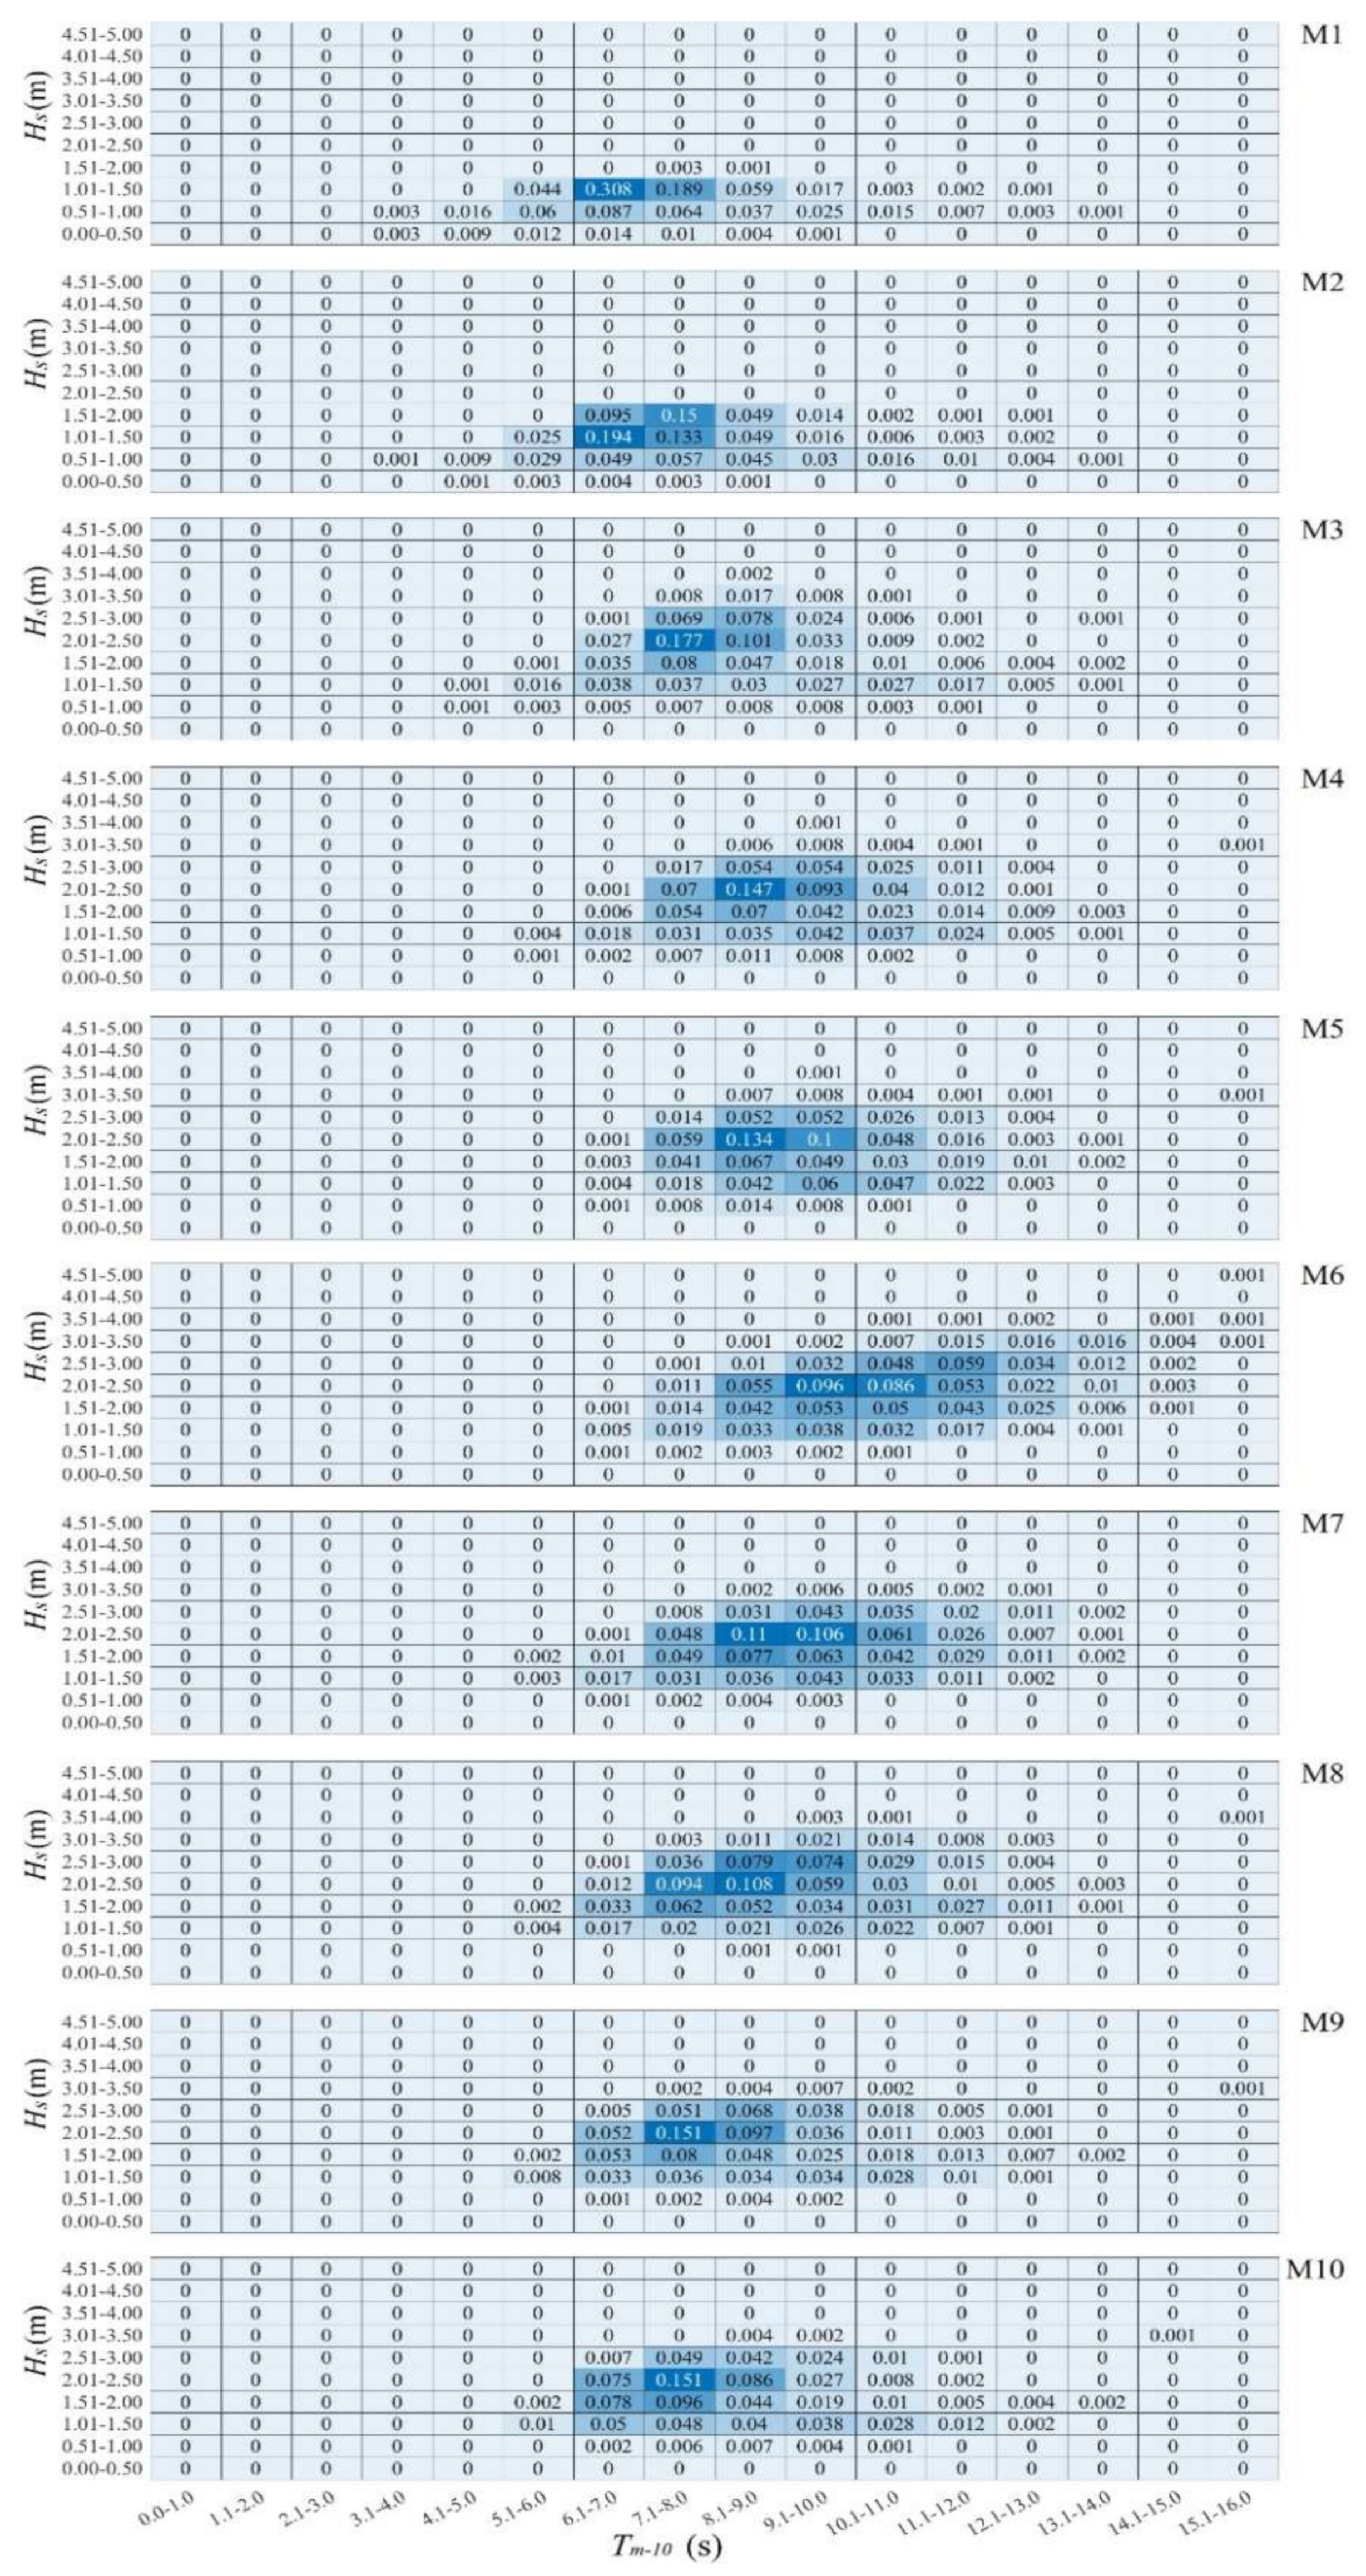
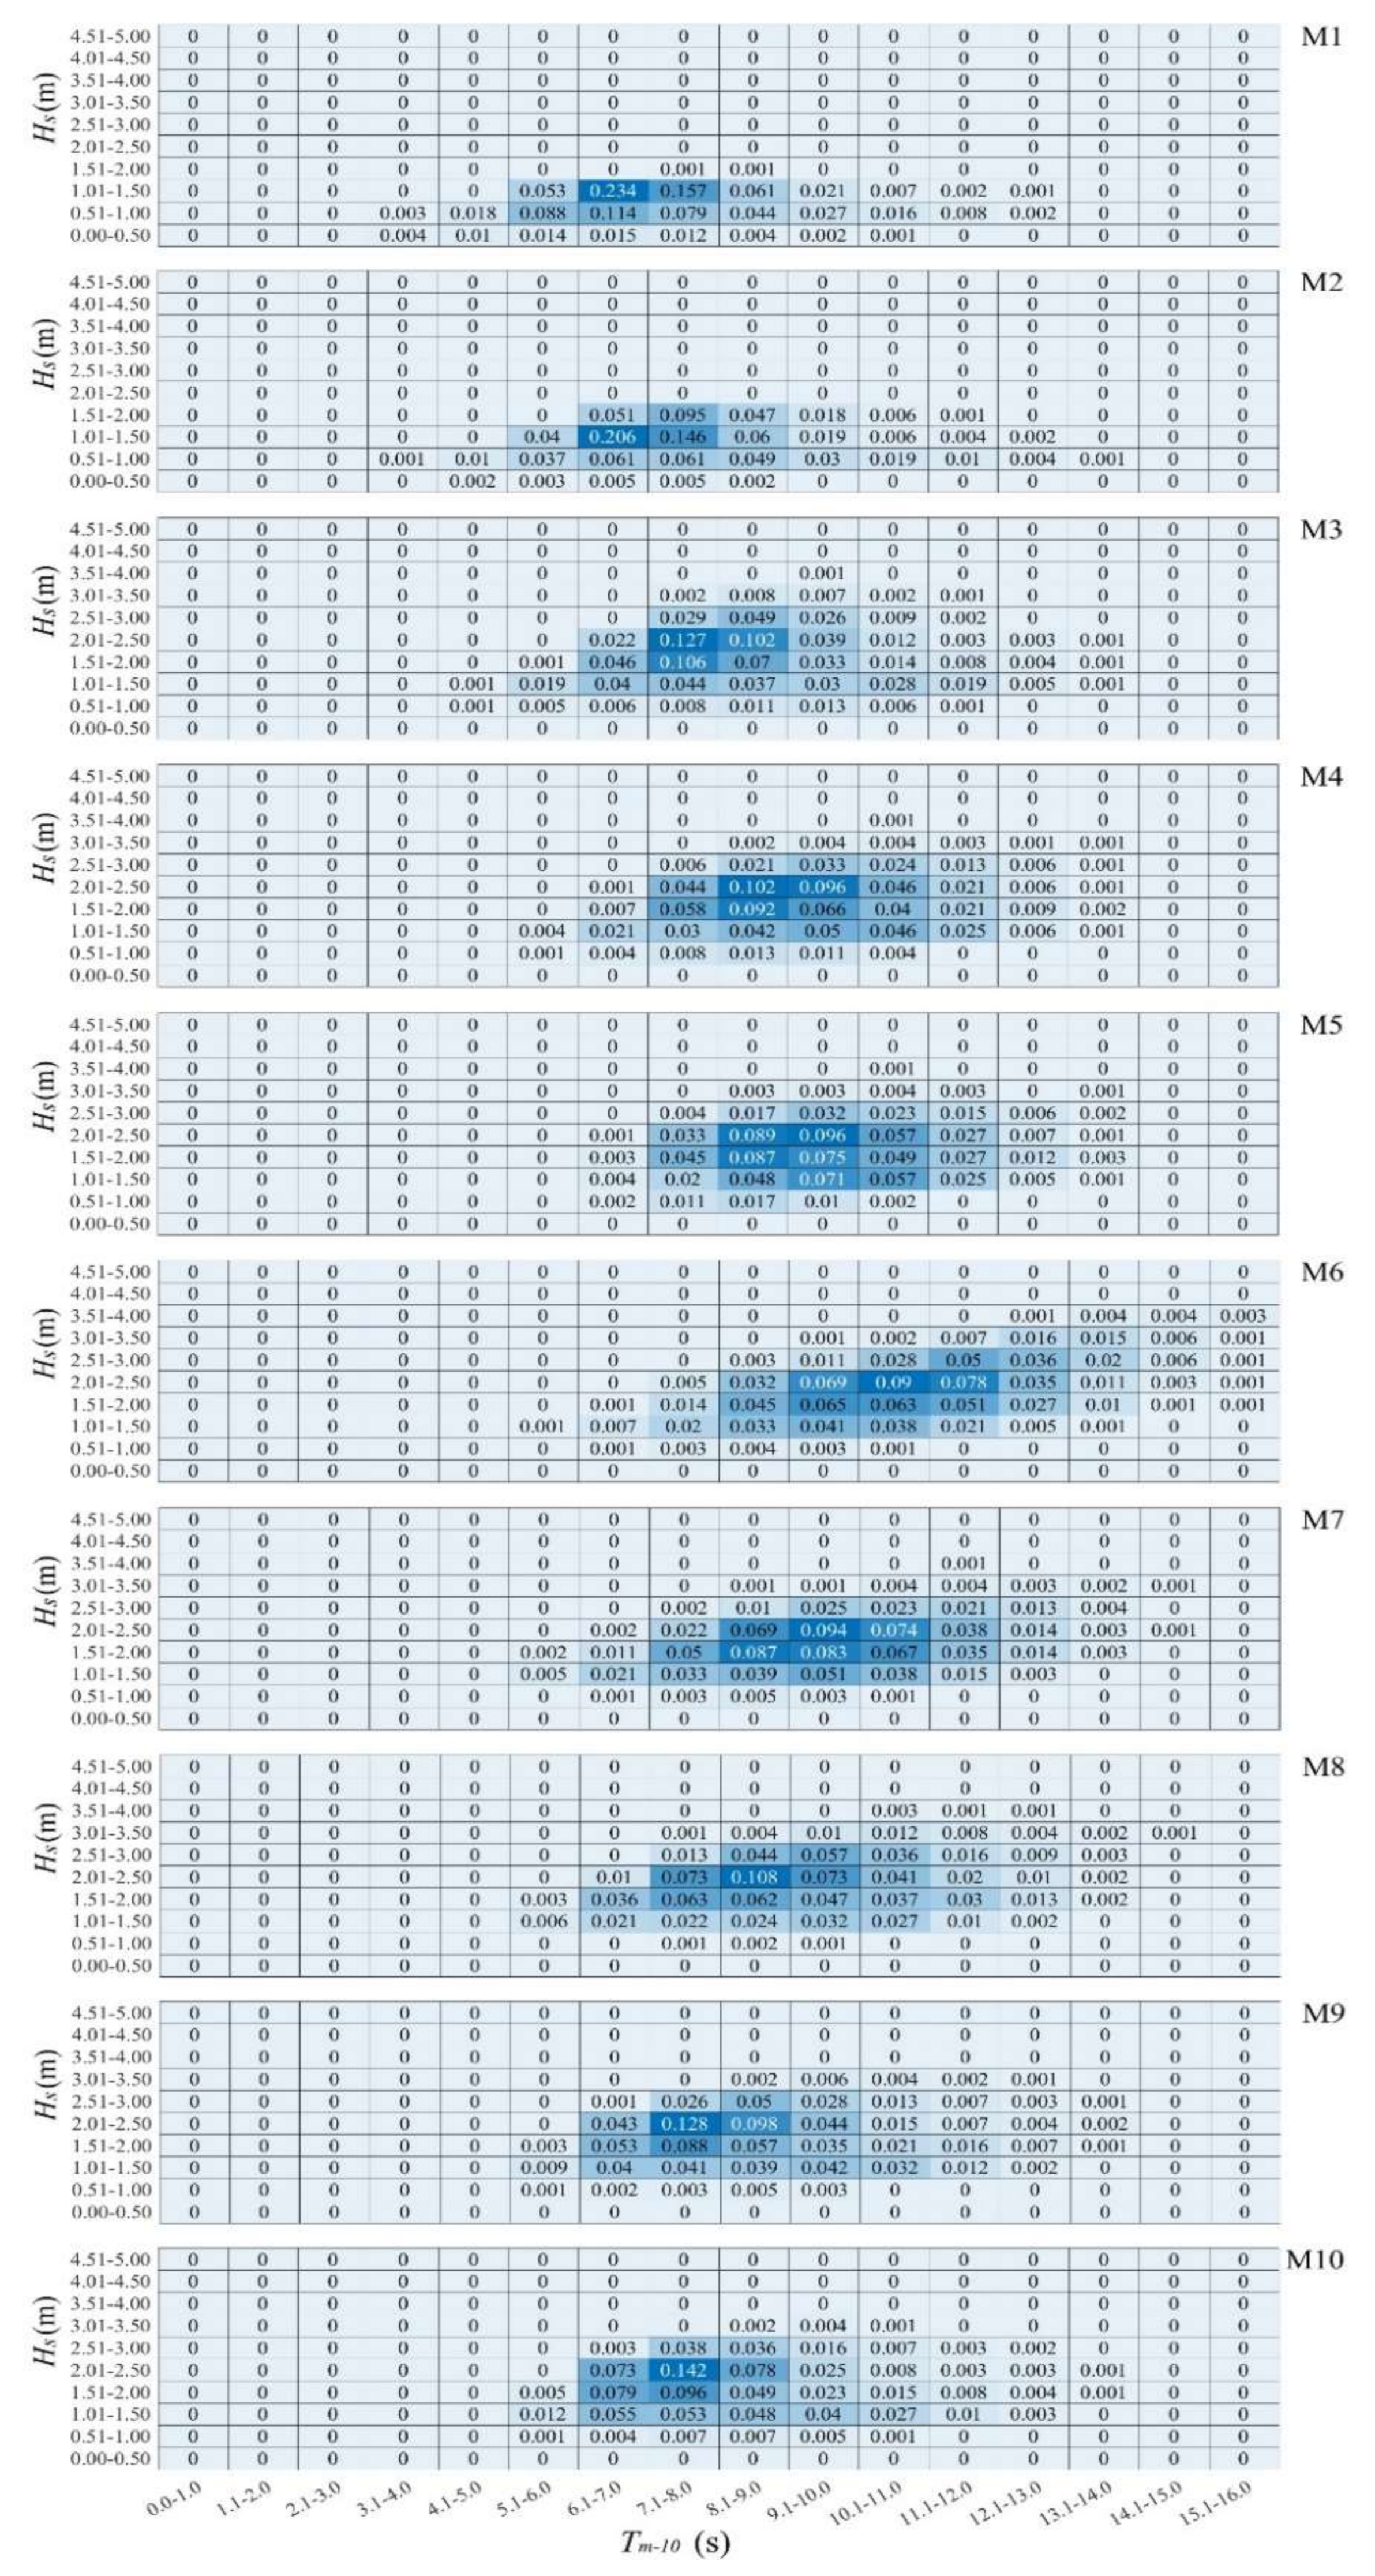
The actual power yield from a wave energy-harvesting device depends on the power matrix of that device, which can considerably vary between devices [
24]. Although we do not intend to focus on a particular wave energy device,
Hs-
Tm-10 scatter diagrams for locations M1 to M10 under both present and future conditions were developed to support wave energy developers who may be interested in wave power generation projects in Sri Lanka (
Figure 14;
Figure 15).
The total wave power yield from each bin can be determined from the product of the square of the significant wave height and the energy period corresponding that bin if the rate of power generation of a given device is known. The summation of energy from all bins will then give the total power production. The figure confirms that the highest percentage of available power corresponds to Tm-10 between 7s and 11s and Hs between 1. 5 m and 3. 0 m at almost all locations.
6. Conclusions
Simulated wave data from a SWAN spectral wave model using high-resolution wind outputs from the AGCM of the Japan Meteorological Agency, MRI-AGCM3.2S, representing 25-year time slices of “present” and “future” climates, were used in this study to investigate the implications of global climate change on the wave power potential around Sri Lanka. The present climate covers the time period between 1979 and 2003, while the future climate covers the end-of-century 2075–2099 time period.
The results reveal that the south-west to south-east coast of Sri Lanka has the highest wave power resource. On average (averaged over the “present” 25-year time slice) 10–16 kW/m of wave power is available on the continental shelf margin along this coast under the “present” climate. Under the “future” climate, the available average wave power along this coastline will be lesser by around 2–4 kW/m, which can be considerable. Future change to the tropical south-west monsoon as a result of global climate change is found to be the cause of this reduction.
The annual average wave power in all areas of west and south reduces in future. However, this reduction is less than 10% on average in any given year at any given location.
Although a reduction in wave power potential is found at long-term time scales corresponding to global climate change, inter-annual variability of wave power at decadal timescale is largely stable.
The area between the west and south of Sri Lanka is best suited for large scale wave energy-harvesting projects. However, some areas in the north-west and the south-east also contains wave power, viable enough for small-scale energy-harvesting projects.
Seasonal variability of wave power as a result of the tropical south-west monsoon will be a primary factor that need to be taken into consideration in the design and development of any future wave energy-harvesting project.
Potential future wave energy developments in Sri Lanka should consider the seasonal and inter-annual variability of annual average wave power under both present and future climates.

 ,
, 


