
CFD Analysis of the Location of a Rear Wing on an Aston Martin DB7 in Order to Optimize Aerodynamics for Motorsports


1
Faculty of Science and Engineering, Swansea University, Swansea SA1 8EN, UK
2
Energy Safety Research Institute, Swansea University Bay Campus, Swansea SA1 8EN, UK
3
Arizona Institute for Resilient Environments and Societies (AIRES), University of Arizona, Tucson, AZ 85721, USA
4
Department of Chemistry and Department of Materials Science and Nanoengineering, Rice University, Houston, TX 77005, USA
5
Faculty of Engineering, Universiti Teknologi Brunei, Jalan Tungku Link, Gadong BE1410, Brunei
*
Author to whom correspondence should be addressed.
Vehicles 2022, 4(2), 608-620; https://doi.org/10.3390/vehicles4020035
Submission received: 4 April 2022
/
Revised: 24 May 2022
/
Accepted: 7 June 2022
/
Published: 13 June 2022
(This article belongs to the Special Issue Feature Papers in Vehicles)
Abstract
:The purpose of this study is to identify the initial lateral and vertical location and angle of attack of a GT4-style rear wing on the rear downforce for an Aston Martin DB7 Vantage, prior to installation. The tests were completed with a two-dimensional model, using the Computational Fluid Dynamics (CFD) software, Fluent Ansys. The tests were completed using a range of velocities: 60–80 mph. Optimization of the position of the rear wing aerodynamic device was permitted under the Motorsport UK rules for multiple race series. The results show that while the drag decreases the farther back the wing is located, the desired configuration for the rear wing with regard to downforce is when it is positioned ca. 1850 mm back from the center point of the car, with an attack angle of 5°. Unusually, this is to the front of the boot/rear deck, but it is remarkably similar to where Aston Martin set the rear wing on their Le Mans car in 1995, above where the rear windscreen met the boot hinge, which was based upon wind tunnel studies using a scale model. Our results suggest that while 2D simulations of these types cannot give absolute values for downforce due to aerodynamic device location, they can provide low costs, fast simulation time, and a route for a wide range of cars, making the approach accessible to club motorsports, unlike complex 3D simulation and wind tunnel experimentation.
1. Introduction
The aerodynamic shape of race cars is designed to make it easier for the car to move through the air. The less resistive force (drag) exerted on the body of the car, the less energy needed to overcome the drag. Therefore, the excess energy (bhp) can be used to increase the straight-line speed and improve acceleration out of the corners. Nevertheless, lap times are also significantly improved by the speed a car carries into and exits a corner with. Therefore, sufficient force needs to be exerted onto the car to allow for the driver to hold the ‘racing line’ whilst transferring as much power available from the driving wheels to the road without the loss of traction. In this regard, aerodynamic devices that increase downforce are important additions to a car designed for the street to enable it to be competitive on the race circuit [1].
Within the motorsport industry, aerodynamic research is conducted through a combination of wind tunnel testing (either model or full size) and Computational Fluid Dynamics (CFD) [2,3]. Increasing concern has been directed at the high costs associated with the running and development of a racing team and with large costs associated with creating models and the running of the wind tunnel itself; thus, the trend has been toward CFD design work with wind tunnel testing used for data verification. Unfortunately, these resources are only available to race car manufacturers and professional race teams, leaving the amateur “club” racer to rely on off-the-shelf parts from specialty suppliers often without being able to verify performance gains except by testing on the racetrack, which is time-consuming and expensive if many variables are to be investigated. Exceptions have been the extensive CFD work carried out by many University groups on Formula SAE cars [4,5,6,7], as well as detailed studies using the RANS model to determine the effect of devices such as the Gurney flap for car racing applications [8,9]. The goal of the present study is to determine if modest cost (time) calculations are suitable for determining the initial location parameters of aerodynamic devices to minimize trial-and-error approaches for club motorsports.
The greatest challenge in dealing with CFD simulations is shape optimization, which is very time-consuming and often requires multiple iterations. To reduce the time needed to achieve an optimal shape and make the design process more efficient, CFD analysts are turning to Adjoint Solver formulas, which calculate gradients (directions, quantities) directly by solving conjugate equations and makes them independent of design variables. ANSYS Fluent software employs the Adjoint Solver module for shape optimization, which allows for automatic adjustment of the geometrical parameters of a specific design to specific optimization goals. It provides information on how to modify the geometry to achieve the goals of the design (e.g., minimization of the drag or lift force). This information is communicated by modifying the mesh to see the effect of the recommended changes. Damjanović et al. have shown that simplification of CFD analysis may also be achieved by the use of 2D analysis by providing some basic guidelines that could be redesigned on the product in order that the resulting 3D analysis provides “better and more acceptable results” [10]. Given that 3D analysis is aimed at replicating on-track performance, the conclusions of Damjanović et al. that 2D analysis provides a “good indicator of the real state” means it could be used to provide an initial set-up for subsequent on-car installations. It has been proposed that this approach can significantly shorten the time of analyzing a problem because the 2D analysis in relation to 3D is much simpler and the time for obtaining a solution is much shorter. Although a comparative assessment suggests that there is a good agreement [11], it is necessary to note that the results could change when the same problem is considered in 3D. The use of 2D analysis in combination with ANSYS Fluent software should allow for good estimates of aerodynamic component design/location at low costs. Finally, we note that the present study is not intended to provide definitive values of lift and drag but to determine the relative effects of the position of an aerodynamic device in order to save the amateur racer costly installation of multiple different components and on-track testing time.
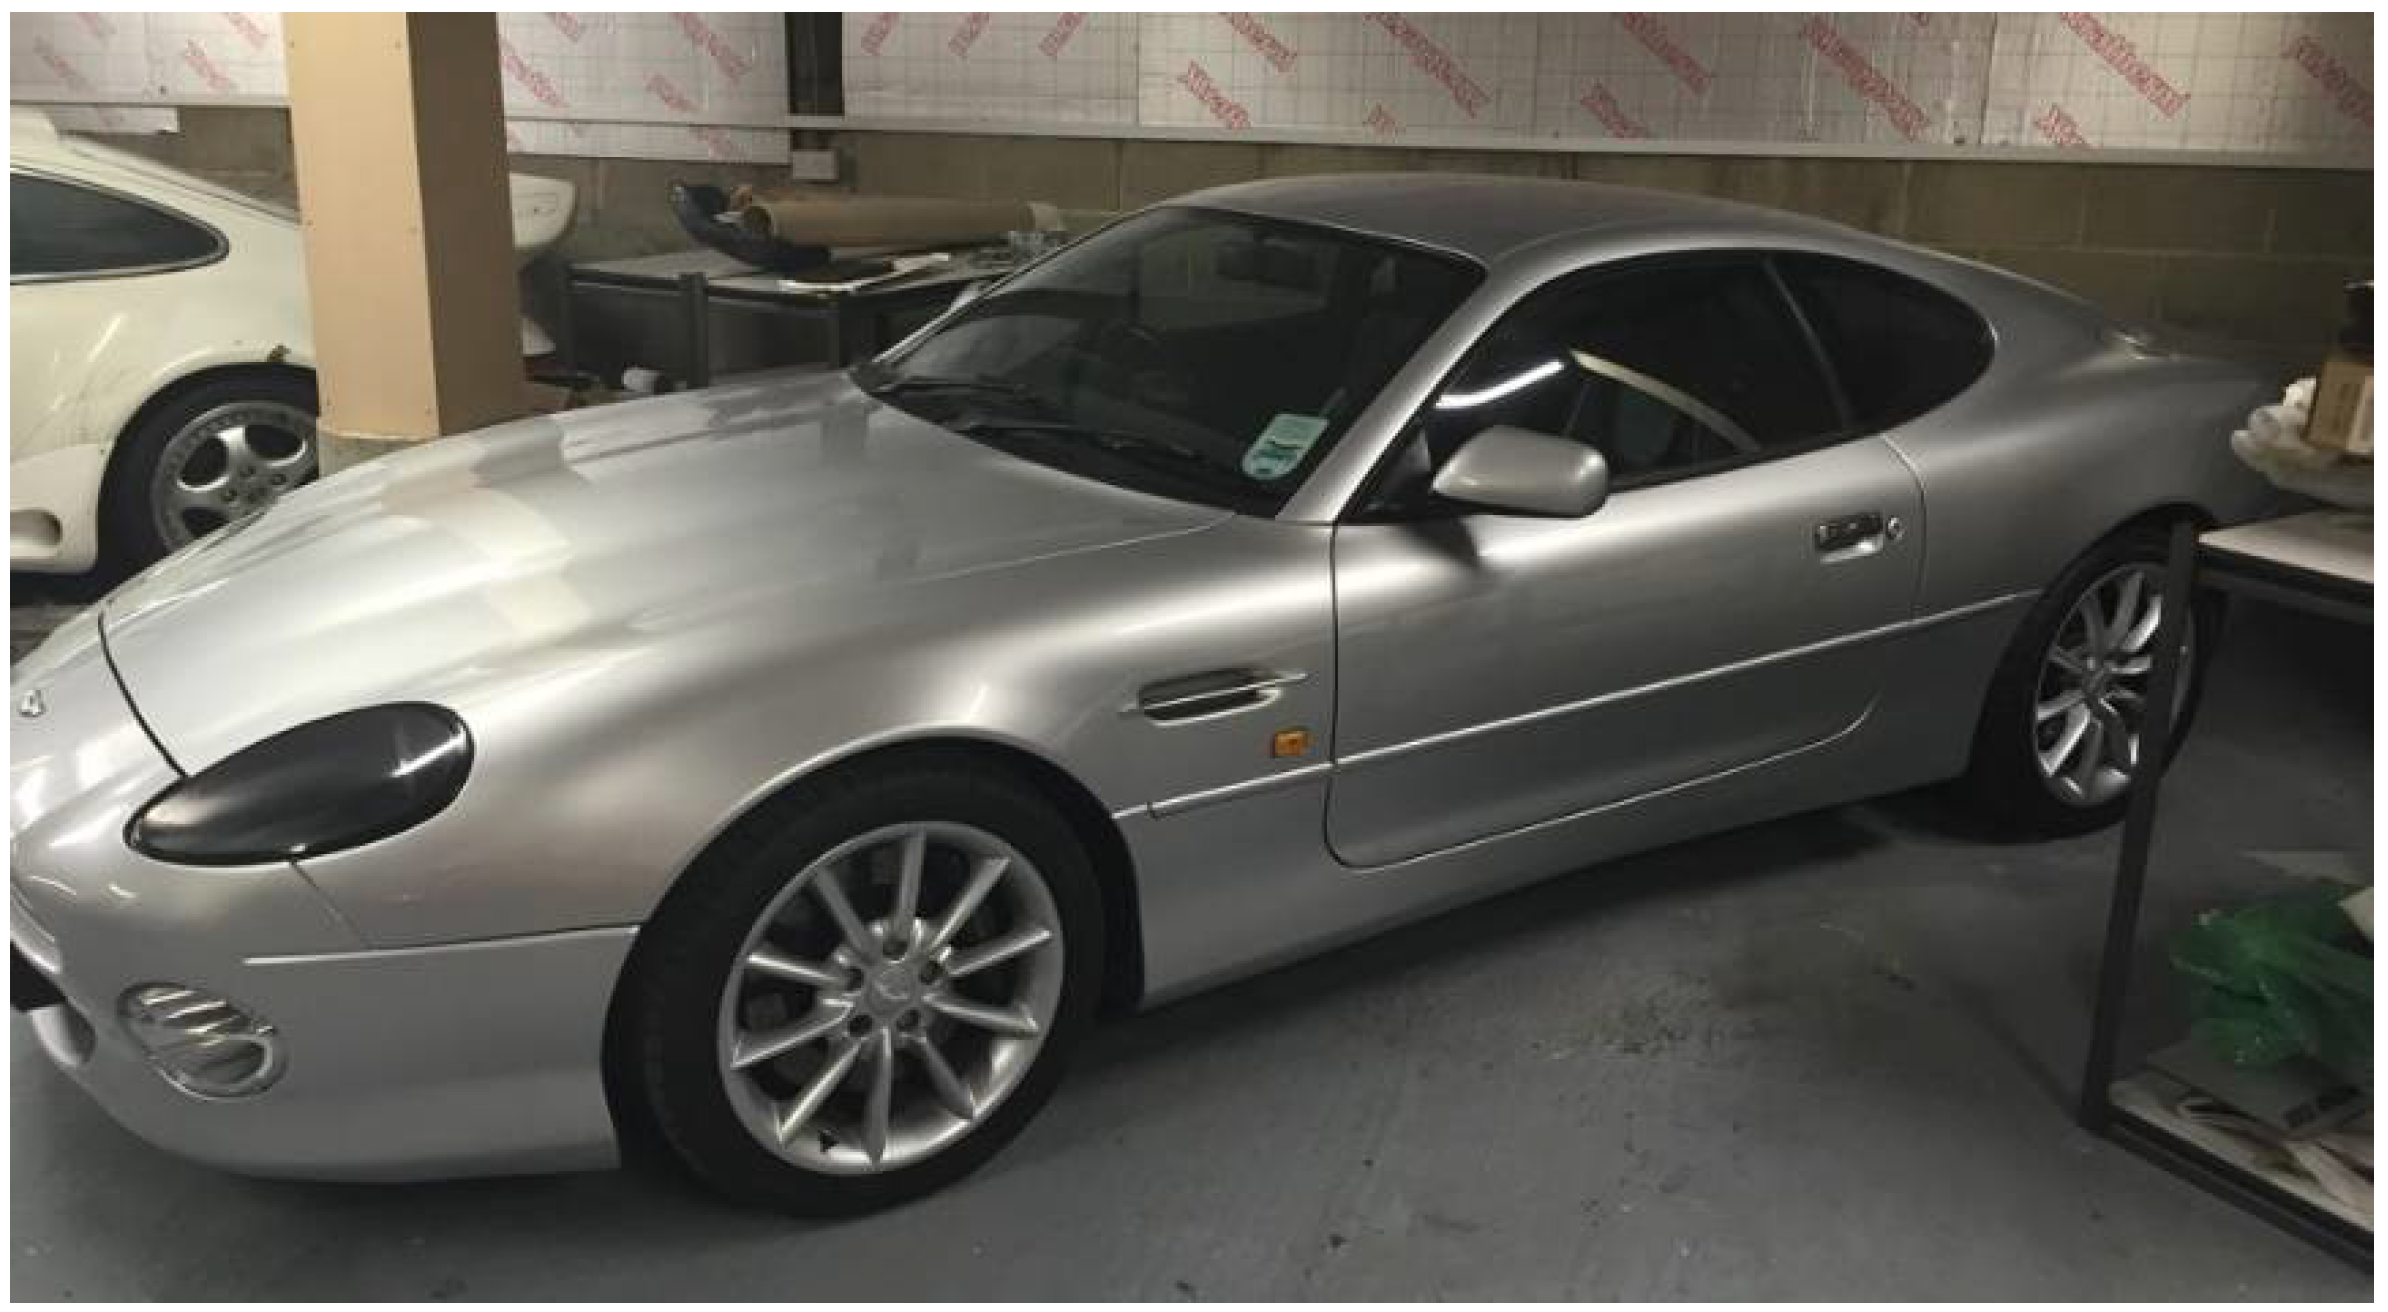
The extent to which the aerodynamic performance of a car can be improved is a combination of the limits established by the regulations of the sporting body and any specific limitations dictated by a particular car’s size and shape. In the present study, the car in question is an Aston Martin DB7 Vantage (Figure 1). The goal is to race in historic and classic racing, in particular CSCC New Millennium [12] and Classic and Historic Thunder Saloons [13] in the UK, and Trophee GT Classic in France [14]. In each of the UK series, non-production aerodynamic devices, such as a rear wing, are allowed over the factory specifications as long as they fall within Motorsports UK rules J.5.2.7 [15]; the French series has similar limitations allowing for a single configuration to meet all series. The purpose of the research is to provide the initial location of a rear wing for implementation on a real car.
2. Methods
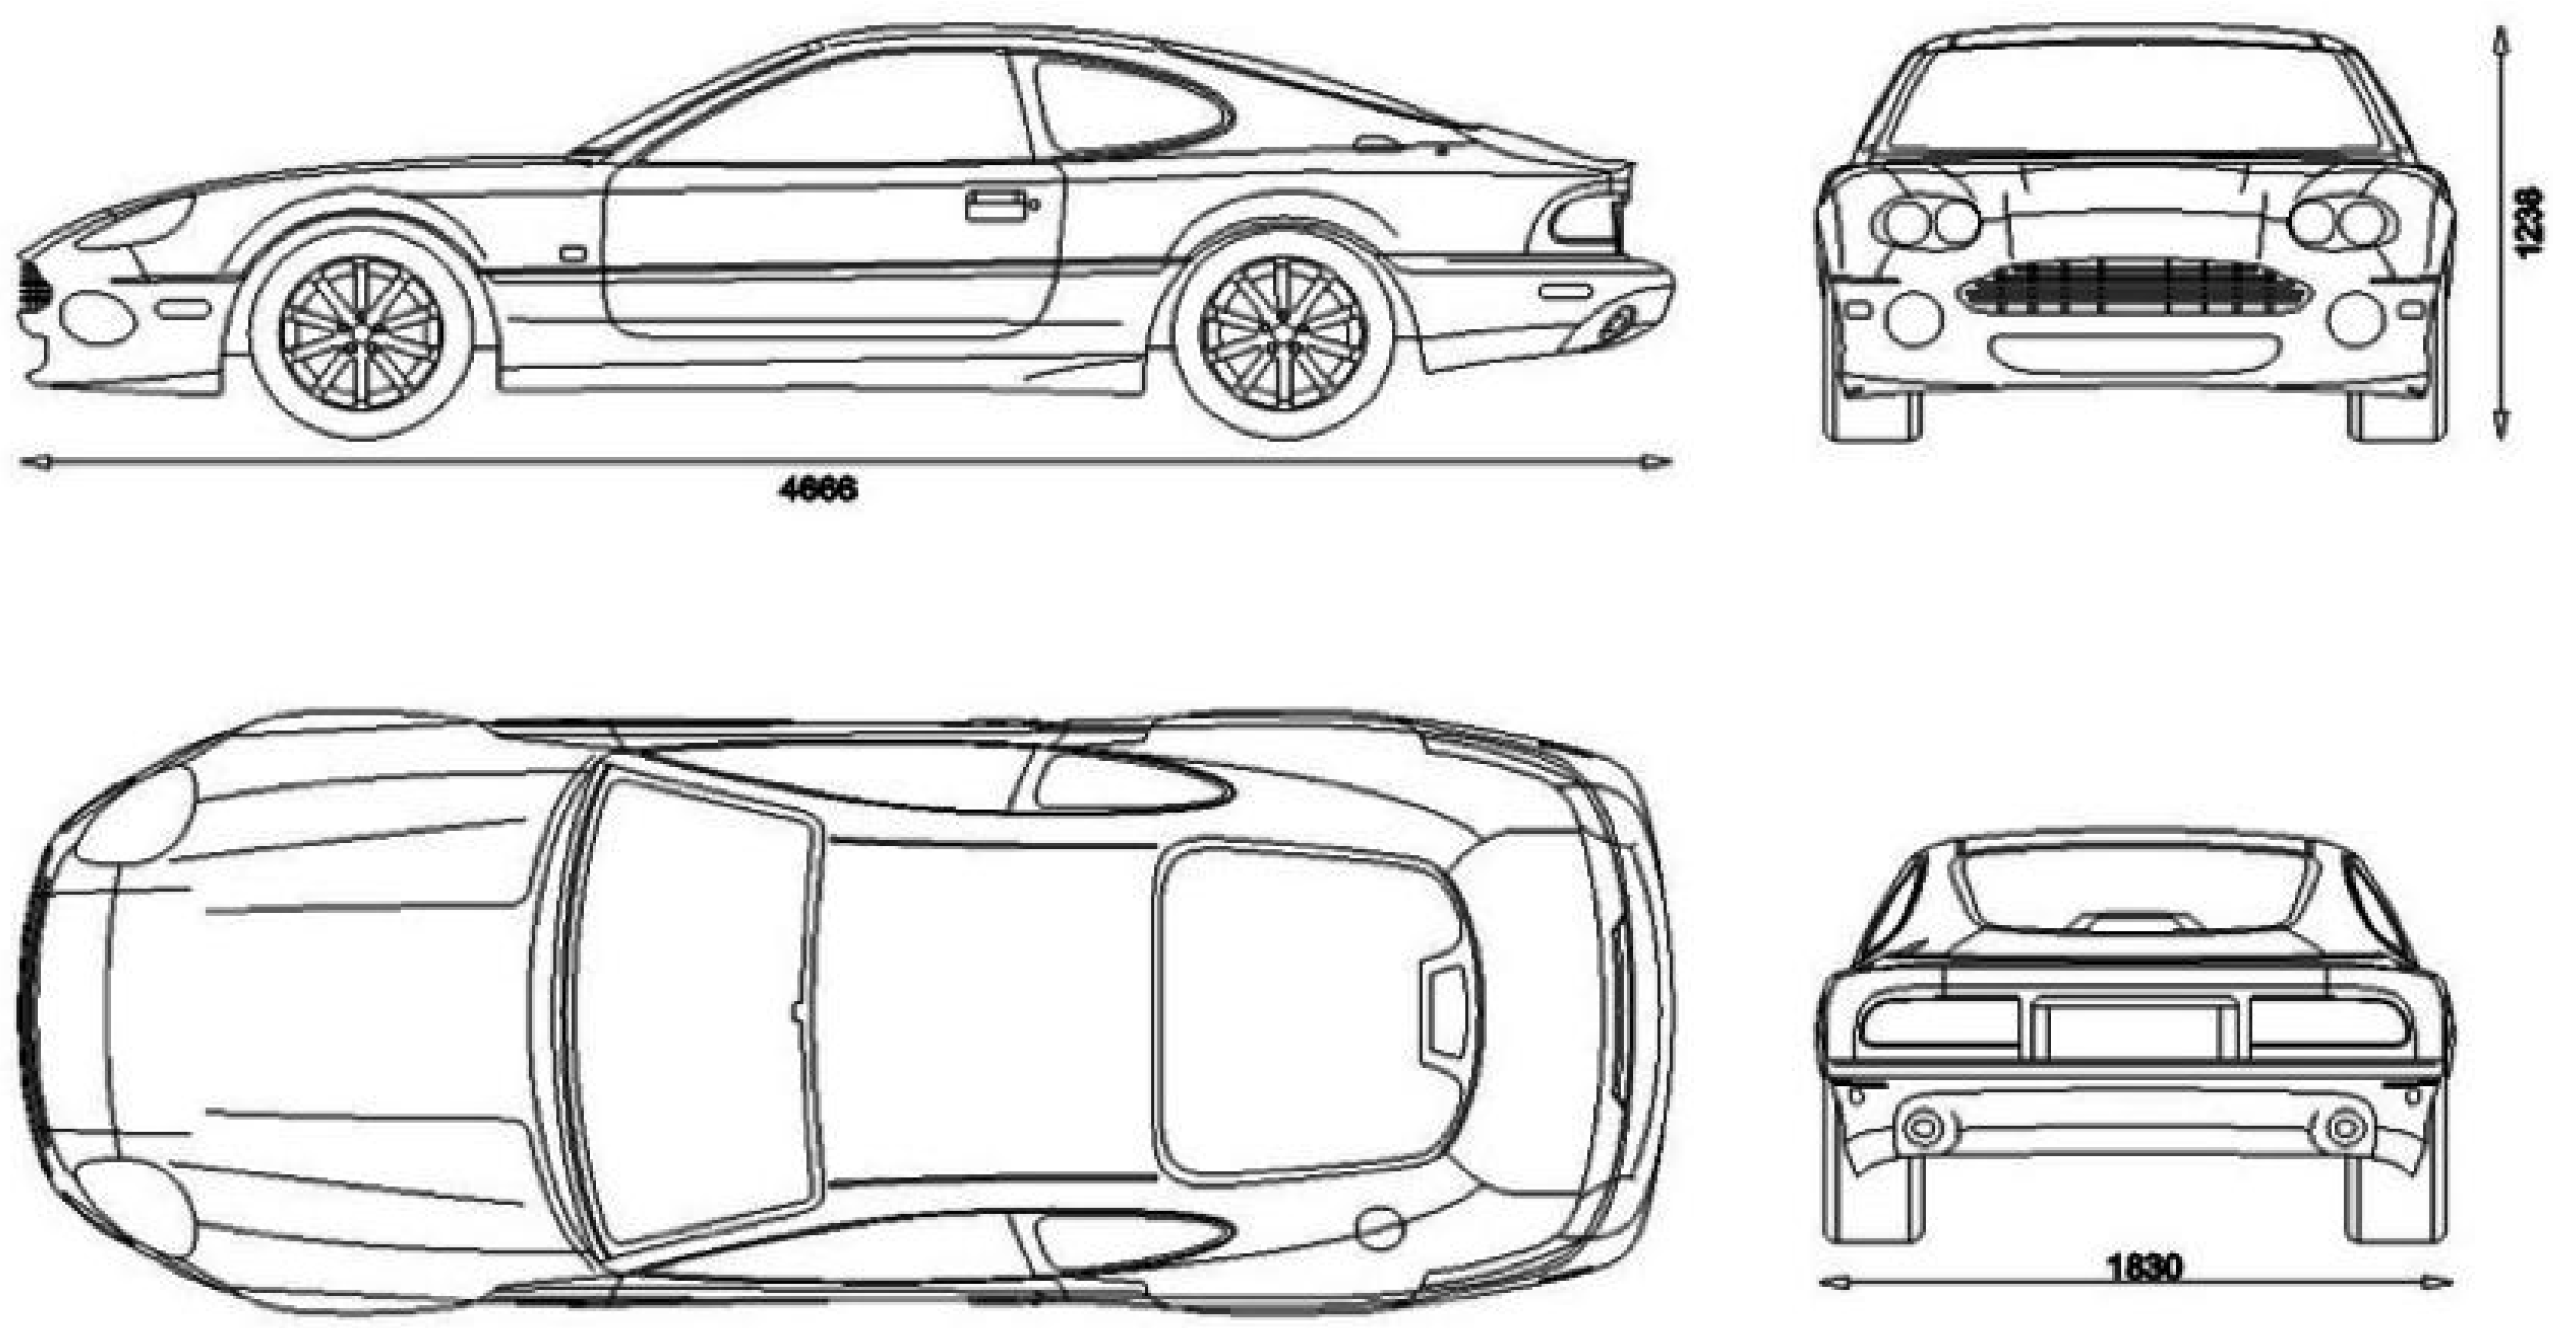
The various fluids tests were performed using ANSYS Fluent (CFD). The fluid simulation software utilizes the finite volume method to discretize and solve the non-linear steady-state solutions. There are multiple different ways Fluent (CFD) can be set up because of multiple different factors, e.g., the geometry, whether the tests are analyzing internal or external flow, as well as the size and type of mesh being used; these are all taken into consideration when choosing a suitable set-up. To run the study, prior to meshing, the initial CAD model of the DB7 was first generated using Solidworks and imported into ANSYS design modular. The model was configured using the dimensions of the Aston Martin DB7 Vantage obtained from blueprints (Figure 2) purchased from www.the-blueprints.com (accessed on 15 October 2019). The Aston Martin has a length of 4666 mm with a width of 1830 mm and a height of 1238 mm. The left side view was used to obtain the desired 2D image.
The model that best fitted the requirements was the Realizable k-epsilon (k-ε) model using an enhanced wall treatment. The k-epsilon models are most typically used for the analysis of external flow and bodies with complex geometries [16,17]. For this experiment, the realizable k-ε turbulence model with enhanced wall treatment was chosen due to its credibility in assessing flow behavior, particularly in predicting the flow separations [18]. In addition, compared to the other k-ε turbulence models, Singh [19] proposed within his research that the values obtained from the realizable model provided the best match for real-life conditions, particularly at fast speeds, therefore being the ideal model for this analysis. The k-ε also does not require a system with a large amount of memory power, plus it offers a good convergence [20]. The realizable k-epsilon model improves the accuracy of two-dimensional (2D) surfaces and streamline curvature models, which is ideal as the simulations will be run in 2D, and the model does not have many strong curvatures. Both the cell zone conditions and the boundary conditions in the model were set up to provide the most realistic conditions the car would be driven.
To gauge the usability of CFD for real-life environments, the cell and boundary conditions were set in such a manner to replicate the most genuine driving conditions. The conditions used were taken at sea level at a temperature of 15 °C, as the International Standard Atmosphere states. The density was taken as 1.225 kg/m3 and the viscosity as 1.789 × 10⁻⁵ kg·m−1 s−1 [21]. The Initial Gauge Pressure was set to 0, which indicates the vehicle is subjected to atmospheric pressure. Reference values are used during post-processing to give Fluent the reference variables needed to calculate the required lift and drag coefficient values (see Table 1). It should be noted that in Table 1, the velocity is set to 80 mph; however, this value is changed between 60 and 80 mph depending on the simulation velocity.
These reference values are essential as this is only a 2D model, and some variables such as depth and frontal area need to be manually determined. The frontal area was estimated (as the projected area is not a tetrahedral) from the front view on the blueprints in Figure 2. Second-order (and second-order upwind) methods were selected to calculate the relevant values, e.g., pressure, momentum, and turbulent kinetic energy. This was predominantly to achieve more reliable results, although contributing to a slower and more challenging convergence [16]. The limitation to this choice is that it results in a slower convergence, but it outputs more accurate results when dealing with a triangular/tetrahedral mesh and when the flow is not parallel with the mesh grid. The residuals (continuity, x-velocity, y-velocity, k and epsilon) were left at their default values of (0.001). After some initial testing, there was some difficulty for the solution to converge when the residuals were set to 1 × 10⁻⁴ or below. The solution would sometimes converge, but this was not a consistent occurrence. This was partially because the turbulent model chosen has difficulty solving for epsilon. This issue was not a concern as stable output values were achieved with the default residuals.
Once the geometric model has been imported into the ANSYS Design modular, verification of the selected mesh is paramount to the success of the simulation. At the same time, the complexity of the mesh will also affect the required computational power and time required to run the overall study; therefore, a grid dependency test is necessary to determine the perfect compromise [22]. The size of the mesh was determined by performing a mesh dependency study to identify the appropriate mesh size and to ensure good quality results were obtained. The simulations for the study were run at 60 mph, with the mesh sizes ranging from 180 to 40 mm at 10 mm intervals. Results above 180 mm became very inconsistent. In addition, when the sizing passed below 40 mm, the computational times became too extensive, and the mesh quality began to deteriorate. The chosen mesh was 100 mm, and an average of the results from the lift and drag coefficient was taken. Mesh sizes with a mesh quality below 0.5 were not considered during the choosing process. The mesh with the closest values and the better mesh quality was chosen.
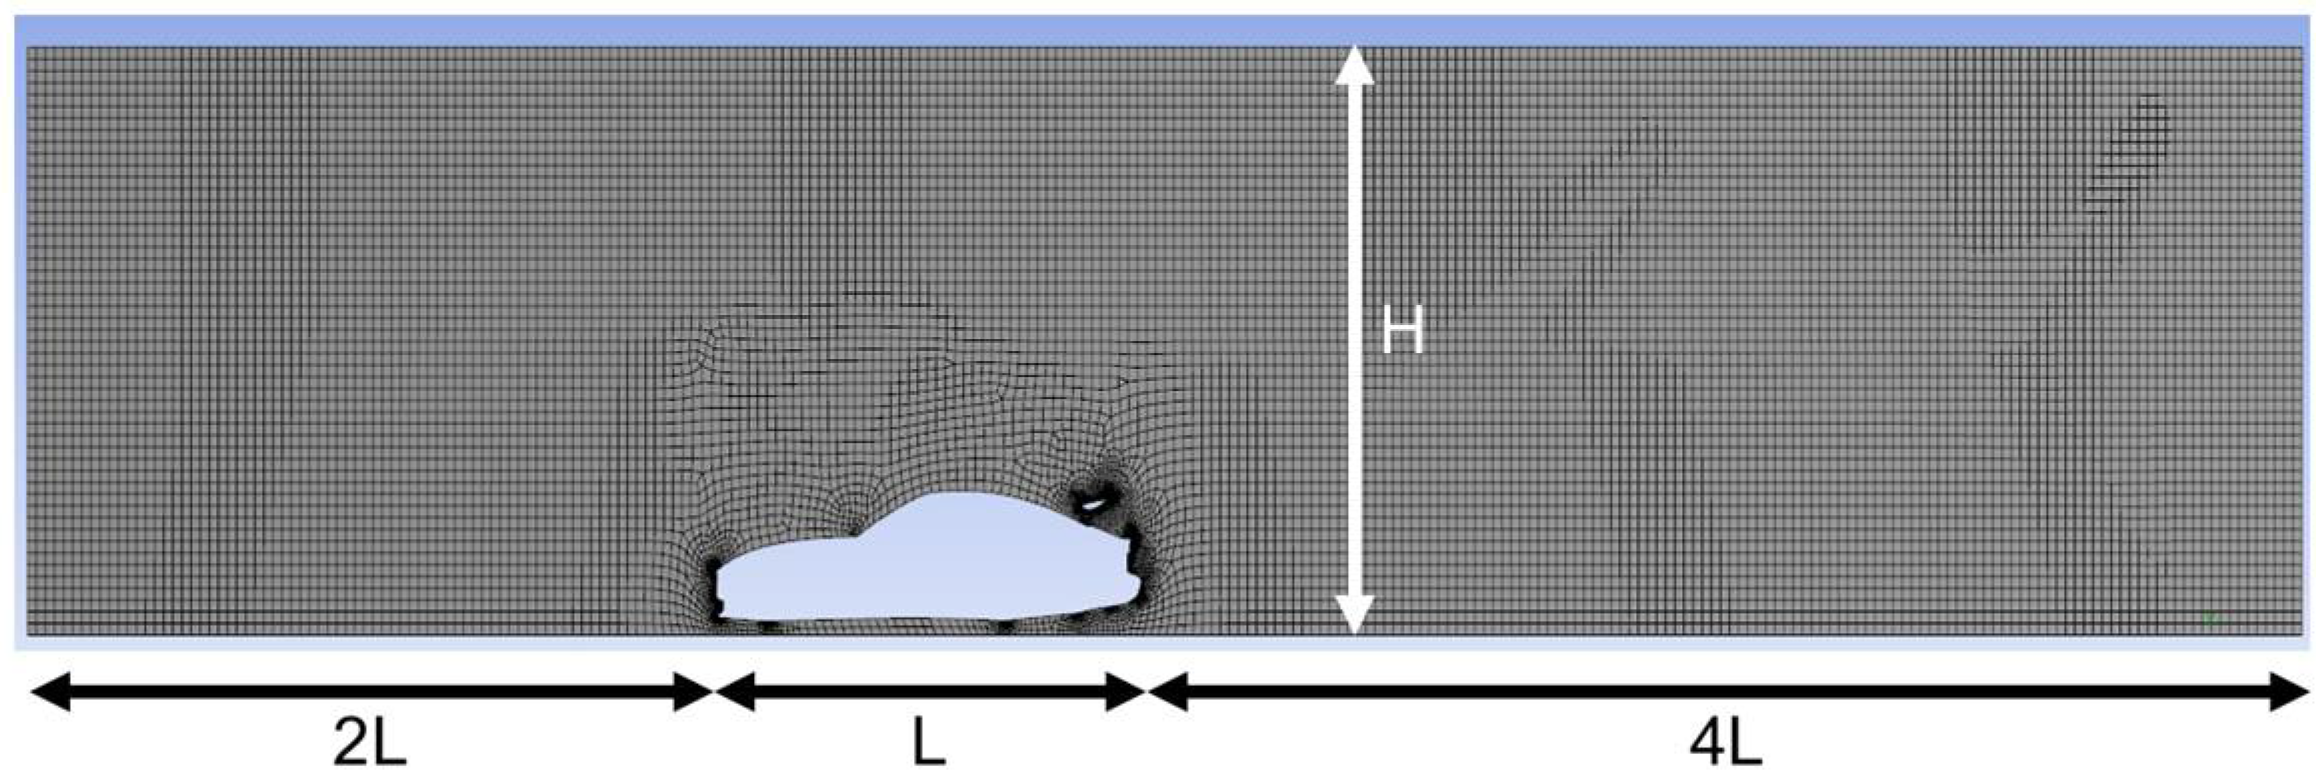
For the requirement of external flow analysis, an outer domain must be considered large enough so that there are negligible interactions between the domain walls and the body of the car but at the same time be limited in order to reduce the required computational time [22]. Cakir’s boundary domain was used as a reference for this simulation, which suggests that the test section should extend double the vehicle’s length at the front and four times the vehicle’s length at the back [23].
The test section size was chosen based on a previous report, which stated that the length in front of the vehicle should be double that of the length of the car. The distance behind should be 4 times the length [23]. Additional measurements were taken from a full-size wind tunnel [24]; this test section was 15 (L) × 7.9 (W) × 4.4 m (H) with a cross-sectional frontal area of 35 m2. A rounded average was taken to obtain a test section of 25 m in length with a height of 5 m, with the car being positioned 7.5 m from the inlet and the ground clearance being set to the stock measurement of approximately 150 mm (see Figure 3).
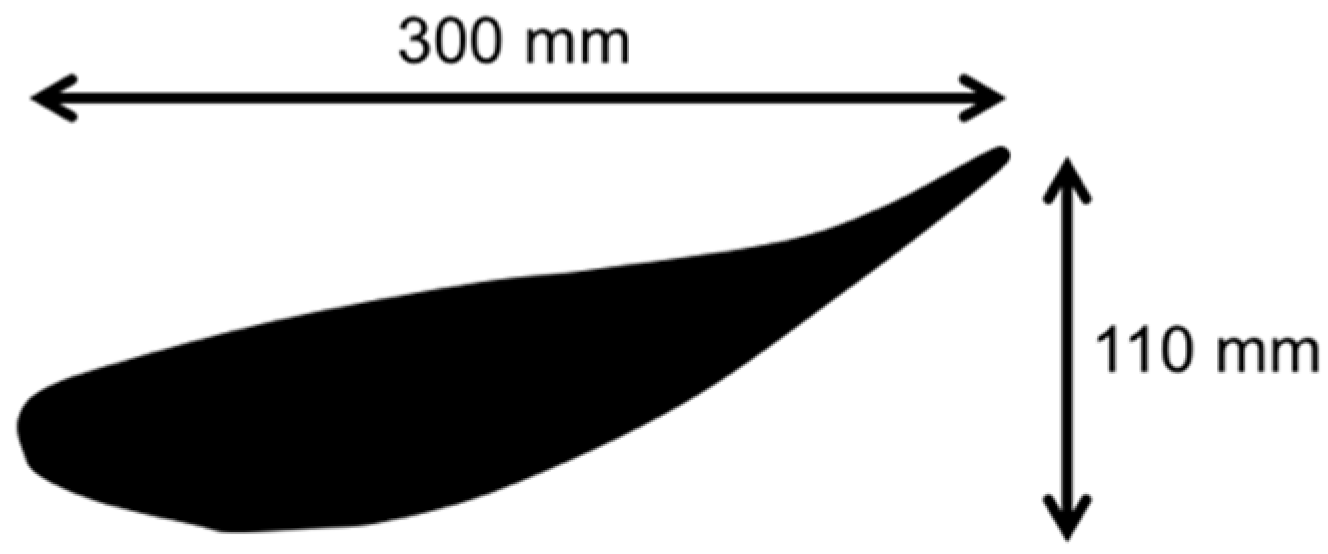
Fluent was set up to output the drag coefficient (Cd) and lift coefficient (CL) for each test. Each test variation was run at 3 different speeds: 60, 70, and 80 miles per hour, which was chosen based upon average lap speeds for CSCC New Millennium entrants on the Brand Hatch Indy track configuration. The effects of alteration to the vehicle’s rake angle and the lateral and horizontal location of a rear wing were analyzed. The results recorded were then compared to the baseline CFD (computational fluid dynamics) results from the standard car. For the rake, the point of rotation was taken between the two axles in the x-plane and was set on the line linking the two axles in the y-plane. The tests were simulating a positive rake only. The angle was altered between 0° and 2.75° in 0.25° increments, and the values for the lift and drag coefficients were calculated for 60, 70 and 80 mph. The rear wing chosen is a standard GT4 wing with a width of 1400 mm (ca. 75% of the width of the car), and the dimensions are shown in Figure 4.
3. Results and Discussion
3.1. Rake Angle
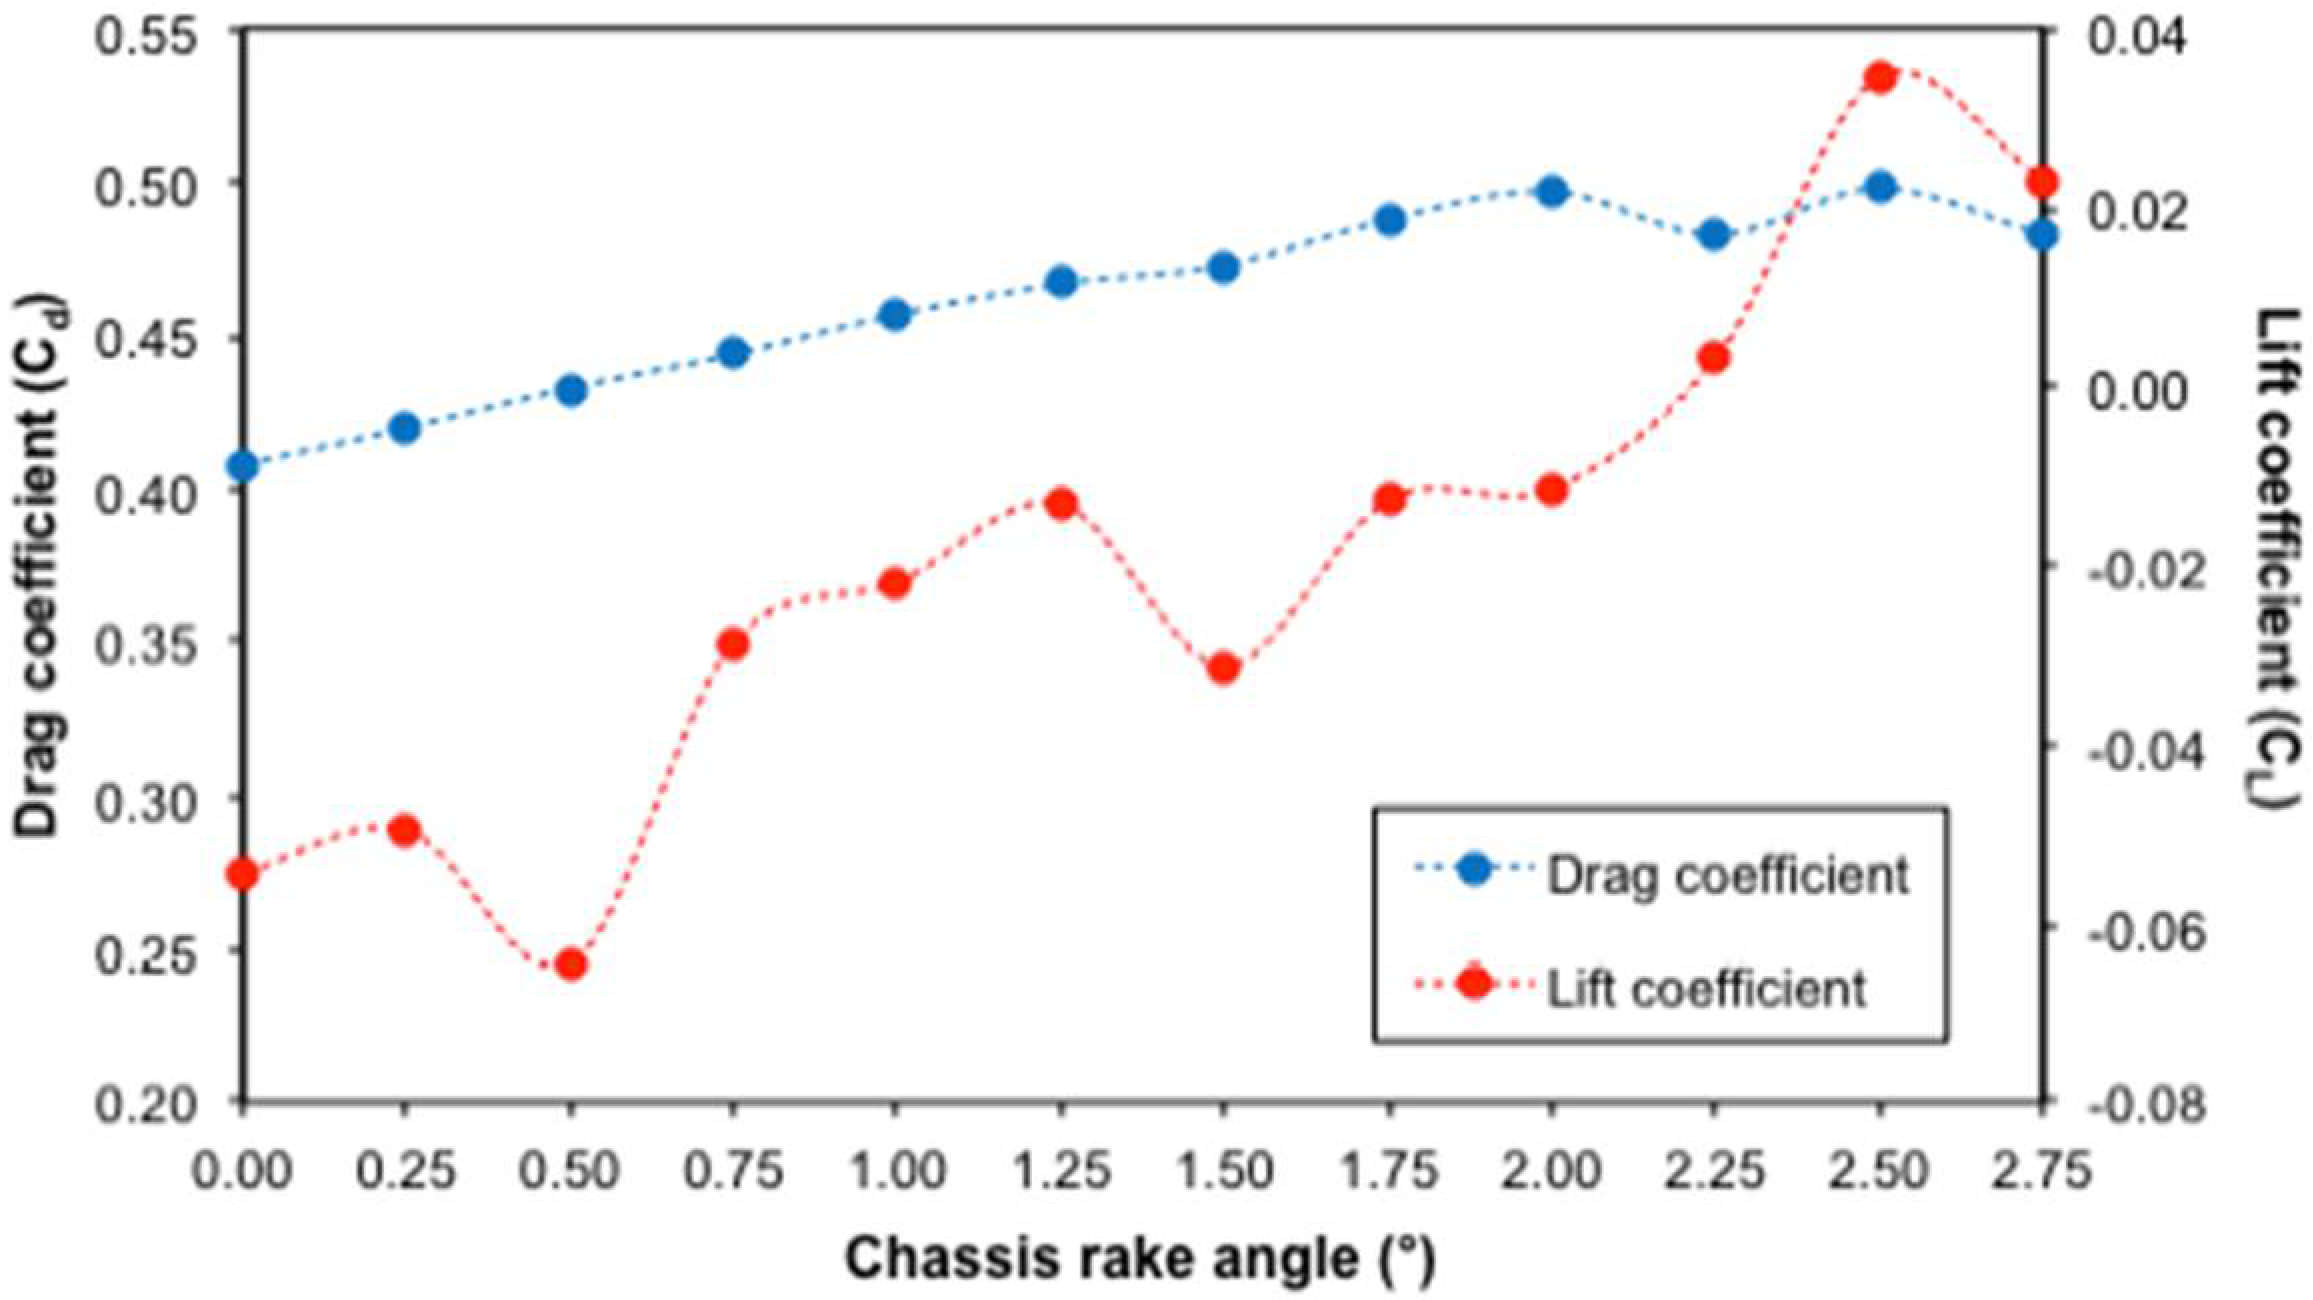
As a consequence, the forward weight bias of the race-prepared Aston Martin DB7 Vantage (i.e., stripped interior, race seat, roll cage and fuel cell [25]) is understeer. A popular way to alter the handling characteristics of a car with respect to understeer and oversteer is to change the ride height of the front and rear in relation to each other, i.e., the rake. Having a higher positive rake (rear higher than front) reduces the lateral weight transfer of the front compared to the rear lateral weight transfer (by altering their relative roll center and center of gravity), which can be used to reduce understeer. The type of rake used in racing is generally zero or positive rake, i.e., where the rear of the car is higher than the front. A rake angle potentially generates a venturi-like effect under the floor where the majority of the ground effects (or downforce) are generated [26]. The angle was altered between 0° and 2.75° in 0.25° increments, and the values for the lift and drag coefficients were calculated for 60, 70, and 80 mph (Table 2). The results for 70 mph are shown graphically in Figure 5.
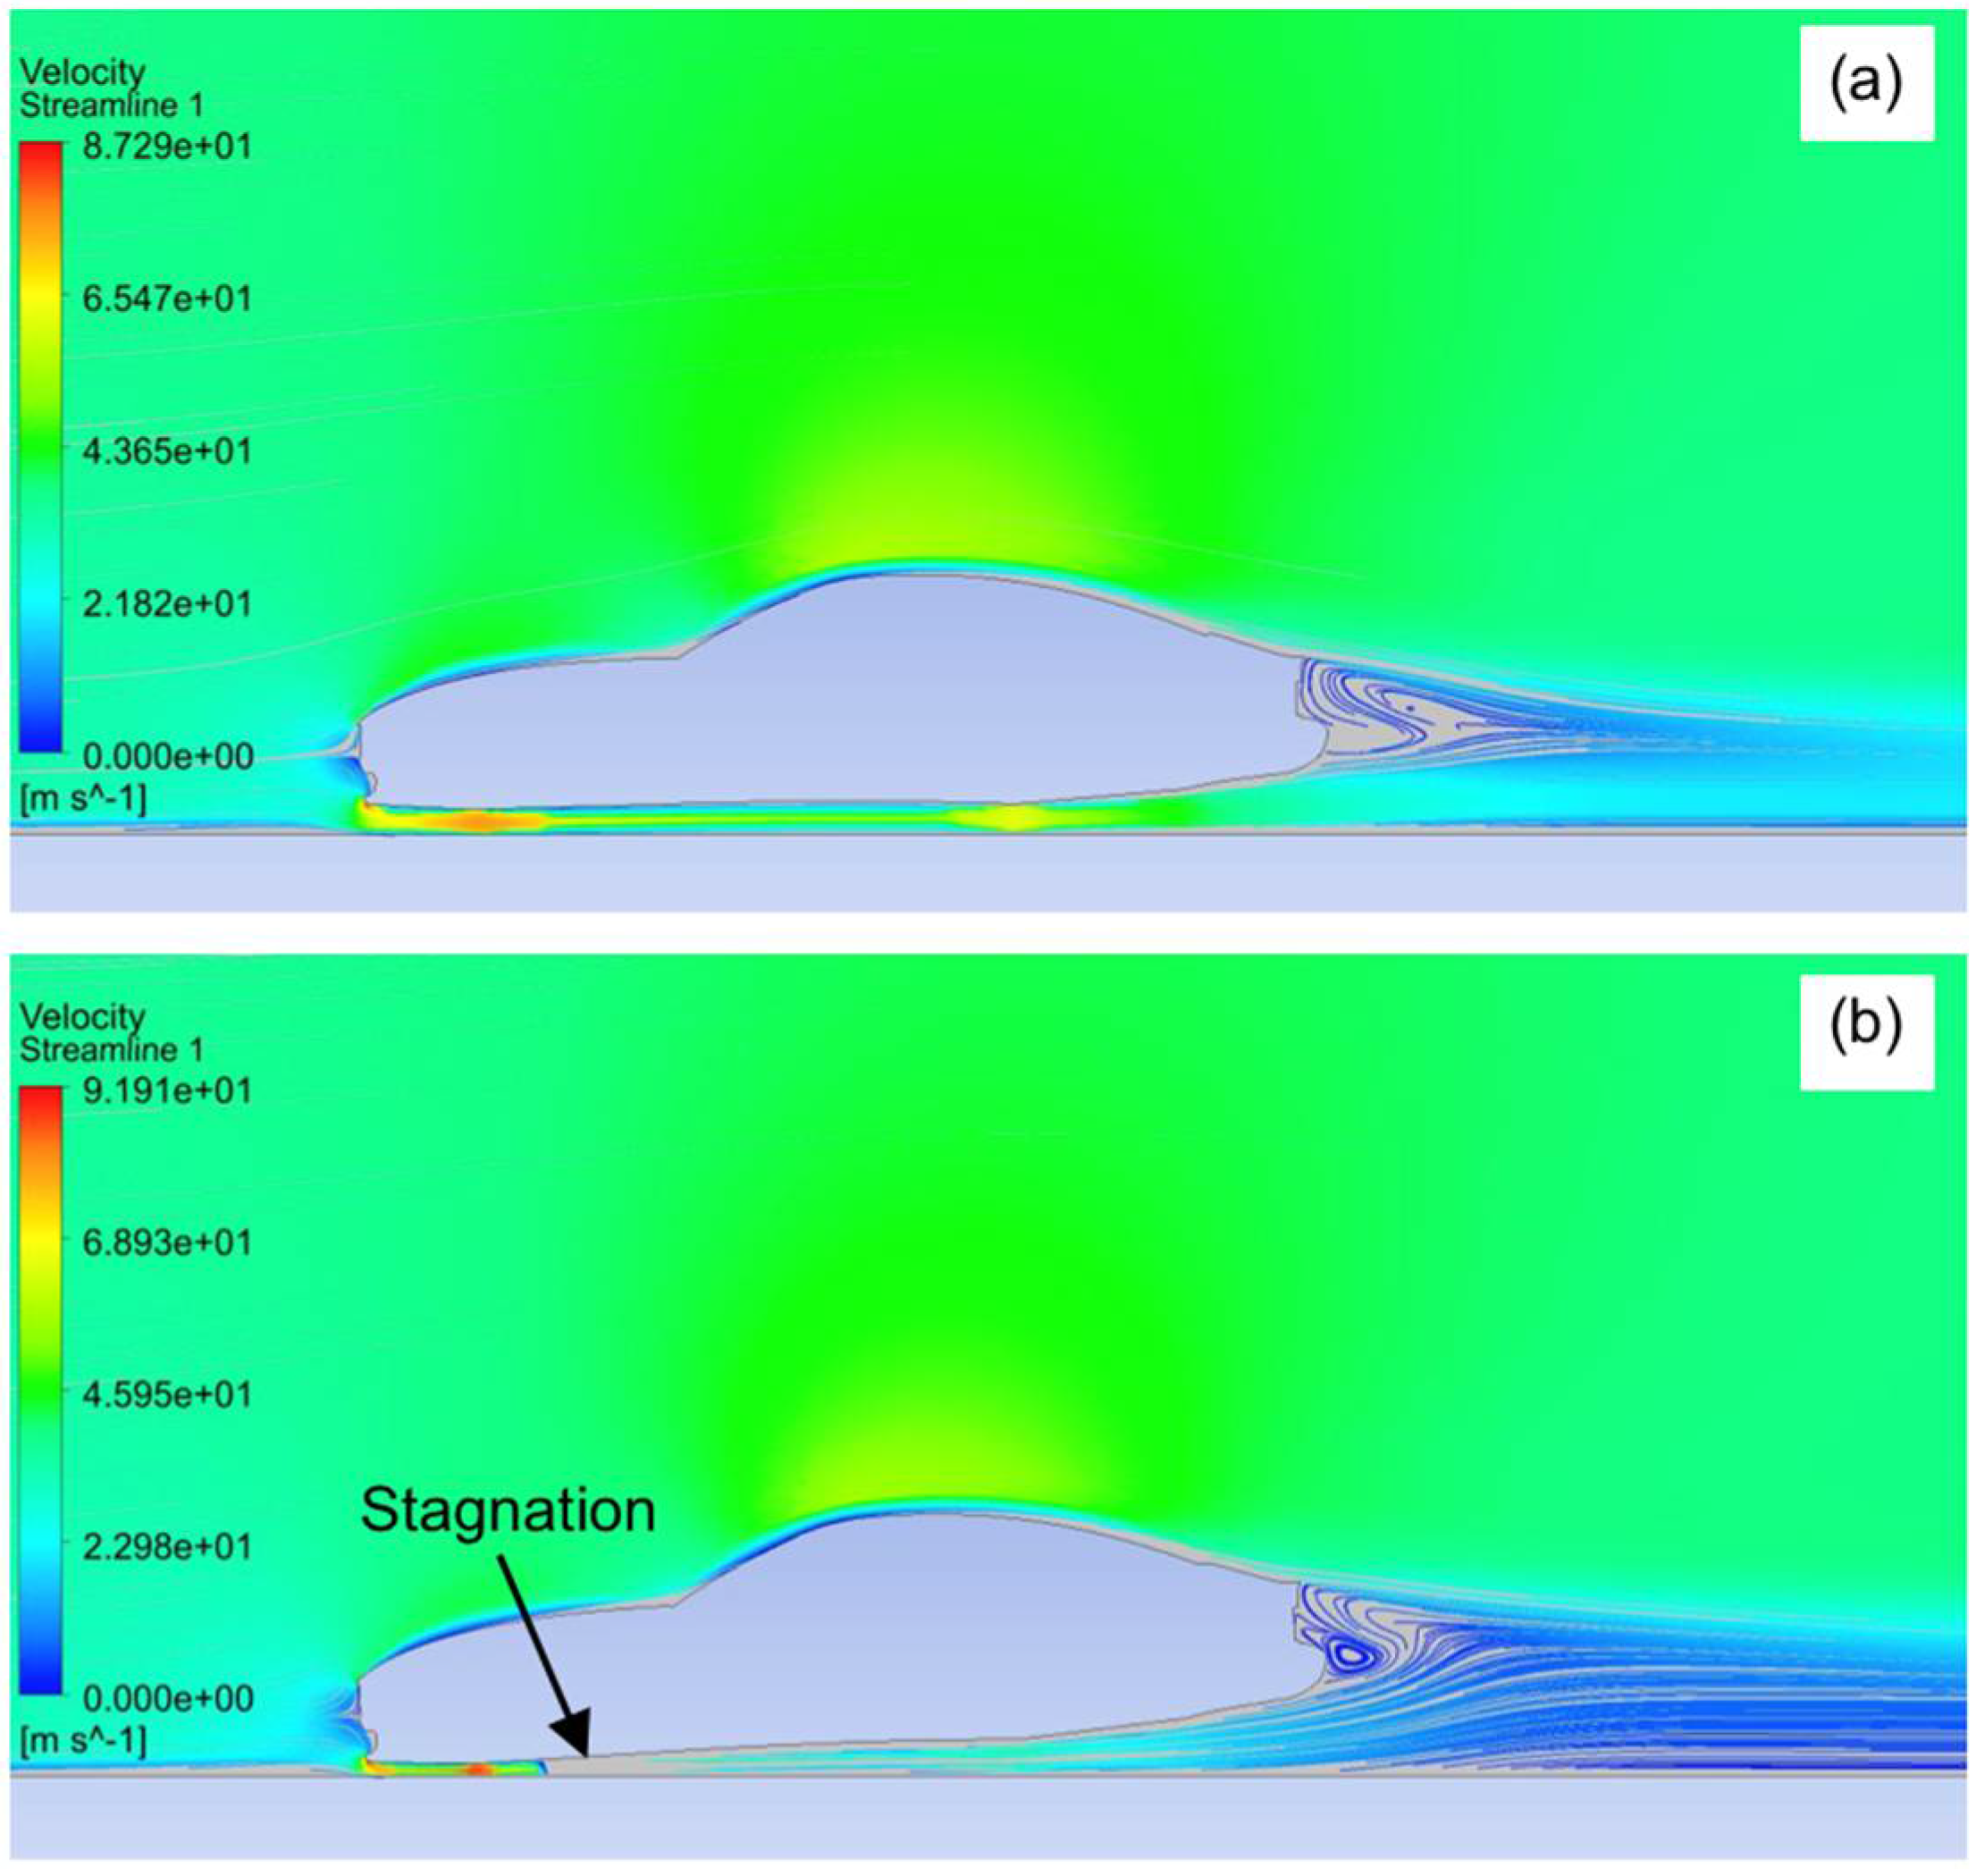
The estimated drag coefficient for the DB7 without any additional appendages was found to be ca. 0.43 at the stock rake of 0.44°, which is larger than the claimed value of 0.31 [27]; however, it provides a comparative value when considering aerodynamic alterations. From the results shown in Table 2 and Figure 5, there is a gradual (and near linear) increase in Cd as the rake angle increases, consistent with an increase in frontal area with increased rake. This trend follows other studies [28]; however, others have reported that a nosedive made little difference to the drag of the car [26], suggesting that the effect is very dependent on the body shape. The downforce (negative lift) also shows a general trend with increased rake of increased CL (i.e., decreased downforce) [26]. This is in contrast to the study of Katz and Garcia [28] that showed a gradual increase in downforce as the rake was increased; however, this was for an open-wheel Indy car. It is interesting to note that the calculated minimum for CL occurs at the stock rake. The flow structure that forms for the minimum and maximum rake angles studied (0° and 2.75°, respectively) are shown in Figure 6, illustrating the significant increase in turbulent air behind the car as the angle of attack increases. In addition, as the angle increases, the nose sits closer to the ground, resulting in a stagnation point (Figure 6b) creating positive lift, as shown in Figure 5.
Independent calculations based upon corner weights and suspension geometry indicate that optimum mechanical grip (when the lateral weight transfer is equal front-to-back) is obtained by increasing the rake of the DB7 from the stock value of 0.44° to 1.95°. This result suggests that optimization of rake for mechanical grip will result in a ca. 20% increase in Cd. Although in real terms this is countered by the increased exit speed from corners facilitated by increased traction, what is more of an issue is that the dramatic 106% decrease in downforce at 70 mph is close to the point that would create overall lift. The important outcome from the data in Table 2 is the relationship in which the reduced downforce of the increased rake will need to be overcome by additional aerodynamic components, e.g., a rear wing.
3.2. Rear Wing
The most logical add-on to a vehicle to increase downforce over the rear wheels is the inverted wing [29]. Motorsports UK regulation J.5.2.7 requires any aerodynamic device must not extend above the maximum height of the roof and must not extend the rear of the bodywork by more than 100 mm [15]. In most GT race cars, the position of a rear wing is located as high and as far back as possible (e.g., as seen in Figure 7), presumably to allow the wing to act in relatively clean air away from the bodywork. Downforce created by the rear wing relies a lot on its positioning. For the wing to be as effective and as efficient as it can, the flow around it needs to be as uniform as it can and where there is a high concentration of flow. Therefore, the horizontal and vertical positions were altered, as well as the angle of attack, within the regulations [15].
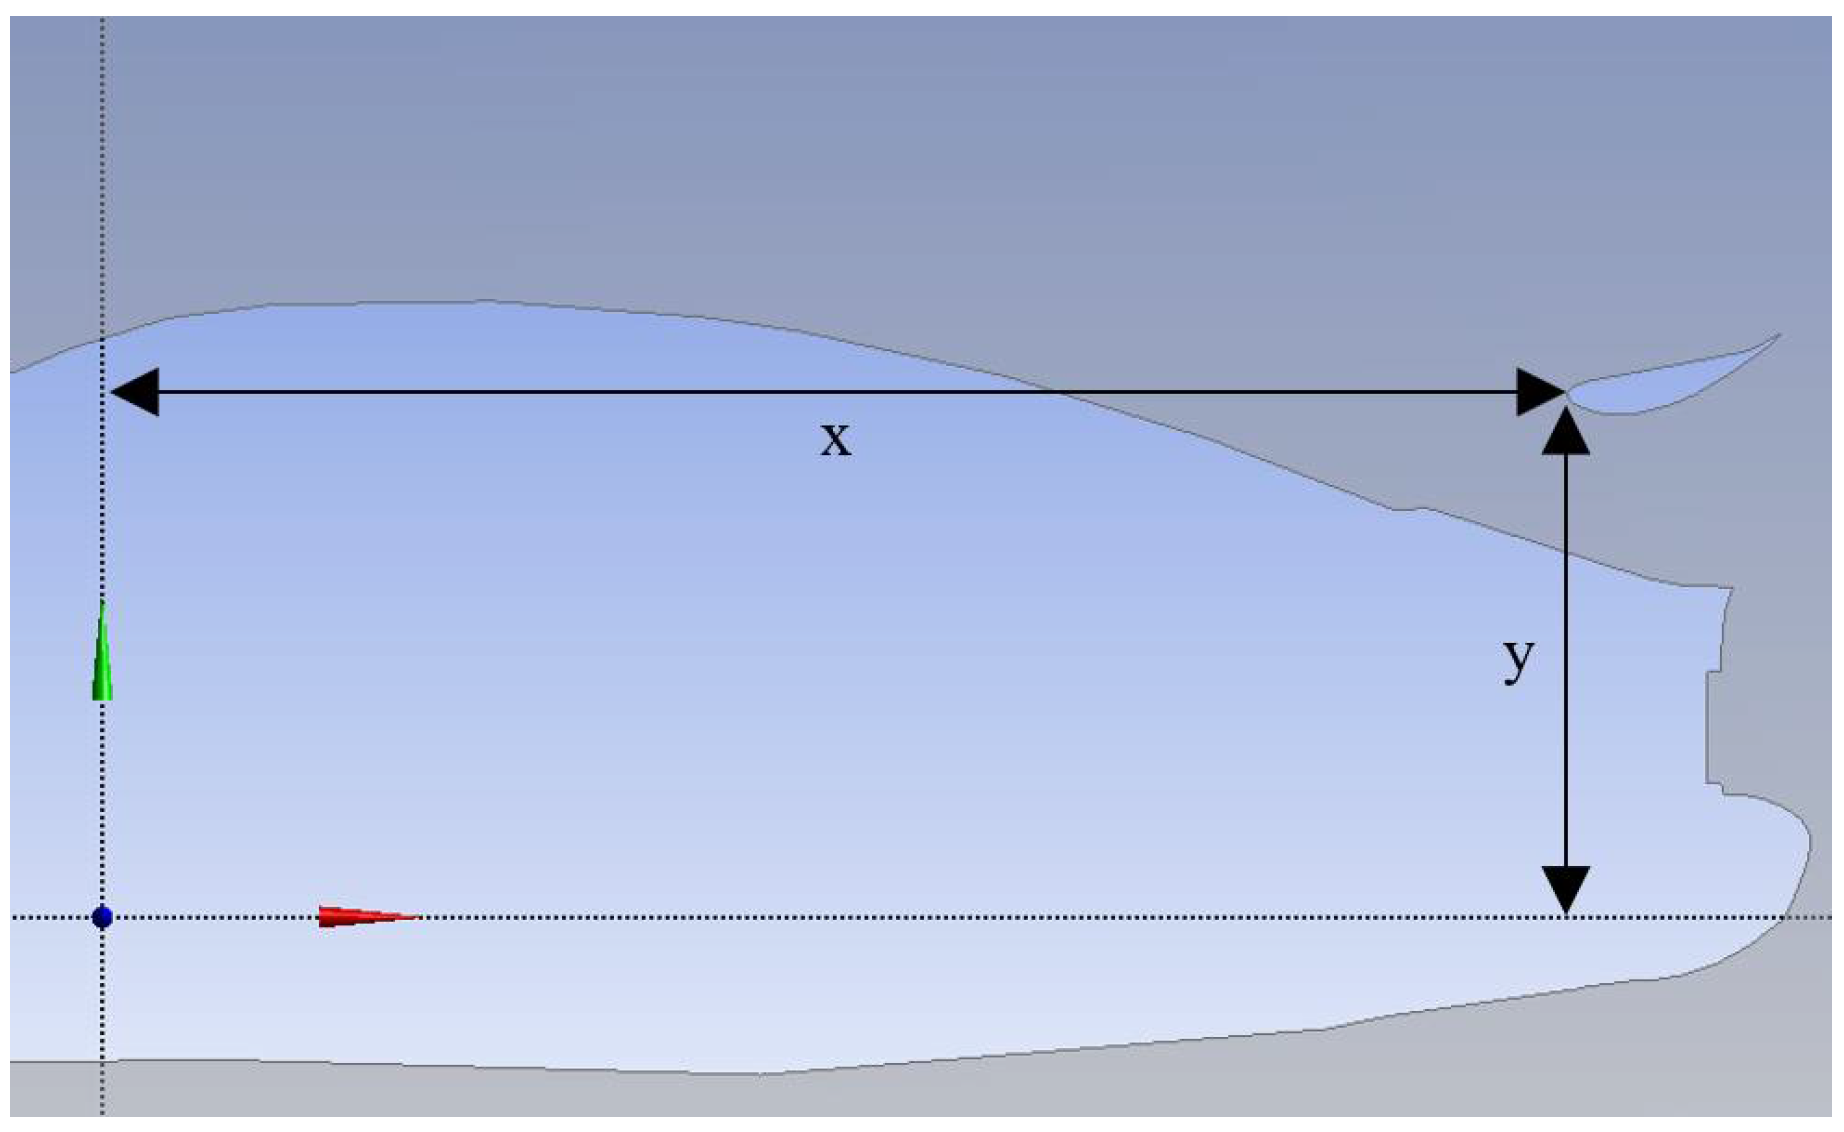
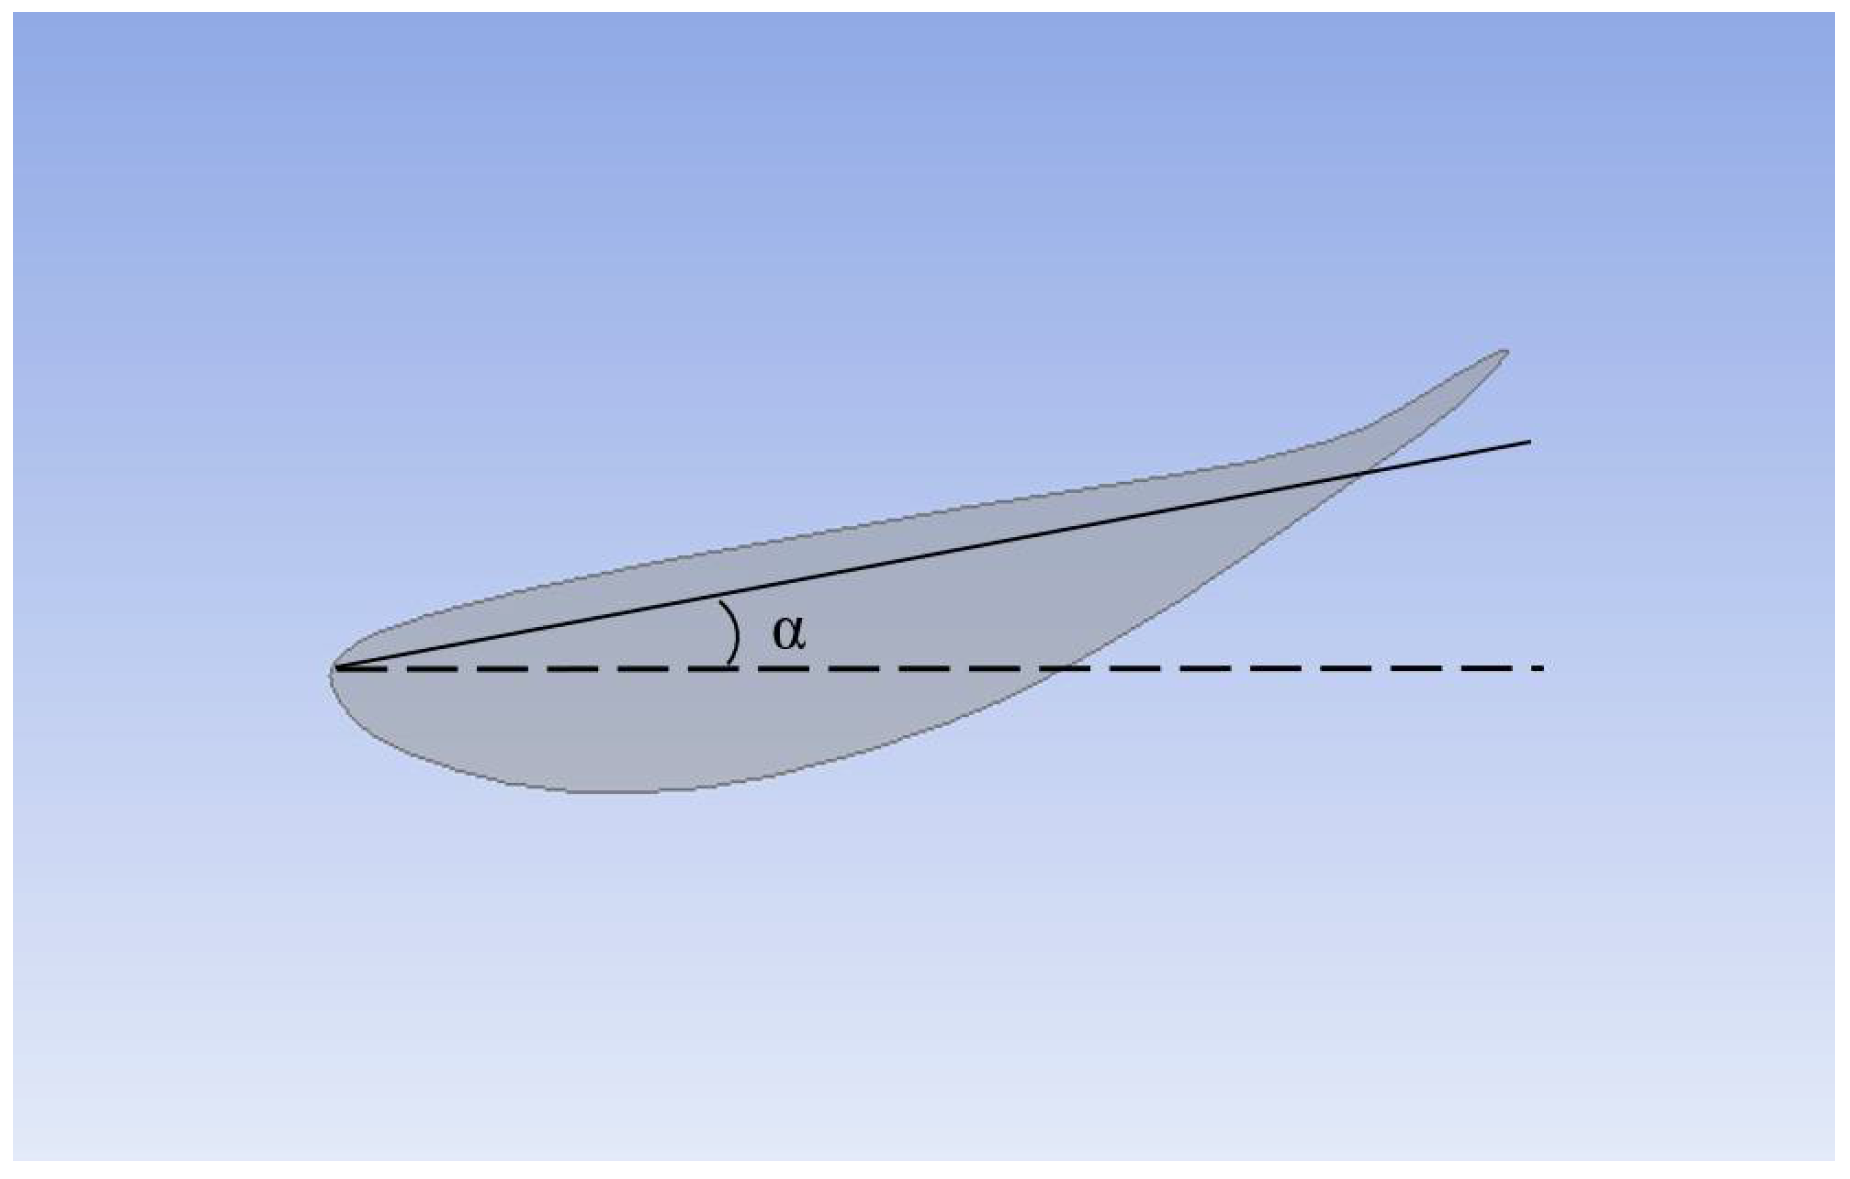
In the present case, with regard to the wing’s position on the car, all the measurements were taken from the origin in the center of the car, i.e., halfway between and on the axle centerline (see Figure 8). From the point of origin, the wing was initially fixed in a vertical position of 750 mm. From then, it was moved between 1600 and 2200 mm horizontally at 100 mm intervals. Subsequently, the wing height was varied (in 25 mm intervals) between the body of the car and roofline, which was between 650 and 775 mm from the centerline; above 775 mm would breach regulations [15]. When positioning the wing into the correct place, the wing was set at 10 degrees as this was the angle at which the supplier drilled the endplates; however, the angle of attack (α) was then varied between 0° and 20° by 2.5° steps (see Figure 9). As with previous experiments, the simulations were run at 60, 70, and 80 mph (Table 3, Table 4 and Table 5).
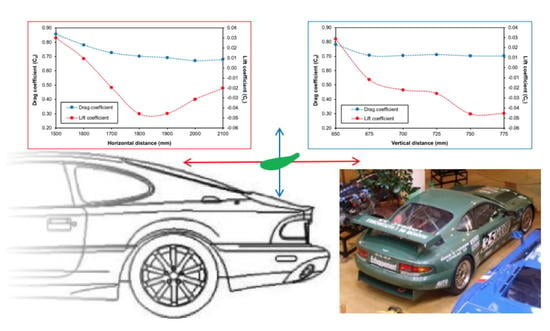
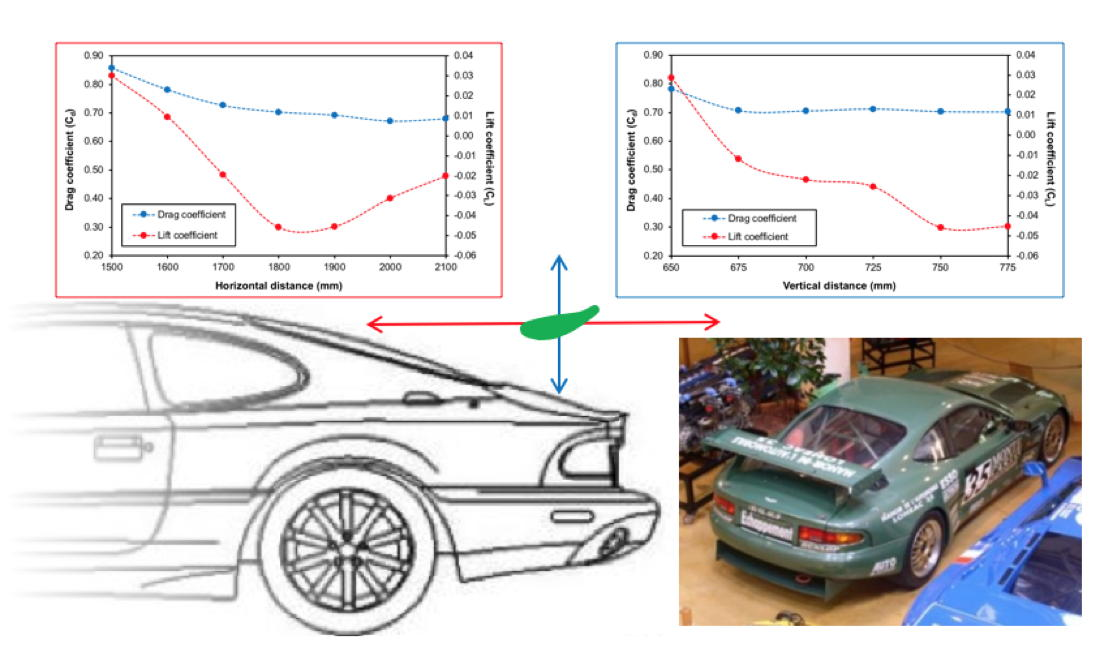
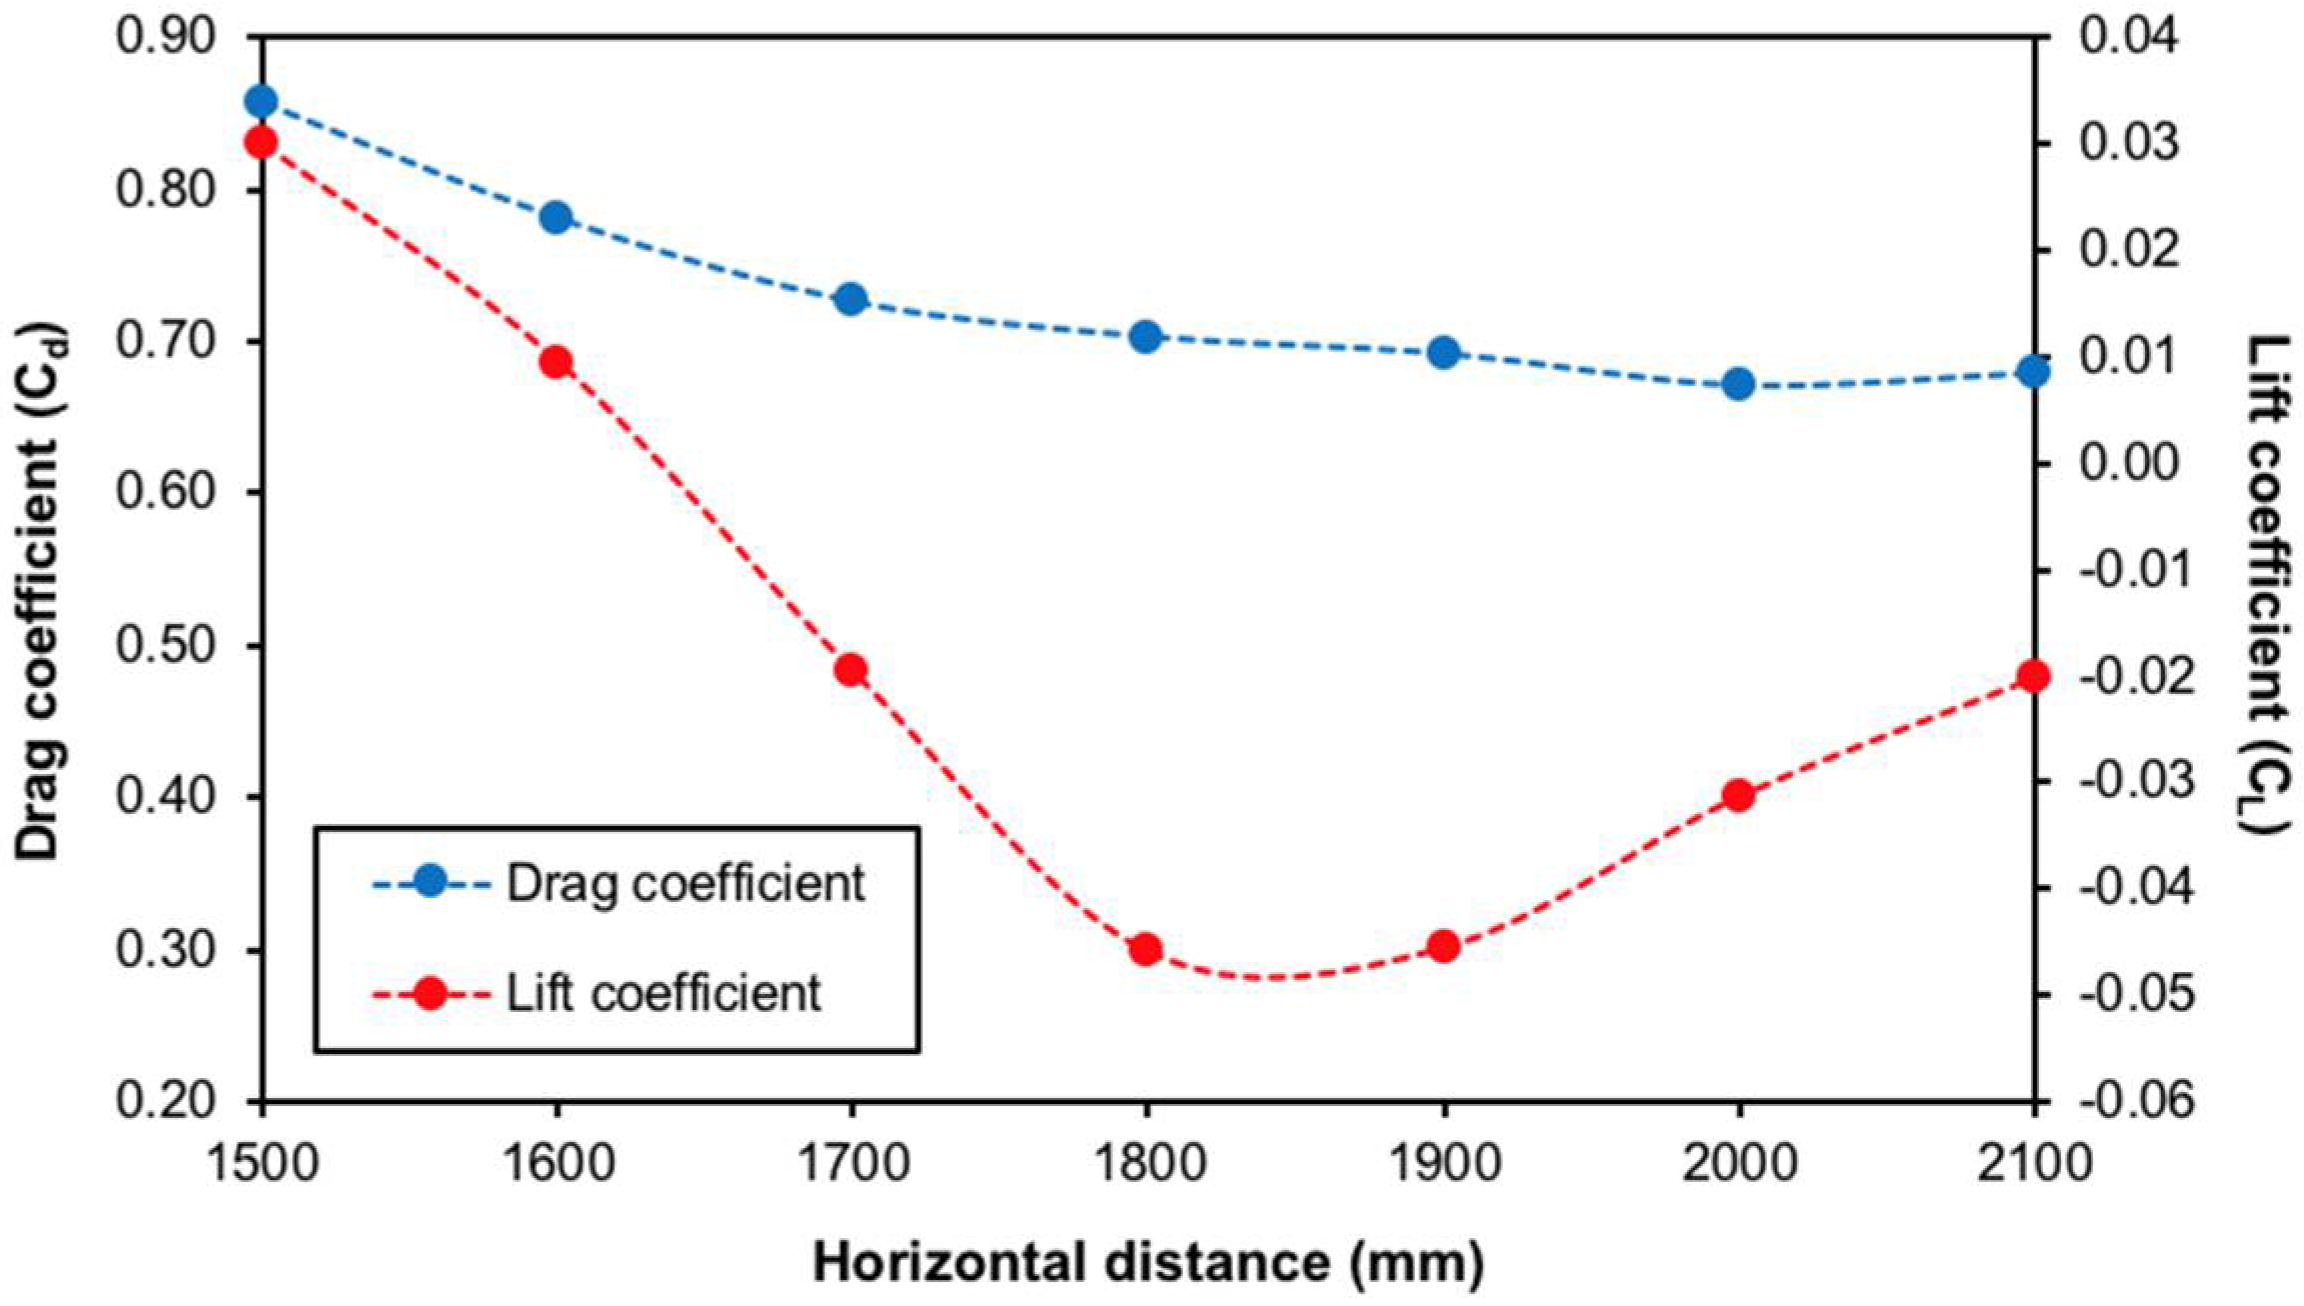
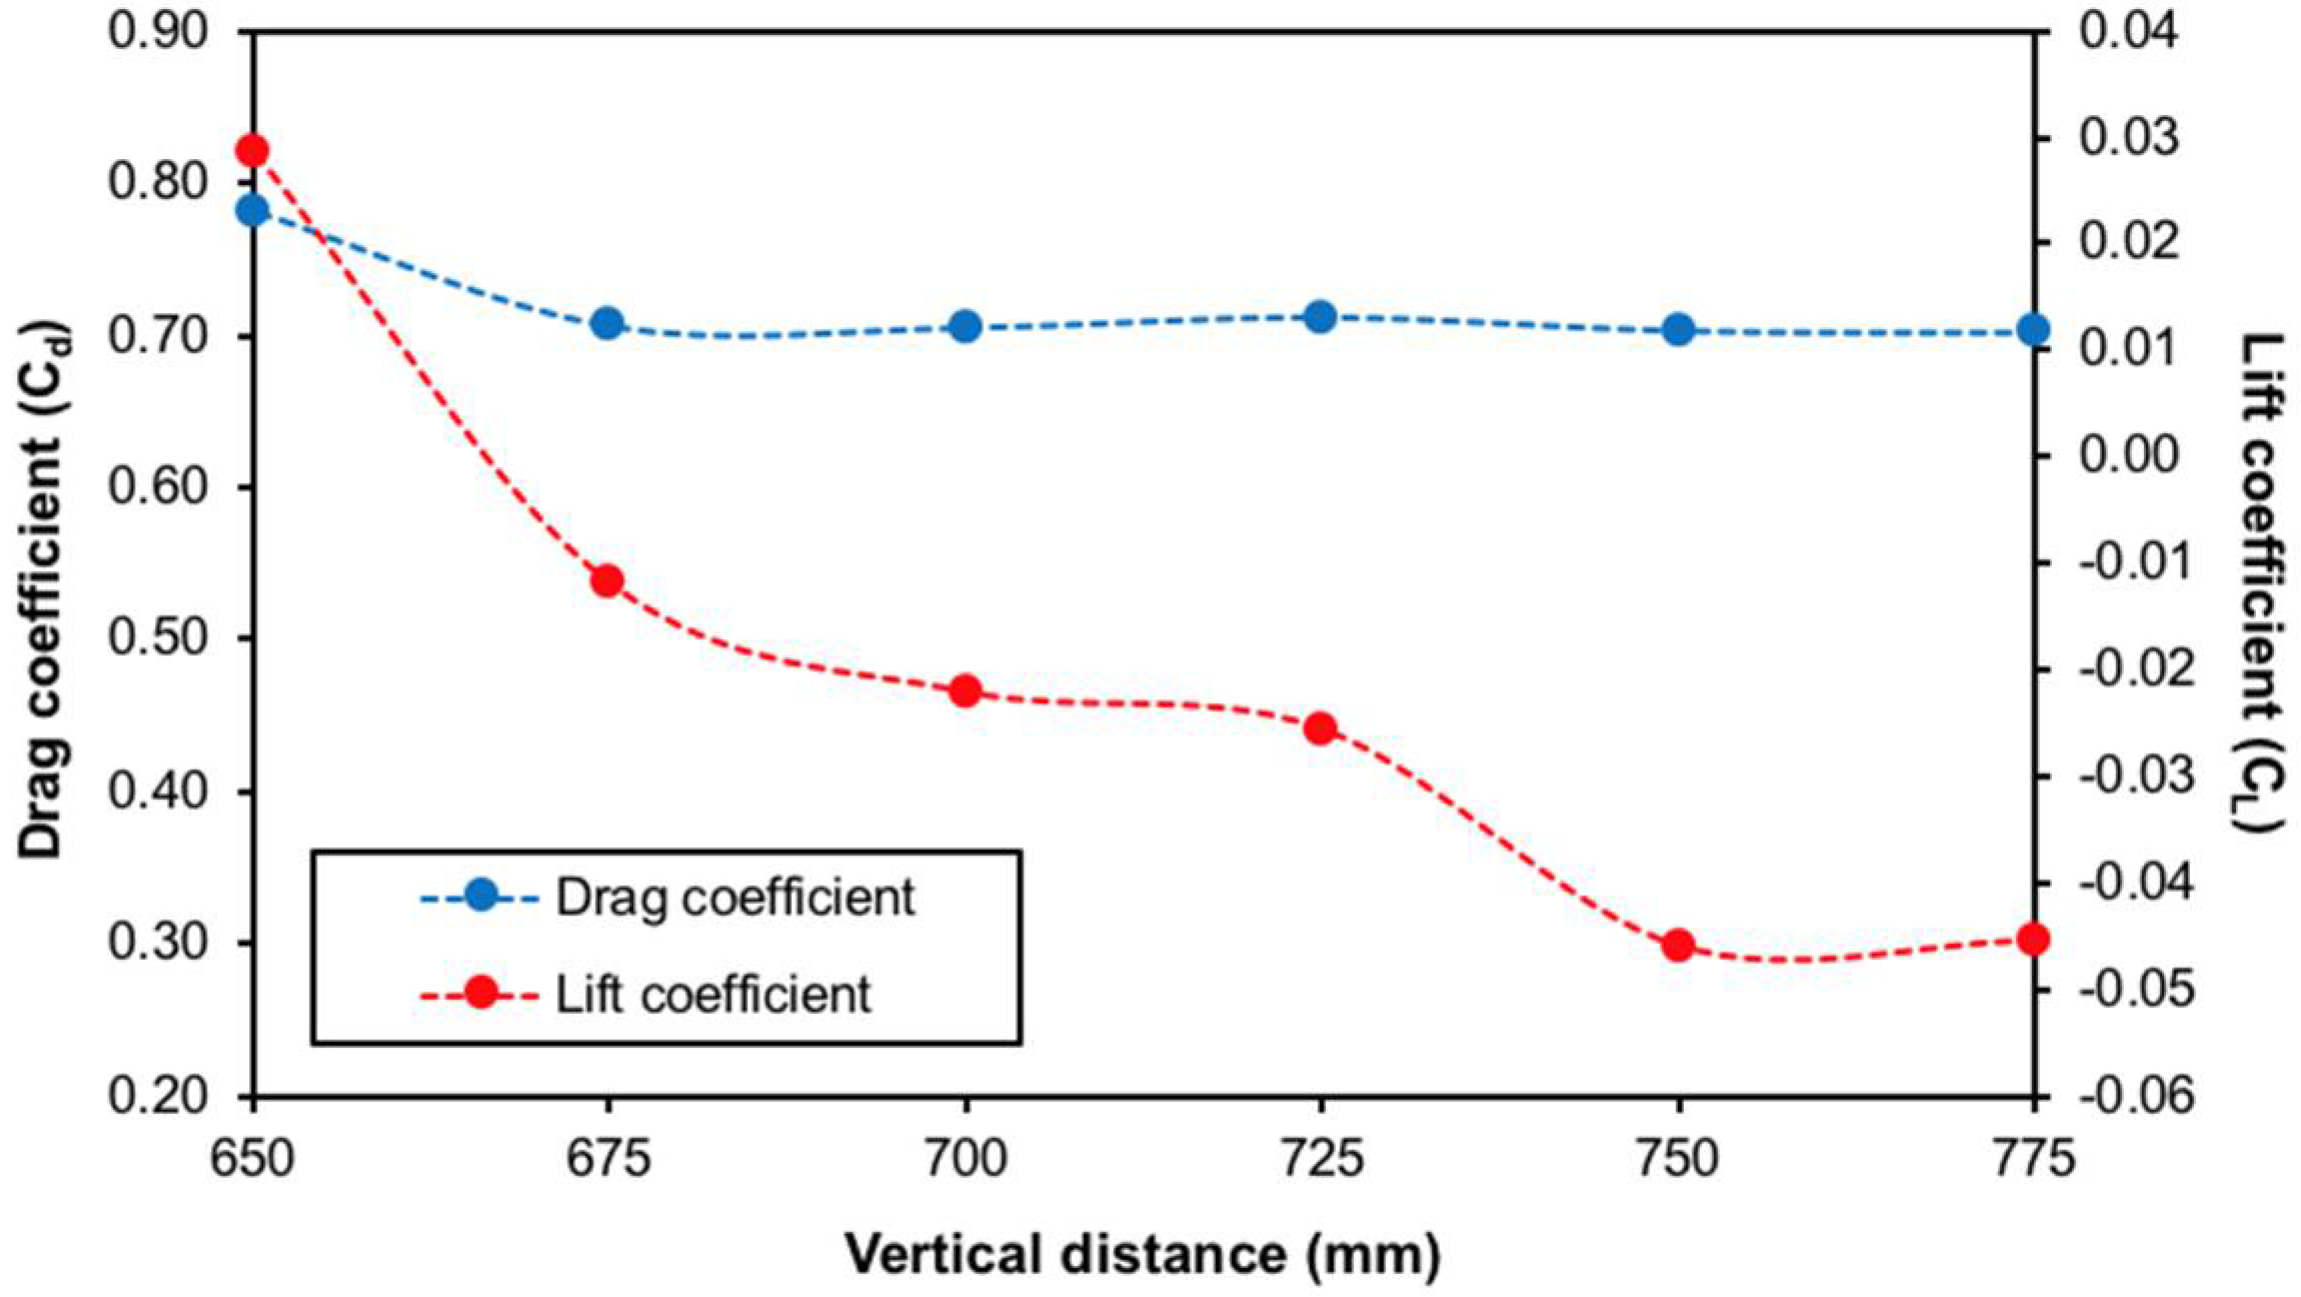
Figure 10 and Figure 11 show the results of lift and drag coefficients with changes in height and horizontal distance at 70 mph. As seen in Figure 10, the drag decreases the farther back the wing is located, but the lift has a distinct minimum when the wing is located ca. 1850 mm back from the center point of the car. Unusually, this is actually to the front of the boot/rear deck. The drag coefficient is relatively insensitive to the vertical location of the wing once it is greater than 675 mm above the centerline; however, the negative lift is maximized when the wing is at its highest point allowed by the regulations.
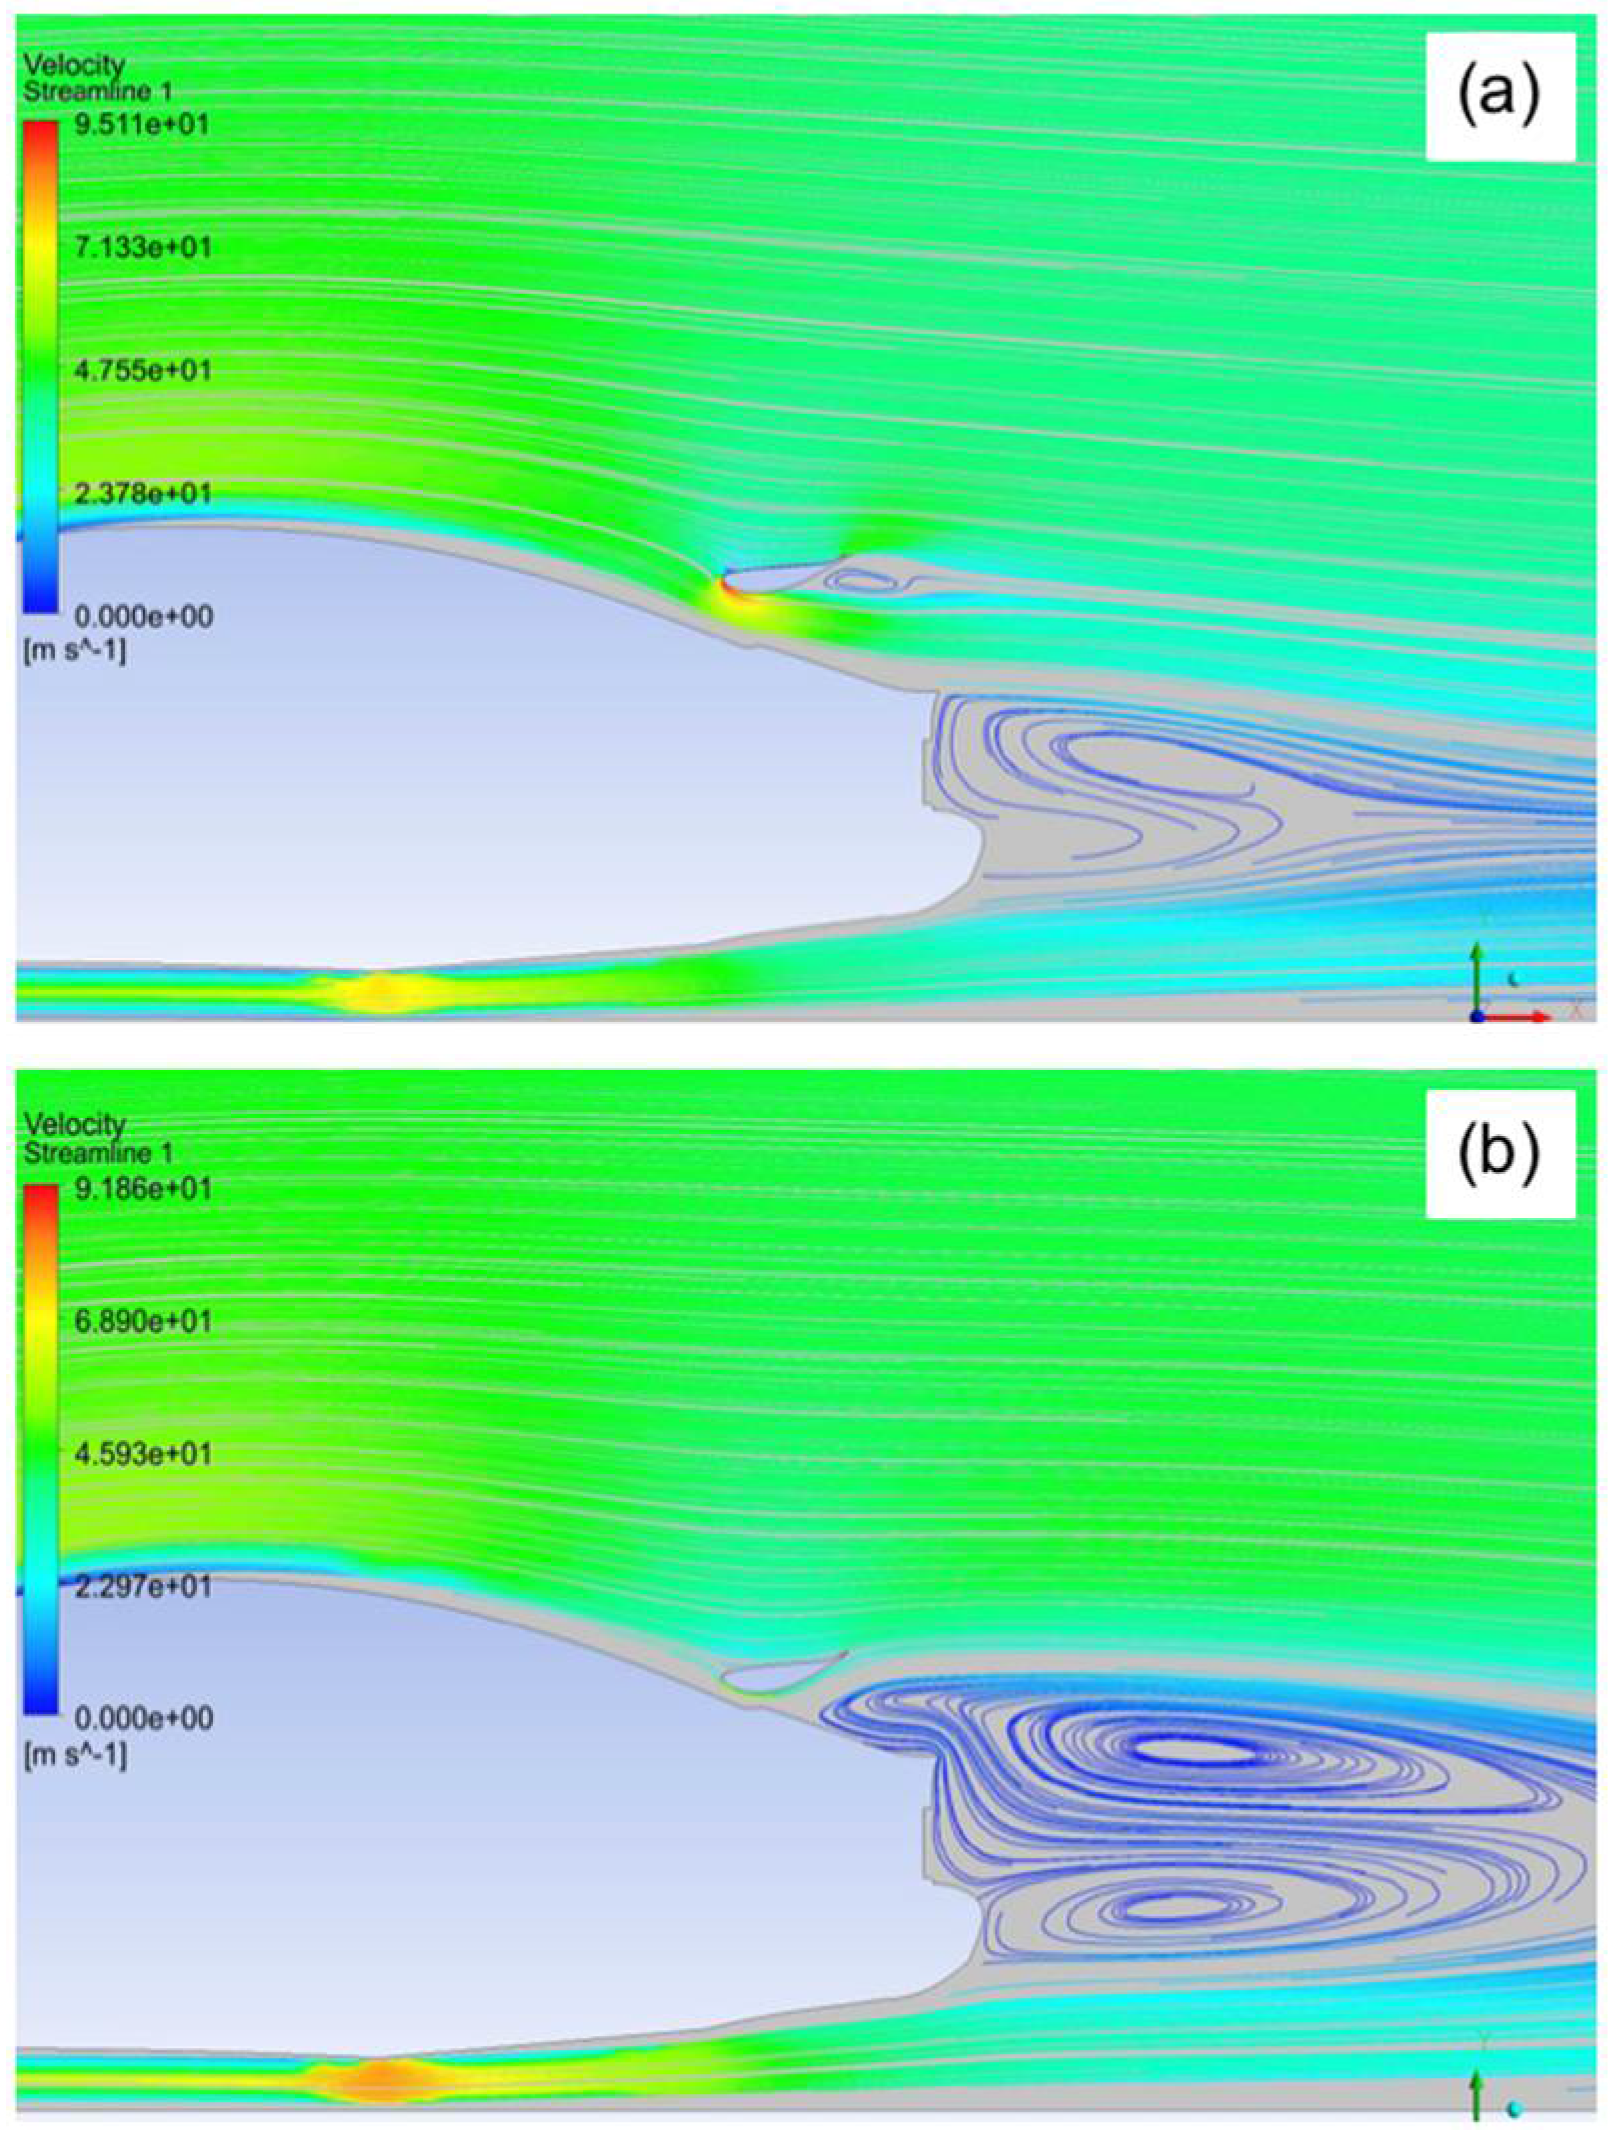
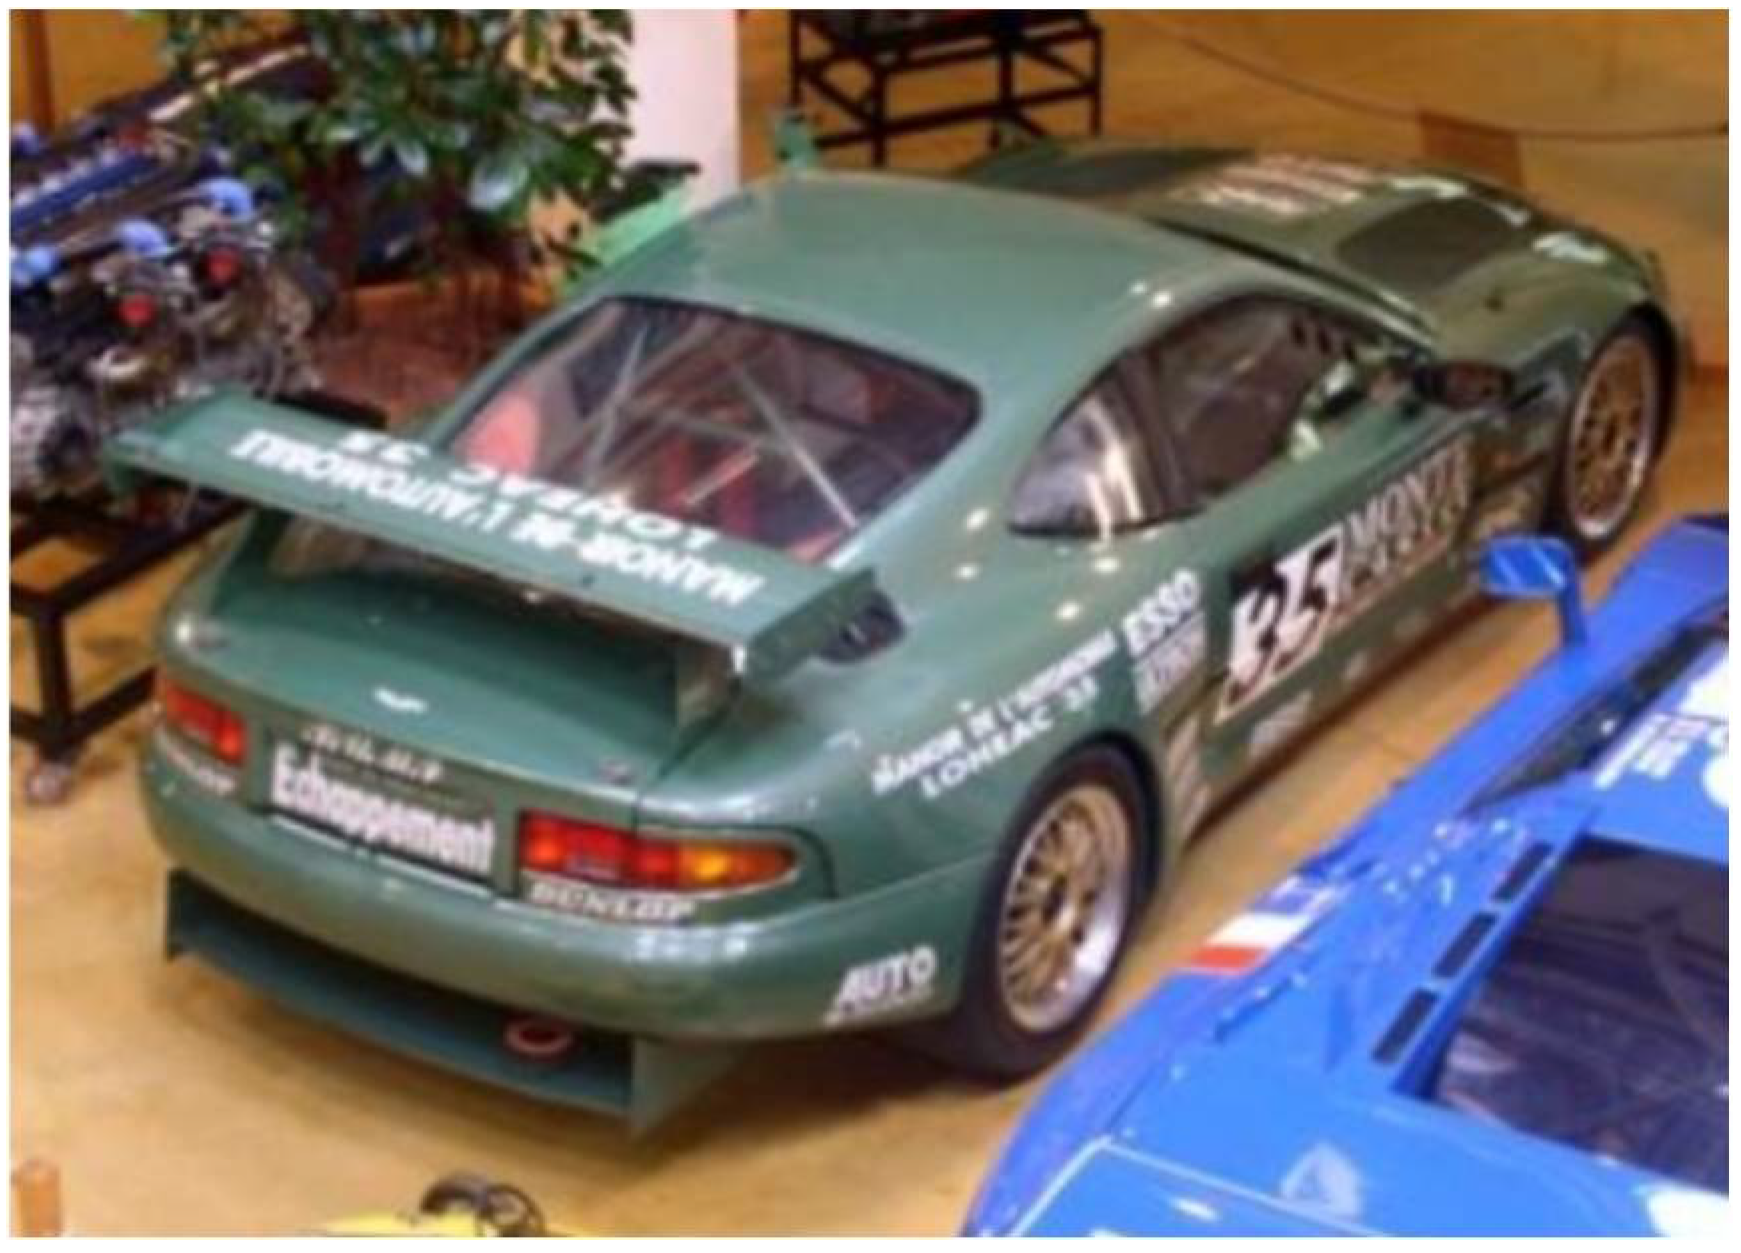
The flow structures that form as a result of the minimum and maximum vertical distances studied (650 and 750 mm, respectively) are shown in Figure 12, illustrating the loss of lift when the wing is too low (c.f., Figure 11). In addition, there is a significant turbulent region behind the car when the wing is at the lowest position. At the higher locations, the wing acts in concert with the rear window/boot lid to create significant downforce. Thus, the optimum position of the wing appears to be at the maximum height and positioned above where the rear windscreen met the boot hinge. This position is consistent with the location employed on the Aston Martin DB7 V8 GT1 car built for Le Mans (Figure 13).
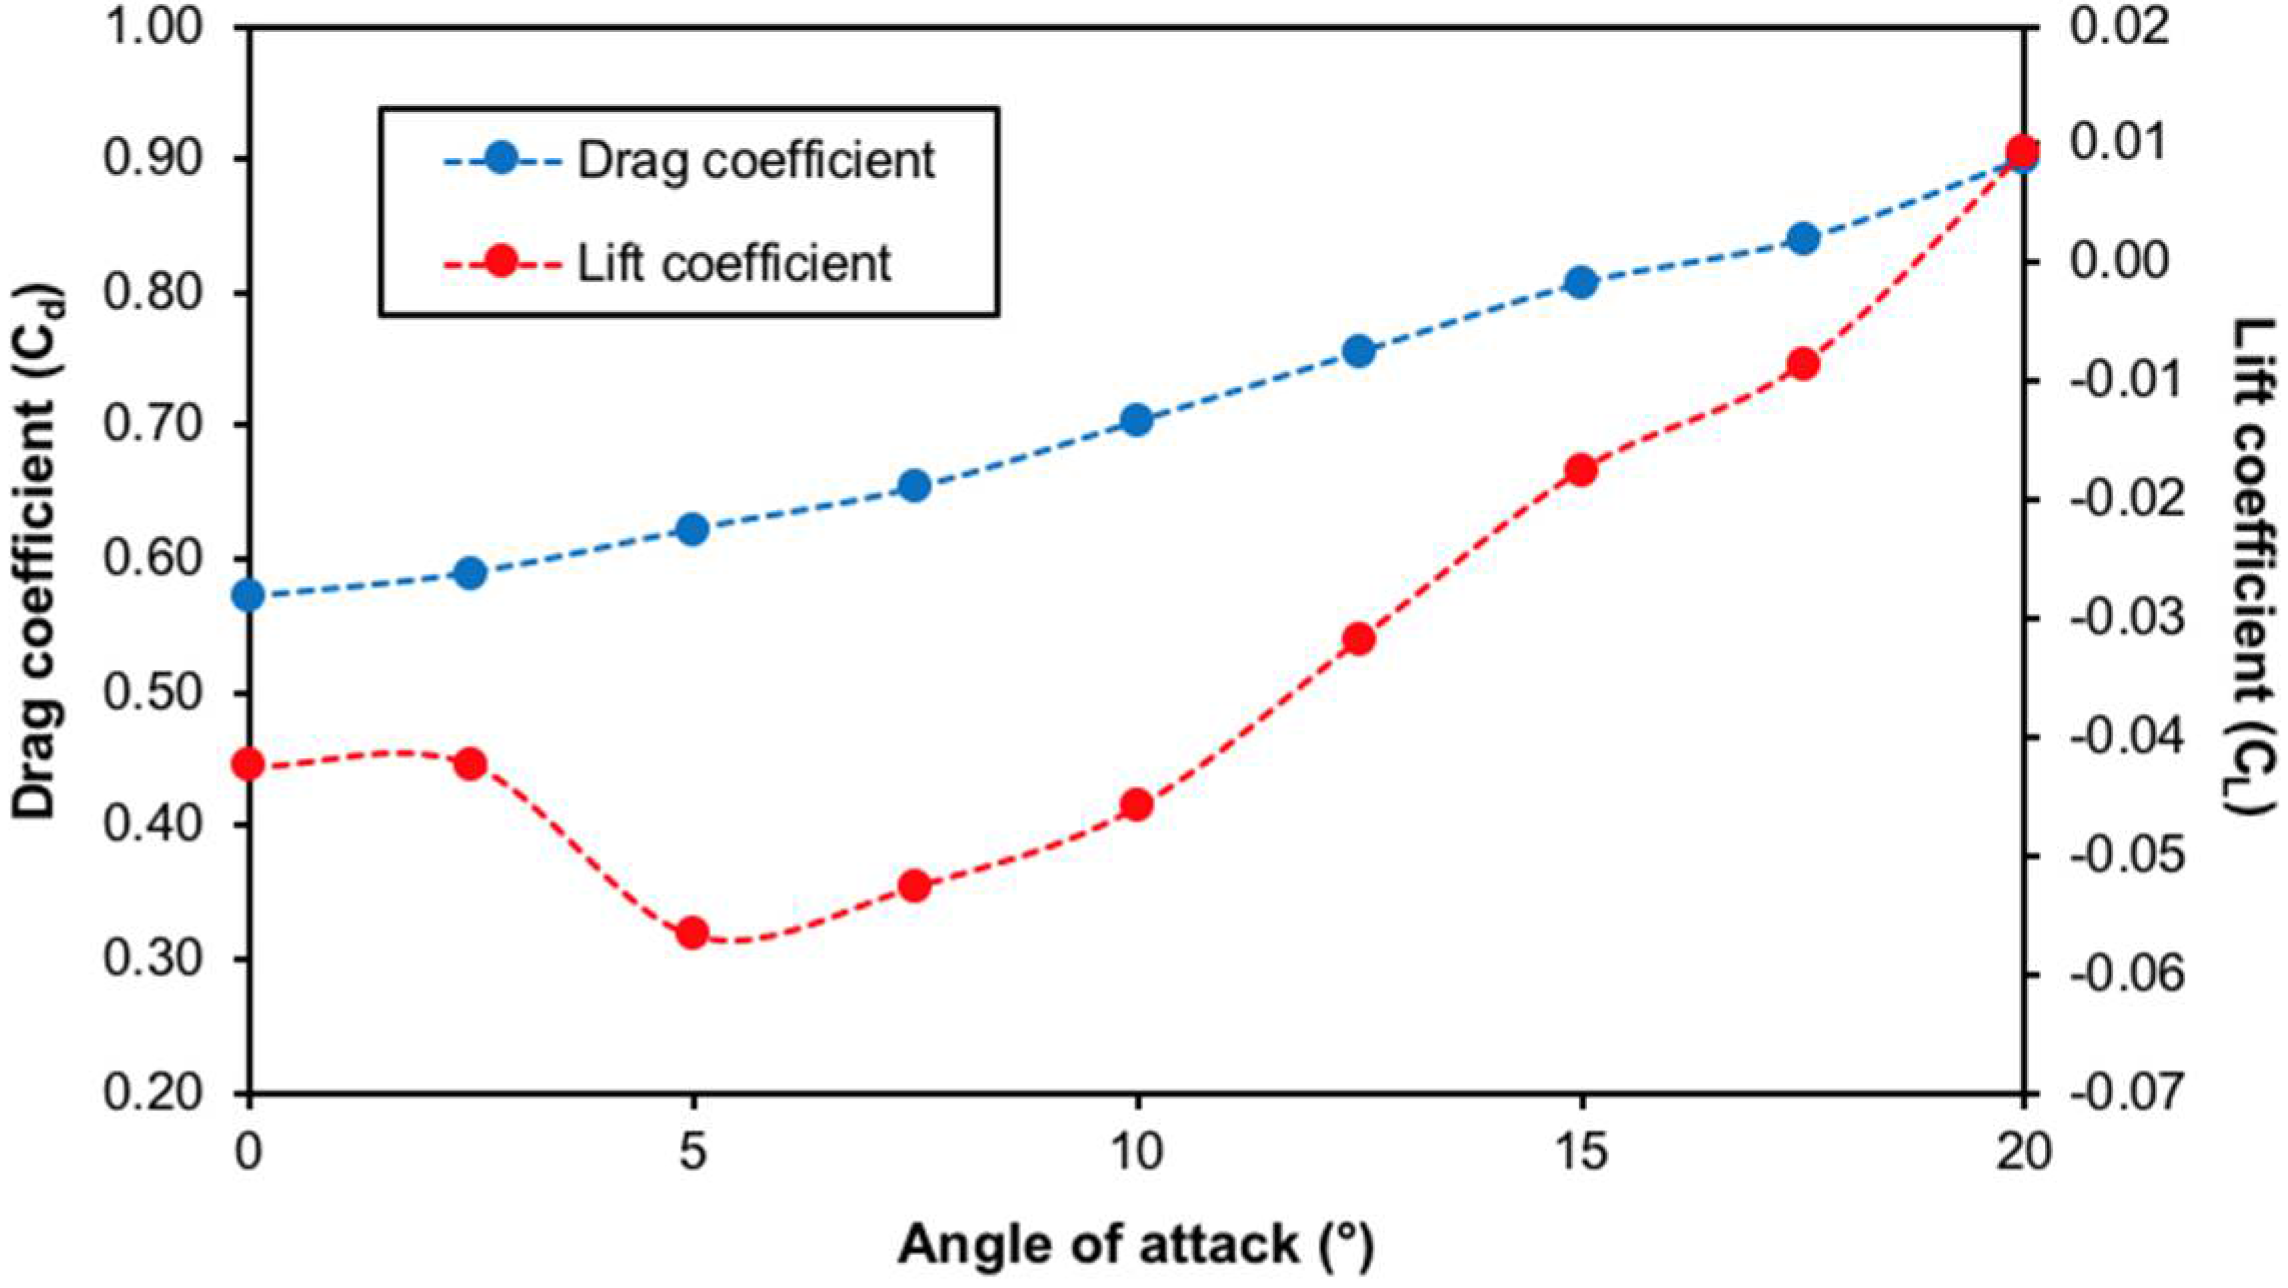
Figure 14 shows the effect of the attack angle of the rear wing once it is positioned 1800 mm back and 750 mm up from the set origin. As the angle of attack increased, so did the coefficient of drag, which was consistent throughout. The lift coefficient initially decreases, applying more downforce with increased angle of attack, and then at 5°, the negative lift is lost as the curve tips to less downforce with increased angle of attack. The rear wing had a positive overall impact on the aerodynamics of the Aston Martin DB7. It would supply a sufficient amount of downforce to the rear of the car to improve power transmission to the road.
4. Conclusions
The simulations undertaken herein suggested that the desired configuration for the rear wing would have it positioned 1800 mm back and 750 mm up from the set origin, with an attack angle of 5°. The position of the wing is remarkably similar to where Aston Martin set the rear wing on their Le Mans car in 1995, above where the rear windscreen met the boot hinge (see Figure 13). In fact, it is worth noting that the similarities of our calculated positions of the wing are both remarkably similar to those that were chosen based upon wind tunnel studies using a scale model. This suggests that our 2D simulations provide a good starting point for practical installation and subsequent on-track optimization (Figure 15). Thus, as a first approximation, it appears that 2D simulations of these types can provide low costs, fast simulation time, and a route for club motorsports, unlike complex 3D simulation and wind tunnel experimentation.
We note, however, that there are several limitations to the results obtained. First, as stated, this is a 2D model, which is a clear simplification when compared to a full 3D model, and thus, the Cd and CL values will not be exact compared to the full-size automobile. Second, as this is a 2D simulation, the results only apply to about 80% of the car, as the software does not account for the flow down the sides. Third, the calculations also make assumptions that the car has a flat bottom, which it does not, and thus, the under-car flow will be significantly more turbulent. Fourth, there could be some variation in the results that would depend on the chosen turbulent model. Nevertheless, as stated, the goal was to obtain relative values to guide the installation of a wing on the real car.
Author Contributions
Conceptualization, A.R.B.; methodology, T.P.O. and A.R.B.; formal analysis, T.P.O. and A.R.B.; investigation, T.P.O.; resources, A.R.B.; writing—original draft preparation, T.P.O.; writing—review and editing, T.P.O. and A.R.B.; visualization, T.P.O.; supervision, A.R.B.; project administration, A.R.B.; funding acquisition, A.R.B. All authors have read and agreed to the published version of the manuscript.
Funding
This research received no external funding.
Data Availability Statement
The data presented in this study are available on request from the corresponding author. The data are not publicly available due to privacy reasons.
Acknowledgments
The authors acknowledge the assistance of James Simons (SBR Motorsports, UK) in providing technical information.
Conflicts of Interest
References
- Katz, J. Race Car Aerodynamics, 2nd ed.; Bentley Publishers: Cambridge, UK, 1995. [Google Scholar]
- Wang, J.; Li, H.; Liu, Y.; Liu, T.; Gao, H. Aerodynamic research of a racing car based on wind tunnel test and computational fluid dynamics, The 4th International Conference on Mechatronics and Mechanical Engineering (ICMME 2017). In MATEC Web of Conferences; EDP Sciences: Les Ulis, France, 2018; Volume 153, p. 04011. [Google Scholar]
- Sudin, M.N.; Abdullah, M.A.; Shamsuddin, S.A.; Ramli, F.R.; Tahir, M.M. Review of research on vehicles aerodynamic drag reduction methods. Int. J. Mech. Mechatron. Eng. 2014, 14, 35–47. [Google Scholar]
- Iljaž, J.; Škerget, L.; Štrakl, M.; Marn, J. Optimization of SAE formula rear wing. J. Mech. Eng. 2016, 62, 263–272. [Google Scholar] [CrossRef] [Green Version]
- Hetawal, S.; Gophane, M.; Ajay, B.K.; Mukkamala, Y. Aerodynamic study of formula SAE car. Procedia Eng. 2014, 97, 1198–1207. [Google Scholar] [CrossRef] [Green Version]
- Mariani, F.; Poggiani, C.; Risi, F.; Scappaticci, L. Formula-SAE racing car: Experimental and numerical analysis of the external aerodynamics. Energy Procedia 2015, 81, 1013–1029. [Google Scholar] [CrossRef] [Green Version]
- Doddegowda, P.; Bychkovsky, A.; George, A. Use of computational fluid dynamics for the design of formula SAE race car aerodynamics. In Proceedings of the 2006 SAE World Congress, Detroit, MI, USA, 3–6 April 2006. SAE Technical Paper 2006-01-0807. [Google Scholar]
- Basso, M.; Cravero, C.; Marsano, D. Aerodynamic Effect of the Gurney flap on the front wing of a F1 car and flow interactions with car components. Energies 2021, 14, 2059. [Google Scholar] [CrossRef]
- Fernandez-Gamiz, U.; Gomez-Mármol, M.; Chacón-Rebollo, T. Computational modeling of Gurney flaps and microtabs by POD method. Energies 2018, 11, 2091. [Google Scholar] [CrossRef] [Green Version]
- Damjanović, D.; Kozak, D.; Zivić, M.; Ivandić, Ž.; Baškarić, T. CFD analysis of concept car in order to improve aerodynamics. Járműipari Innováció 2011, 1, 108–115. [Google Scholar]
- Desai, M.; Channiwala, S.A.; Nagarsheth, H.J. Experimental and computational aerodynamic investigations of a car. WSEAS Trans. Fluid Mech. 2008, 3, 359–368. [Google Scholar]
- 2021 Liqui Moly New Millennium Series Regulations. Available online: https://68403ce7-faa5-44b9-9ba0-313b6d9859a7.filesusr.com/ugd/838e83_395634b45f2a41db8bf84de5f74a3920.pdf (accessed on 26 August 2021).
- Classic & Historic Thunder Saloons 2021 Championship Regs. Available online: https://classictouringcars.com/wp-content/uploads/2021/02/2021-CTCRC-Classic-Thunder-Regs.pdf (accessed on 26 August 2021).
- Reglement 2021 Trophee GT Classic. Available online: https://www.hvmracing.fr/wp-content/uploads/2021/01/Reglement-GT-Classic-2021-complet-def-avec-Visa.pdf (accessed on 26 August 2021).
- Competitors: Vehicles. Available online: https://www.motorsportuk.org/wp-content/uploads/2020/12/2021-03-08-motorsport-uk-yearbook-2021-p145-164-common-regulations-competitors-vehicles-j.pdf (accessed on 26 August 2021).
- Hu, X.; Zhang, R.; Ye, J.; Xu, Y.; Zhao, Z. Influence of different diffuser angle on Sedan’s aerodynamic characteristics. Phys. Procedia 2011, 22, 239–245. [Google Scholar] [CrossRef] [Green Version]
- Which Turbulence Model Should I Choose for My CFD Application? Available online: https://uk.comsol.com/blogs/which-turbulence-model-should-choose-cfd-application/ (accessed on 23 October 2019).
- Rajamani, G. CFD Analysis of Air Flow Interactions in Vehicle Platoons. SoA, Mechanical and Manufacturing Engineering RMIT University. 2006. Available online: https://core.ac.uk/download/pdf/15615017.pdf (accessed on 15 May 2022).
- Singh, R. CFD simulation of NASCAR racing car aerodynamics. In Proceedings of the SAE World Congress & Exhibition, Detroit, MI, USA, 14–17 April 2008. SAE Technical Paper. [Google Scholar] [CrossRef]
- Choosing the Right Turbulence Model for Your CFD Simulation. Available online: https://www.engineering.com/DesignSoftware/DesignSoftwareArticles/ArticleID/13743/Choosing-the-Right-Turbulence-Model-for-Your-CFD-Simulation.aspx (accessed on 15 April 2020).
- Cavcar, M. The International Standard Atmosphere (ISA); Anadolu University: Eskişehir, Turkey, 2000. [Google Scholar]
- Bhattacharjee, S.; Arora, B.; Kashyap, V. Optimization of race car front splitter placement using CFD. In Proceedings of the SAE World Congress & Exhibition, Detroit, MI, USA, 9–11 April 2019. SAE Technical Paper. [Google Scholar] [CrossRef]
- Cakir, M. CFD Study on Aerodynamic Effects of a Rear Wing/Spoiler on a Passenger Vehicle; MSc; Santa Clara University: Santa Clara, CA, USA, 2012. [Google Scholar]
- Full-Scale Aerodynamic Wind Tunnel. Available online: https://www.horiba-mira.com/facilities/full-scale-aerodynamic-wind-tunnel/ (accessed on 26 August 2021).
- Aston Martin DB7 Vantage: Ongoing project details. Available online: https://www.arbmotorsports.com/aston-martin-db7 (accessed on 2 April 2022).
- Džijan, I.; Pašić, A.; Buljac, A.; Kozmar, H. Aerodynamic forces acting on a race car for various ground clearances and rake angles. J. Appl. Fluid Mech. 2019, 12, 361–368. [Google Scholar] [CrossRef]
- Dowsey, D. DB7 DB Legend Revived. In Aston Martin Power Beauty and Soul, 2nd ed.; The Images Publishing Group: Victoria, Australia, 2019; pp. 124–133. [Google Scholar]
- Katz, J.; Garcia, D. Aerodynamic effects of Indy car components. SAE Trans. 2002, 111, 2322–2330. [Google Scholar]
- Nath, D.S.; Pujari, P.C.; Jain, A.; Rastogi, V. Drag reduction by application of aerodynamic devices in a race car. Adv. Aerodyn. 2021, 3, 4. [Google Scholar] [CrossRef]
Figure 1.
Photograph of the Aston Martin DB7 Vantage used in the present study.

Figure 2.
Blueprint of the Aston Martin DB7 Vantage used in the present study. All measurements are in mm. Copyright: www.the-blueprints.com (accessed on 15 October 2019).
Figure 2.
Blueprint of the Aston Martin DB7 Vantage used in the present study. All measurements are in mm. Copyright: www.the-blueprints.com (accessed on 15 October 2019).

Figure 3.
Diagram of the 2D computational domain size and mesh generated.

Figure 4.
Schematic of the dimensions of the GT4 wing employed in the study.

Figure 5.
Plot of drag coefficient (Cd) and lift coefficient (CL) as a function of chassis rake angle (°) for an Aston Martin DB7 at 70 mph.
Figure 5.
Plot of drag coefficient (Cd) and lift coefficient (CL) as a function of chassis rake angle (°) for an Aston Martin DB7 at 70 mph.

Figure 6.
Comparison of the streamlines around the Aston Martin DB7 with a rake angle of (a) 0° and (b) 2.75°.
Figure 6.
Comparison of the streamlines around the Aston Martin DB7 with a rake angle of (a) 0° and (b) 2.75°.

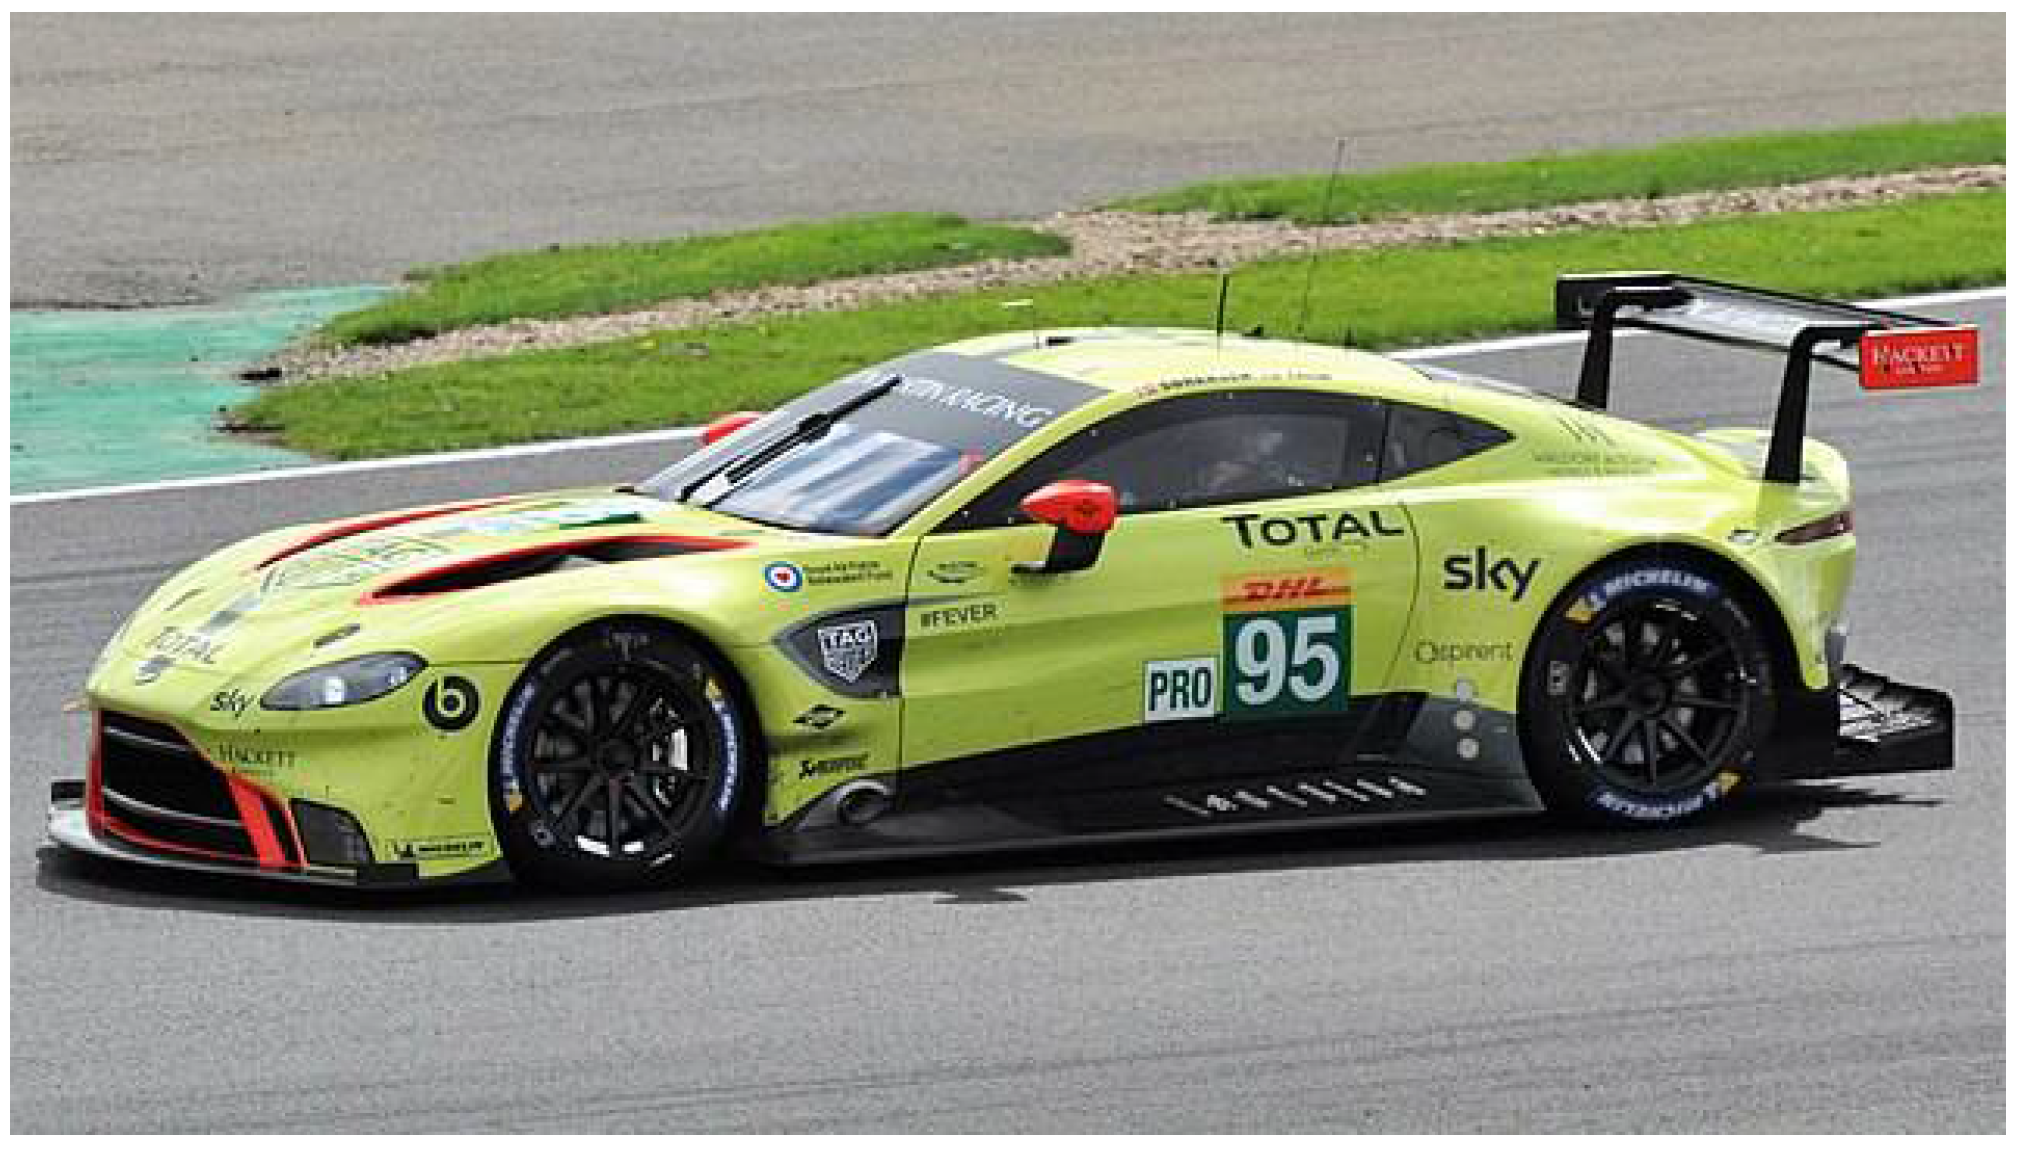
Figure 7.
The Aston Martin Vantage LMGTE Pro car showing the high and rearward position of the rear wing typical of a modern GT race car. Image by John Chapman. Creative Commons.
Figure 7.
The Aston Martin Vantage LMGTE Pro car showing the high and rearward position of the rear wing typical of a modern GT race car. Image by John Chapman. Creative Commons.

Figure 8.
Schematic representation of the horizontal (x) and vertical (y) variables for a rear wing.
Figure 8.
Schematic representation of the horizontal (x) and vertical (y) variables for a rear wing.

Figure 9.
Schematic representation of the angle of attack (α) variables for a rear wing.

Figure 10.
Plot of drag coefficient (Cd) and lift coefficient (CL) at 70 mph, obtained from 2D simulation, as a function of horizontal distance (mm) of the leading edge of a wing from the central point of an Aston Martin DB7.
Figure 10.
Plot of drag coefficient (Cd) and lift coefficient (CL) at 70 mph, obtained from 2D simulation, as a function of horizontal distance (mm) of the leading edge of a wing from the central point of an Aston Martin DB7.

Figure 11.
Plot of drag coefficient (Cd) and lift coefficient (CL) at 70 mph obtained from a 2D simulation as a function of vertical distance (mm) of the leading edge of a wing from the central point of an Aston Martin DB7.
Figure 11.
Plot of drag coefficient (Cd) and lift coefficient (CL) at 70 mph obtained from a 2D simulation as a function of vertical distance (mm) of the leading edge of a wing from the central point of an Aston Martin DB7.

Figure 12.
Comparison of the streamlines around the Aston Martin DB7 with a rear wing horizontal distance of 1800 mm and a height of (a) 650 and (b) 750 mm (c.f., Figure 8).
Figure 12.
Comparison of the streamlines around the Aston Martin DB7 with a rear wing horizontal distance of 1800 mm and a height of (a) 650 and (b) 750 mm (c.f., Figure 8).

Figure 13.
The Aston Martin DB7 V8 GT1 car built for Le Mans showing the position of the rear wing as optimized from wind tunnel studies on a scale model. Reproduced with permission from https://astonmartins.com/car/db7-v8-gt1-for-le-mans/. Copyright: Tim Cottingham.
Figure 13.
The Aston Martin DB7 V8 GT1 car built for Le Mans showing the position of the rear wing as optimized from wind tunnel studies on a scale model. Reproduced with permission from https://astonmartins.com/car/db7-v8-gt1-for-le-mans/. Copyright: Tim Cottingham.

Figure 14.
Plot of drag coefficient (Cd) and lift coefficient (CL) at 70 mph obtained from 2D simulation as a function of attack angle (α, °) of a rear wing on an Aston Martin DB7.
Figure 14.
Plot of drag coefficient (Cd) and lift coefficient (CL) at 70 mph obtained from 2D simulation as a function of attack angle (α, °) of a rear wing on an Aston Martin DB7.

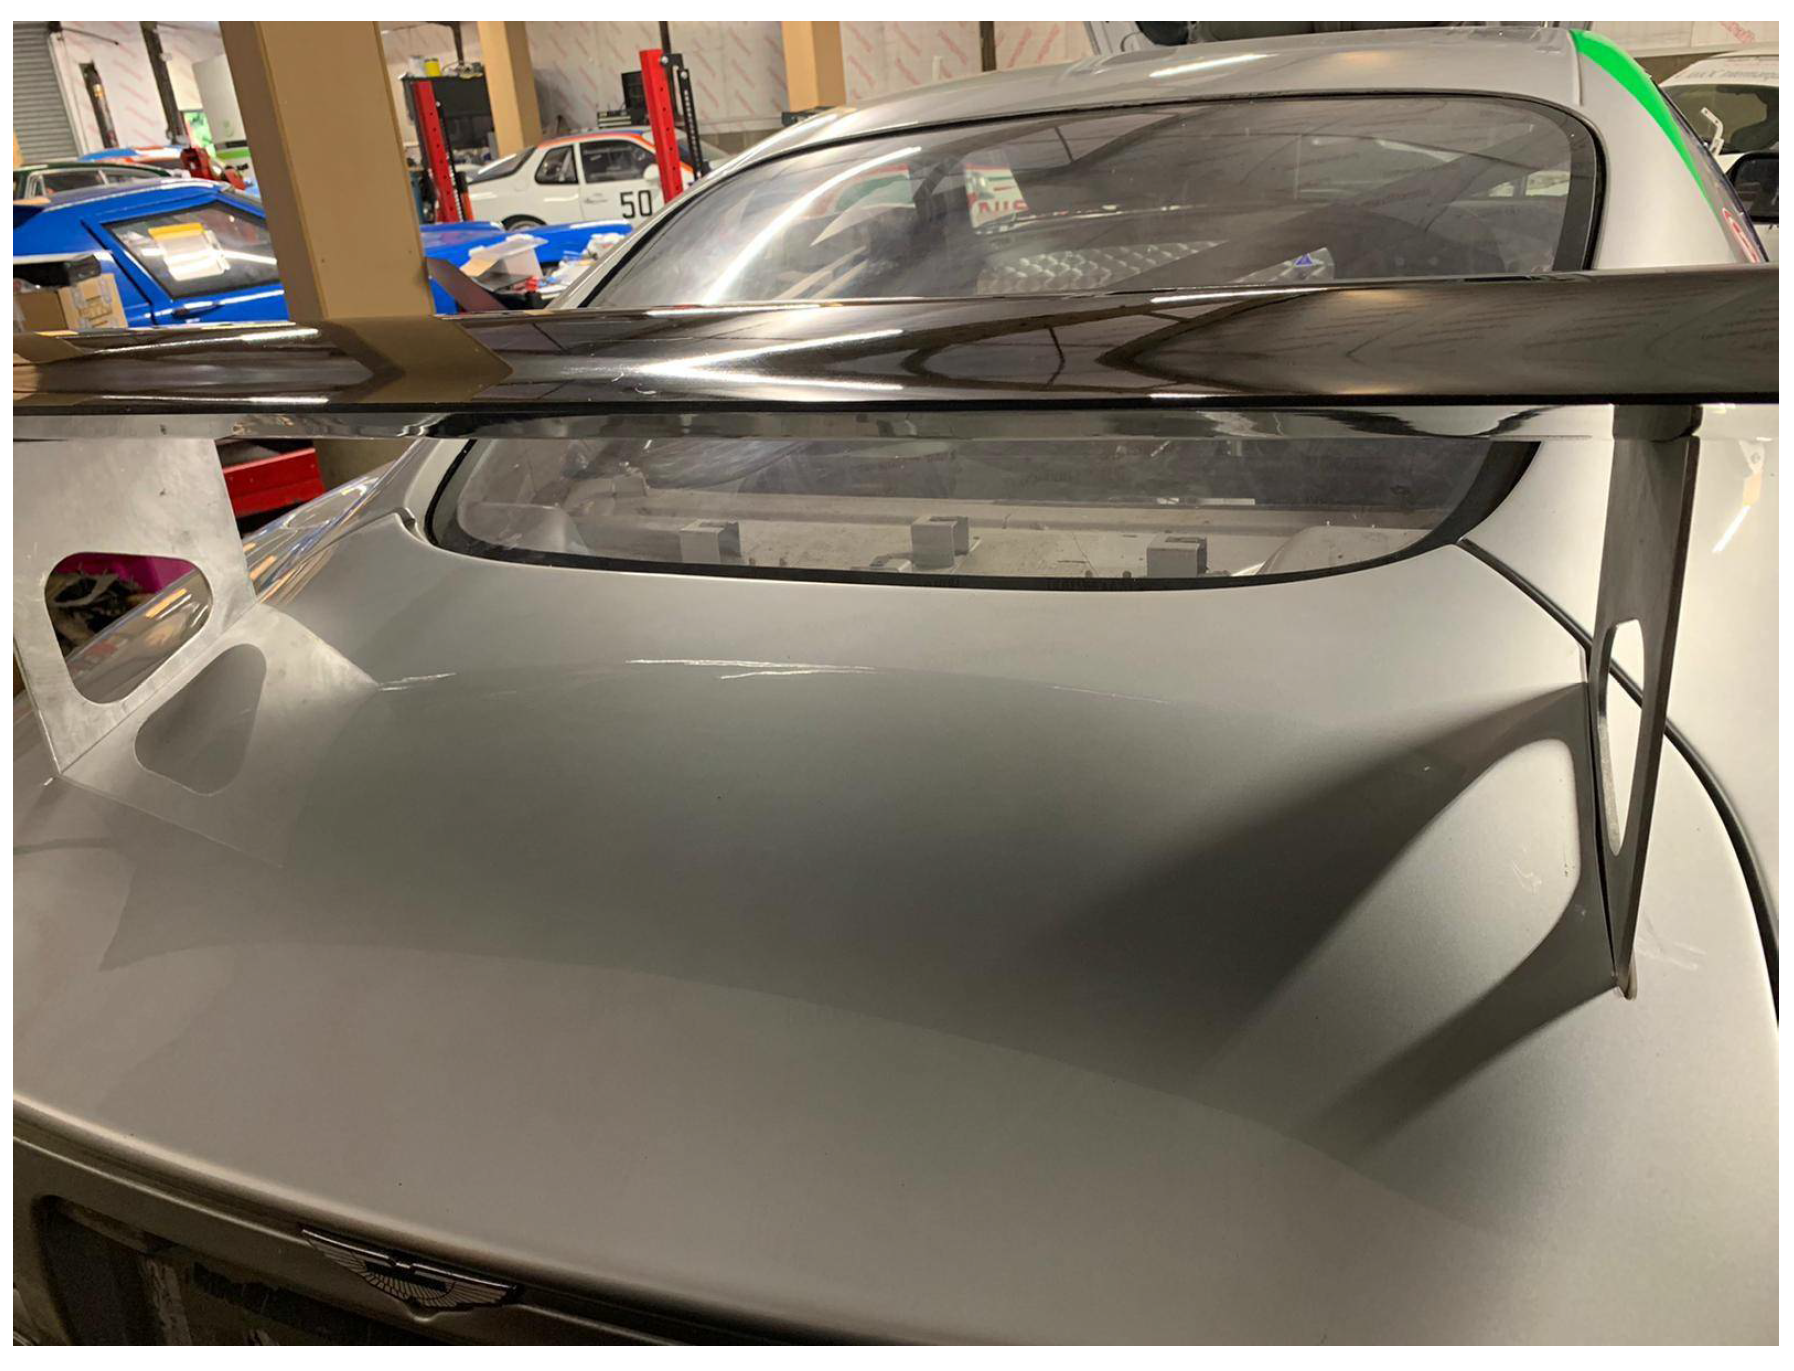
Figure 15.
Photograph of the Aston Martin DB7 Vantage with the rear wing positioned based upon the current 2D calculations. It should be noted that the study did not compare the results with 3D results.
Figure 15.
Photograph of the Aston Martin DB7 Vantage with the rear wing positioned based upon the current 2D calculations. It should be noted that the study did not compare the results with 3D results.


Table 1.
Reference values used in ANSYS Fluent (CFD).
| Area | 1.959 m2 |
| Density | 1.225 kg/m3 |
| Depth | 1.83 m |
| Length | 4.666 m |
| Temperature | 288.16 K |
| Velocity | 35.76 m/s |
| Viscosity | 1.789 × 10⁻⁵ kg/m·s |
| Ratio of specific heats | 1.4 |
Table 2.
Drag and lift coefficient data as a function of rake angle for a 2D simulation of an Aston Martin DB7 at 60, 70, and 80 mph.
Table 2.
Drag and lift coefficient data as a function of rake angle for a 2D simulation of an Aston Martin DB7 at 60, 70, and 80 mph.
| Rake Angle (°) | Drag Coefficient (Cd) | Lift Coefficient (CL) | ||||
|---|---|---|---|---|---|---|
| 60 mph | 70 mph | 80 mph | 60 mph | 70 mph | 80 mph | |
| 0.00 | 0.412 | 0.408 | 0.405 | −0.054 | −0.054 | −0.055 |
| 0.25 | 0.424 | 0.420 | 0.417 | −0.049 | −0.050 | −0.050 |
| 0.5 | 0.436 | 0.433 | 0.430 | −0.065 | −0.064 | −0.064 |
| 0.75 | 0.447 | 0.444 | 0.442 | −0.028 | −0.029 | −0.029 |
| 1.00 | 0.460 | 0.457 | 0.455 | −0.022 | −0.022 | −0.022 |
| 1.25 | 0.469 | 0.467 | 0.464 | −0.013 | −0.013 | −0.013 |
| 1.5 | 0.476 | 0.473 | 0.471 | −0.030 | −0.031 | −0.032 |
| 1.75 | 0.490 | 0.488 | 0.486 | −0.012 | −0.013 | −0.013 |
| 2.00 | 0.499 | 0.497 | 0.496 | −0.011 | −0.012 | −0.011 |
| 2.25 | 0.485 | 0.483 | 0.482 | 0.003 | 0.003 | 0.003 |
| 2.5 | 0.499 | 0.498 | 0.497 | 0.034 | 0.035 | 0.035 |
| 2.75 | 0.484 | 0.483 | 0.482 | 0.023 | 0.023 | 0.023 |
Table 3.
Drag and lift coefficient data as a function of the horizontal position of a rear wing (mm) for 2D simulation of an Aston Martin DB7 at 60, 70, and 80 mph.
Table 3.
Drag and lift coefficient data as a function of the horizontal position of a rear wing (mm) for 2D simulation of an Aston Martin DB7 at 60, 70, and 80 mph.
| Horizontal Distance (mm) | Drag Coefficient (Cd) | Lift Coefficient (CL) | ||||
|---|---|---|---|---|---|---|
| 60 mph | 70 mph | 80 mph | 60 mph | 70 mph | 80 mph | |
| 1500 | 0.862 | 0.856 | 0.852 | 0.032 | 0.030 | 0.028 |
| 1600 | 0.787 | 0.781 | 0.776 | 0.011 | 0.009 | 0.008 |
| 1700 | 0.732 | 0.725 | 0.720 | −0.018 | −0.020 | −0.021 |
| 1800 | 0.709 | 0.702 | 0.696 | −0.042 | −0.048 | −0.048 |
| 1900 | 0.699 | 0.692 | 0.686 | −0.045 | −0.047 | −0.044 |
| 2000 | 0.677 | 0.671 | 0.665 | −0.030 | −0.032 | −0.032 |
| 2100 | 0.684 | 0.679 | 0.674 | −0.021 | −0.021 | −0.018 |
| 2200 | 0.713 | 0.709 | 0.706 | −0.008 | −0.010 | −0.011 |
Table 4.
Drag and lift coefficient data as a function of the vertical position of a rear wing (mm) for 2D simulation of an Aston Martin DB7 at 60, 70, and 80 mph.
Table 4.
Drag and lift coefficient data as a function of the vertical position of a rear wing (mm) for 2D simulation of an Aston Martin DB7 at 60, 70, and 80 mph.
| Vertical Distance (mm) | Drag Coefficient (Cd) | Lift Coefficient (CL) | ||||
|---|---|---|---|---|---|---|
| 60 mph | 70 mph | 80 mph | 60 mph | 70 mph | 80 mph | |
| 775 | 0.708 | 0.701 | 0.695 | −0.046 | −0.045 | −0.045 |
| 750 | 0.709 | 0.702 | 0.696 | −0.042 | −0.048 | −0.048 |
| 725 | 0.718 | 0.712 | 0.707 | −0.024 | −0.026 | −0.027 |
| 700 | 0.710 | 0.704 | 0.700 | −0.021 | −0.022 | −0.024 |
| 675 | 0.710 | 0.705 | 0.701 | −0.010 | −0.012 | −0.014 |
| 650 | 0.785 | 0.781 | 0.778 | 0.031 | 0.028 | 0.026 |
Table 5.
Drag and lift coefficient data as a function of the angle of attack (α) of a rear wing for 2D simulation of an Aston Martin DB7 at 60, 70, and 80 mph.
Table 5.
Drag and lift coefficient data as a function of the angle of attack (α) of a rear wing for 2D simulation of an Aston Martin DB7 at 60, 70, and 80 mph.
| Attack Angle (°) | Drag Coefficient (Cd) | Lift Coefficient (CL) | ||||
|---|---|---|---|---|---|---|
| 60 mph | 70 mph | 80 mph | 60 mph | 70 mph | 80 mph | |
| 0.0 | 0.575 | 0.571 | 0.567 | −0.041 | −0.045 | −0.042 |
| 2.5 | 0.593 | 0.589 | 0.584 | −0.044 | −0.042 | −0.042 |
| 5.0 | 0.627 | 0.621 | 0.616 | −0.060 | −0.055 | −0.055 |
| 7.5 | 0.658 | 0.653 | 0.648 | −0.052 | −0.053 | −0.053 |
| 10.0 | 0.709 | 0.702 | 0.696 | −0.042 | −0.048 | −0.048 |
| 12.5 | 0.762 | 0.755 | 0.750 | −0.031 | −0.032 | −0.033 |
| 15.0 | 0.813 | 0.806 | 0.801 | −0.016 | −0.018 | −0.019 |
| 17.5 | 0.847 | 0.840 | 0.834 | −0.007 | −0.009 | −0.010 |
| 20.0 | 0.907 | 0.900 | 0.895 | 0.011 | 0.009 | 0.007 |
| 22.5 | 0.957 | 0.951 | 0.946 | 0.020 | 0.017 | 0.016 |
| 25.0 | 0.998 | 0.991 | 0.985 | 0.011 | 0.020 | 0.018 |
Publisher’s Note: MDPI stays neutral with regard to jurisdictional claims in published maps and institutional affiliations. |
© 2022 by the authors. Licensee MDPI, Basel, Switzerland. This article is an open access article distributed under the terms and conditions of the Creative Commons Attribution (CC BY) license (https://creativecommons.org/licenses/by/4.0/).
Share and Cite
MDPI and ACS Style
O’Driscoll, T.P.; Barron, A.R. CFD Analysis of the Location of a Rear Wing on an Aston Martin DB7 in Order to Optimize Aerodynamics for Motorsports. Vehicles 2022, 4, 608-620. https://doi.org/10.3390/vehicles4020035
AMA Style
O’Driscoll TP, Barron AR. CFD Analysis of the Location of a Rear Wing on an Aston Martin DB7 in Order to Optimize Aerodynamics for Motorsports. Vehicles. 2022; 4(2):608-620. https://doi.org/10.3390/vehicles4020035
Chicago/Turabian StyleO’Driscoll, Thomas P., and Andrew R. Barron. 2022. "CFD Analysis of the Location of a Rear Wing on an Aston Martin DB7 in Order to Optimize Aerodynamics for Motorsports" Vehicles 4, no. 2: 608-620. https://doi.org/10.3390/vehicles4020035