1. Introduction
The rise in connectivity through the Internet of Things (IoT) has led to an increased demand for an efficient, off-grid power supply [
1,
2,
3]. IoT has the potential to connect billions of devices, ranging from household furnishings to personal electronics such as smart watches and phone [
4,
5]. There are multiple methods of energy harvesting for powering IoT nodes [
6] from piezoelectrics, to thermoelectrics [
7,
8] and hybridised harvesting that utilises two or more of these methods [
9,
10]. Of all available ambient energy sources, visible light has the greatest power density [
11,
12] and so photovoltaic (PV) devices are a prime candidate for self-powered IoT nodes, with the added advantage that they can be discretely integrated into the device design [
13]. The high cost of commercial devices such as gallium arsenide (GaAs) photovoltaics and the poor performance of commercial silicon photovoltaics in low-light conditions could result in an increased cost and size to devices designed to be cheap and discreet. Therefore, a cost-effective and easily producible cell which performs well in low-light conditions is desirable [
14]. There have been multiple studies into powering IoT and wireless sensor node networks using photovoltaics, and there are many examples of organic photovoltaics for indoor energy harvesting [
15,
16,
17]. For example, 20.7 µW/cm
2 has been achieved under a 300 lux fluorescent light using a PCDTBT:PCBM heterojunction with a PEIE layer to control shunt resistance. Recent studies of the ambient light performance of hybrid lead halide perovskite-based solar cells (PSCs) show that they are a prime candidate for artificial and low-light energy harvesting [
18]. Perovskites are direct band gap semiconductors and absorb strongly in the visible spectrum and exhibit a high voltage response at AM 1.5 which implies a minimal intrinsic loss [
19], suggesting that PSCs will perform well in low-light conditions [
20]. For example, at 1000 lux, power conversion efficiencies (PCEs) of 26.3% [
21], 30.1% [
22], and 35.2% [
23] have been achieved. At lower light intensities (400 lux), 24% [
24], 25.4% [
18], and 26.9% [
25] have been demonstrated.
Standardised testing methods for simulated sunlight have existed since the 1970s with the agreed upon definition of AM 1.5 approved by ASTM in 1982 [
26]. At present there are no agreed upon standards for indoor measurements [
27]. Some testing methodologies have been suggested such as a regulated charge pump with an integrated optimum power point tracking algorithm specifically designed for indoor solar measurements [
28]. A similar methodology to the one presented in this study suggests using historic realistic outdoor intensity/temperature data and measuring the energy yield of PSCs in these conditions [
29].
Many of the studies performed for PSCs in low light maintain a constant lux level, generally 200 or 1000 lux [
19,
21,
22,
23,
25,
30,
31,
32,
33], using LED and CFL light sources and direct incident light. These methods are adequate for comparison of materials and interfaces in order to optimise low-light performance but yield little information on how much power these devices might produce in a given scenario. For outdoor solar simulation, the movement of the Sun with respect to the location on Earth and local meteorological conditions are known sufficiently so that simulation software such as PV*Sol [
34] can accurately predict the energy yield of a particular PV panel over a given period of time. This information is not readily available for predicting ambient light energy-yields as in most cases the lux level is not constant and unlike natural sunlight is less subject to predictable fluctuations, usually due to human factors. For example, at an office desk with natural incident light from a window, the light level will fluctuate during the day while the level of artificial light could be subject to factors such as office occupancy, external weather conditions and whether artificial lights are constantly on or dependant on motion sensors. At end of the working day when artificial lights are turned off, the PV cell must produce enough excess energy to prevent the IoT batteries from draining at night. In order to understand the power output of a particular PV technology in a particular scenario, an understanding of the light power available is necessary. In this study, we have chosen three locations where an IoT device may be deployed and measured the light intensity logged during a number of days. We then recreate a typical day using a customised ambient light simulator and maximum power point tracker (MPPT) to measure power output and energy yield of a particular solar cell technology in one of our chosen scenarios. We show that perovskite solar cells can be competitive with commercial incumbents.
2. Materials and Methods
PSCs were fabricated on glass/indium tin oxide (ITO) substrates. Glass/ITO substrates were cleaned by scrubbing with Hellmanex® surfactant 2% in DI water. Subsequently, substrates were cleaned by ultrasonic bath, heated to 60 degrees, in Hellmanex® solution for 10 min followed by DI water rinsing and sonication for 2 min, followed by sonication in acetone and the isopropanol solvents for 2 min each. Finally, substrates were cleaned in O2 plasma for 10 min. For the fabrication of the inverted structure (p-i-n), ITO/NiOx/CH3NH3PbI3/PCBM/BCP/Ag solar cell devices, a 0.2 M NiOx solution was prepared by dissolving Nickel acetate tetrahydrate in 2-methoxyethanol at 60 degrees. Once dissolved a small amount of ethanolamine (12 µL/mL) was added to the solution before filtration through a 0.45 µm PTFE filter. NiOx HTL layer was deposited onto the glass/ITO substrate via single step spin coating at a spin speed of 3000 rpm for 30 s. The NiOx film (~50 nm thick) was then annealed at 300 degrees for 30 min. The perovskite solution was prepared by dissolving 605 mg PbT2 and 199 mg methylammonium iodide in 1 mL of a 4:1 solvent mix of DMF:DMSO overnight at 60 degrees in the glove box followed by filtration through a 0.45 µm PTFE filter. The solution was spin coated onto the HTLs at 4000 rpm for 30 s. After 7 s, 200 µL of ethyl acetate was deposited directly onto the centre of the rotating sample causing a crystallisation of the perovskite solution into a cohesive film. The perovskite films are then annealed for 10 min on a 100-degree hotplate to obtain dense black perovskite films of approximately 550 nm thickness. Next, 20 mg of [6, 6]-Phenyl-C60-butyric acid methyl ester (PCBM) was dissolved in 1 mL of chlorobenzene and heated at 60 degrees overnight in the glove box. The ETL was deposited directly onto the perovskite film via spin coating at 4000 rpm for 30 s, resulting in a film thickness of approximately 200 nm. The sample was allowed to anneal in air before the addition of 100 µL of 1 mg/mL solution of bathocuproine (BCP) in ethanol. The addition of BCP improves the work function compatibility of the ETL to the silver electrodes. Finally, silver electrodes were deposited via thermal evaporation using a bell jar evaporator. Two devices were produced per sample each with an area of 1 cm2. For the n-i-p PSCs ITO/SnO2/CH3NH3PBI3/SPIRO-OMeTAD/Au solar cell devices: A solution of SnO2 nanoparticles was prepared by mixing 3.5 parts de-ionised water with 1 part SnO2 nanoparticles (15% colloidal dispersion in H2O. The ITO substrate was O2 plasma treated for 10 min to improve wetting before a layer (~15 nm)of the SnO2 nanoparticles were deposited onto the ITO via spin coating at 4000 rpm for 30 s. The SnO2 nanoparticle films were then annealed at 140 °C for 30 min. The perovskite solution was deposited as for the p-i-n devices producing a film ~550 nm thick. A solution of SPIRO-OMeTAD was prepared by dissolving 90 mg of SPIRO-OMeTAD in 1ml of chlorobenzene and gently agitating for 10 min. 34 µL of 4-tert-butylpyridine (4tBP), 19 µL of Lithium bis(trifluoromethanesulfonyl)imide (LiTFSI) [520 mg/mL in acetonitrile], and 10 µL of FK209 in acetonitrile were added to dope the solution. The SPIRO-OMeTAD solution was deposited dynamically by spin casting from a height of 1 cm above the sample surface 10 s before the 30 s spin ends, resulting in an ~220 nm film thickness. Finally, gold electrodes were deposited via thermal evaporation using a bell jar evaporator. Four devices were produced per sample each with an area of 0.16 cm2. For the carbon-based perovskite solar cells: FTO was initially patterned with a Nb:YVO4 laser (532 nm). The laser patterned substrate was then cleaned with a solution of Hellmanex® in deionised water, rinsed with acetone, IPA, and finally plasma cleaned in an O2 atmosphere for 5 min. A compact TiO2 BL layer (50 nm) was deposited by spray pyrolysis with a solution of 10% Titanium di-isopropoxide bis (acetylacetonate) in IPA on the FTO substrate which kept at 300 °C on a hot plate. Mesoporous layers of mesoporous TiO2 (600–800 nm), mesoporous ZrO2 (1.2–1.5 µm), and mesoporous carbon (12–14 µm) were sequentially screen printed. After each printing the sample was annealed at 550 °C for Titania, 400 °C for Zirconia and also 400 °C for carbon. The paste for the TiO2 layer was diluted in terpineol in a 1:1 ratio by weight. The other pastes were used as bought. The last step of the standard fabrication procedure was the infiltration of perovskite solution. The precursor perovskite solution was synthesised by dissolving 0.439 of PbI2, 0.1514 of MAI and 0.0067 g of 5-AVAI (to obtain a 3% molar ratio between 5-AVAI and MAI) in 1 mL γ-butyrolactone at 60 °C. 14 µL of the solution drop casted on the 1 cm2 active area of the cells through the carbon layer. Allowing 10 min time for the solution to percolate throughout the triple stack, the devices were annealed in a fan oven for 1 h. The finished solar cells were then exposed to 70% relative humidity at 40 °C 24 h to induce a recrystallisation and then dried in a vacuum oven before measuring to reach their final efficiency.
The IoT demonstrator consists of: a STEVAL-ISV021V1 energy harvester and battery charger (STMicroelectronics, Geneva, Switzerland); LS013B7DH03 128 × 128 pixel polymer liquid crystal display (Sharp, Osaka, Japan); BOOSTXL-SHARP128 booster pack (Texas Instruments, Dallas, TX, USA); MSP-EXP430F5529LP microcontroller (Texas Instruments, Dallas, TX, USA); SIT15344 ultra-low power oscillator (SITime, Santa Clara, CA, USA); BMP280 Barometric pressure and temperature sensor (Bosch Sensortec, Reutlingen, Germany); TPL5111 ultra-low power system timer (Texas Instruments, Dallas, TX, USA); XBee S1 wireless communication module (Digi International, Hopkins, MN, USA).
3. Results and Discussion
In order to measure the energy yield of PSCs in a particular scenario, the available light power, and how it changes during a given day, must also be measured. Three scenarios were chosen, and the light intensity was measured using a logging pyranometer. The spectral response of the data logger is somewhat similar to the human eye, showing a normal distribution in the normalised response from approximately 400 to 700 nm with a maximum response of approximately 550 nm. In order to account for spectral differences, spectral mismatch calculations are required which will be described in detail later. Ideally, a portable spectrophotometer/spectroradiometer would be used to measure the entire spectral range however, such devices are comparatively expensive and impractical as they require a mains power supply. A simple pendant data logger such as the one used in this work is inexpensive, easy to use, and can be left in situ for up to 6 months [
35,
36]. The lux values were measured by the data logger over the course of several days but for the purpose of comparison, one day for each scenario was chosen. The lux values for the scenarios are shown in
Figure 1a below. The first scenario is an open plan office, used by PhD students, where the windows face onto a covered walkway and so has very little natural light. The lighting within this room is solely from LED lighting with very little variance throughout the day. The light intensity during the day (06:00–20:00) remains consistent at approximately 150 lux. The lights in the office are switched on using a motion sensor, and so when not occupied, all office lights are switched off and the lux level drops to zero. The second scenario is another open plan office, used by postdoctoral researchers. The office has east faced windows, so has natural light which is typically brighter during the early morning. The office also has LED lighting. The maximum illuminance in this scenario peaks at approximately 09:00 at approximately 350 lux. From midday onward the illuminance is fairly consistent at approximately 200 lux. The third scenario is a covered walkway with a white translucent canopy approximately 5 m above the measurement point. There is some LED artificial lighting but most of the light here is highly diffuse natural light shining through the canopy. This scenario has the most variance in illuminance with a maximum value of approximately 3000 lux at midday. The light intensity in this scenario shows the most variance and this can be attribute to the meteorological conditions in South Wales being variable and often cloudy. It should be noted the illuminance measurements were taken in positions where an IoT might be typically found, i.e., fixed to wall in some location and not subject to direct incident light. These values, particularly the office-based scenarios, correspond to the standard BS EN 12464-1:2021 (Light and lighting. Lighting of work places), which stipulated that “maintained illuminance on walls” (
Ēm,wall) should be 100–150 lux dependant on the task (e.g., typing, filing, and data processing) [
37].
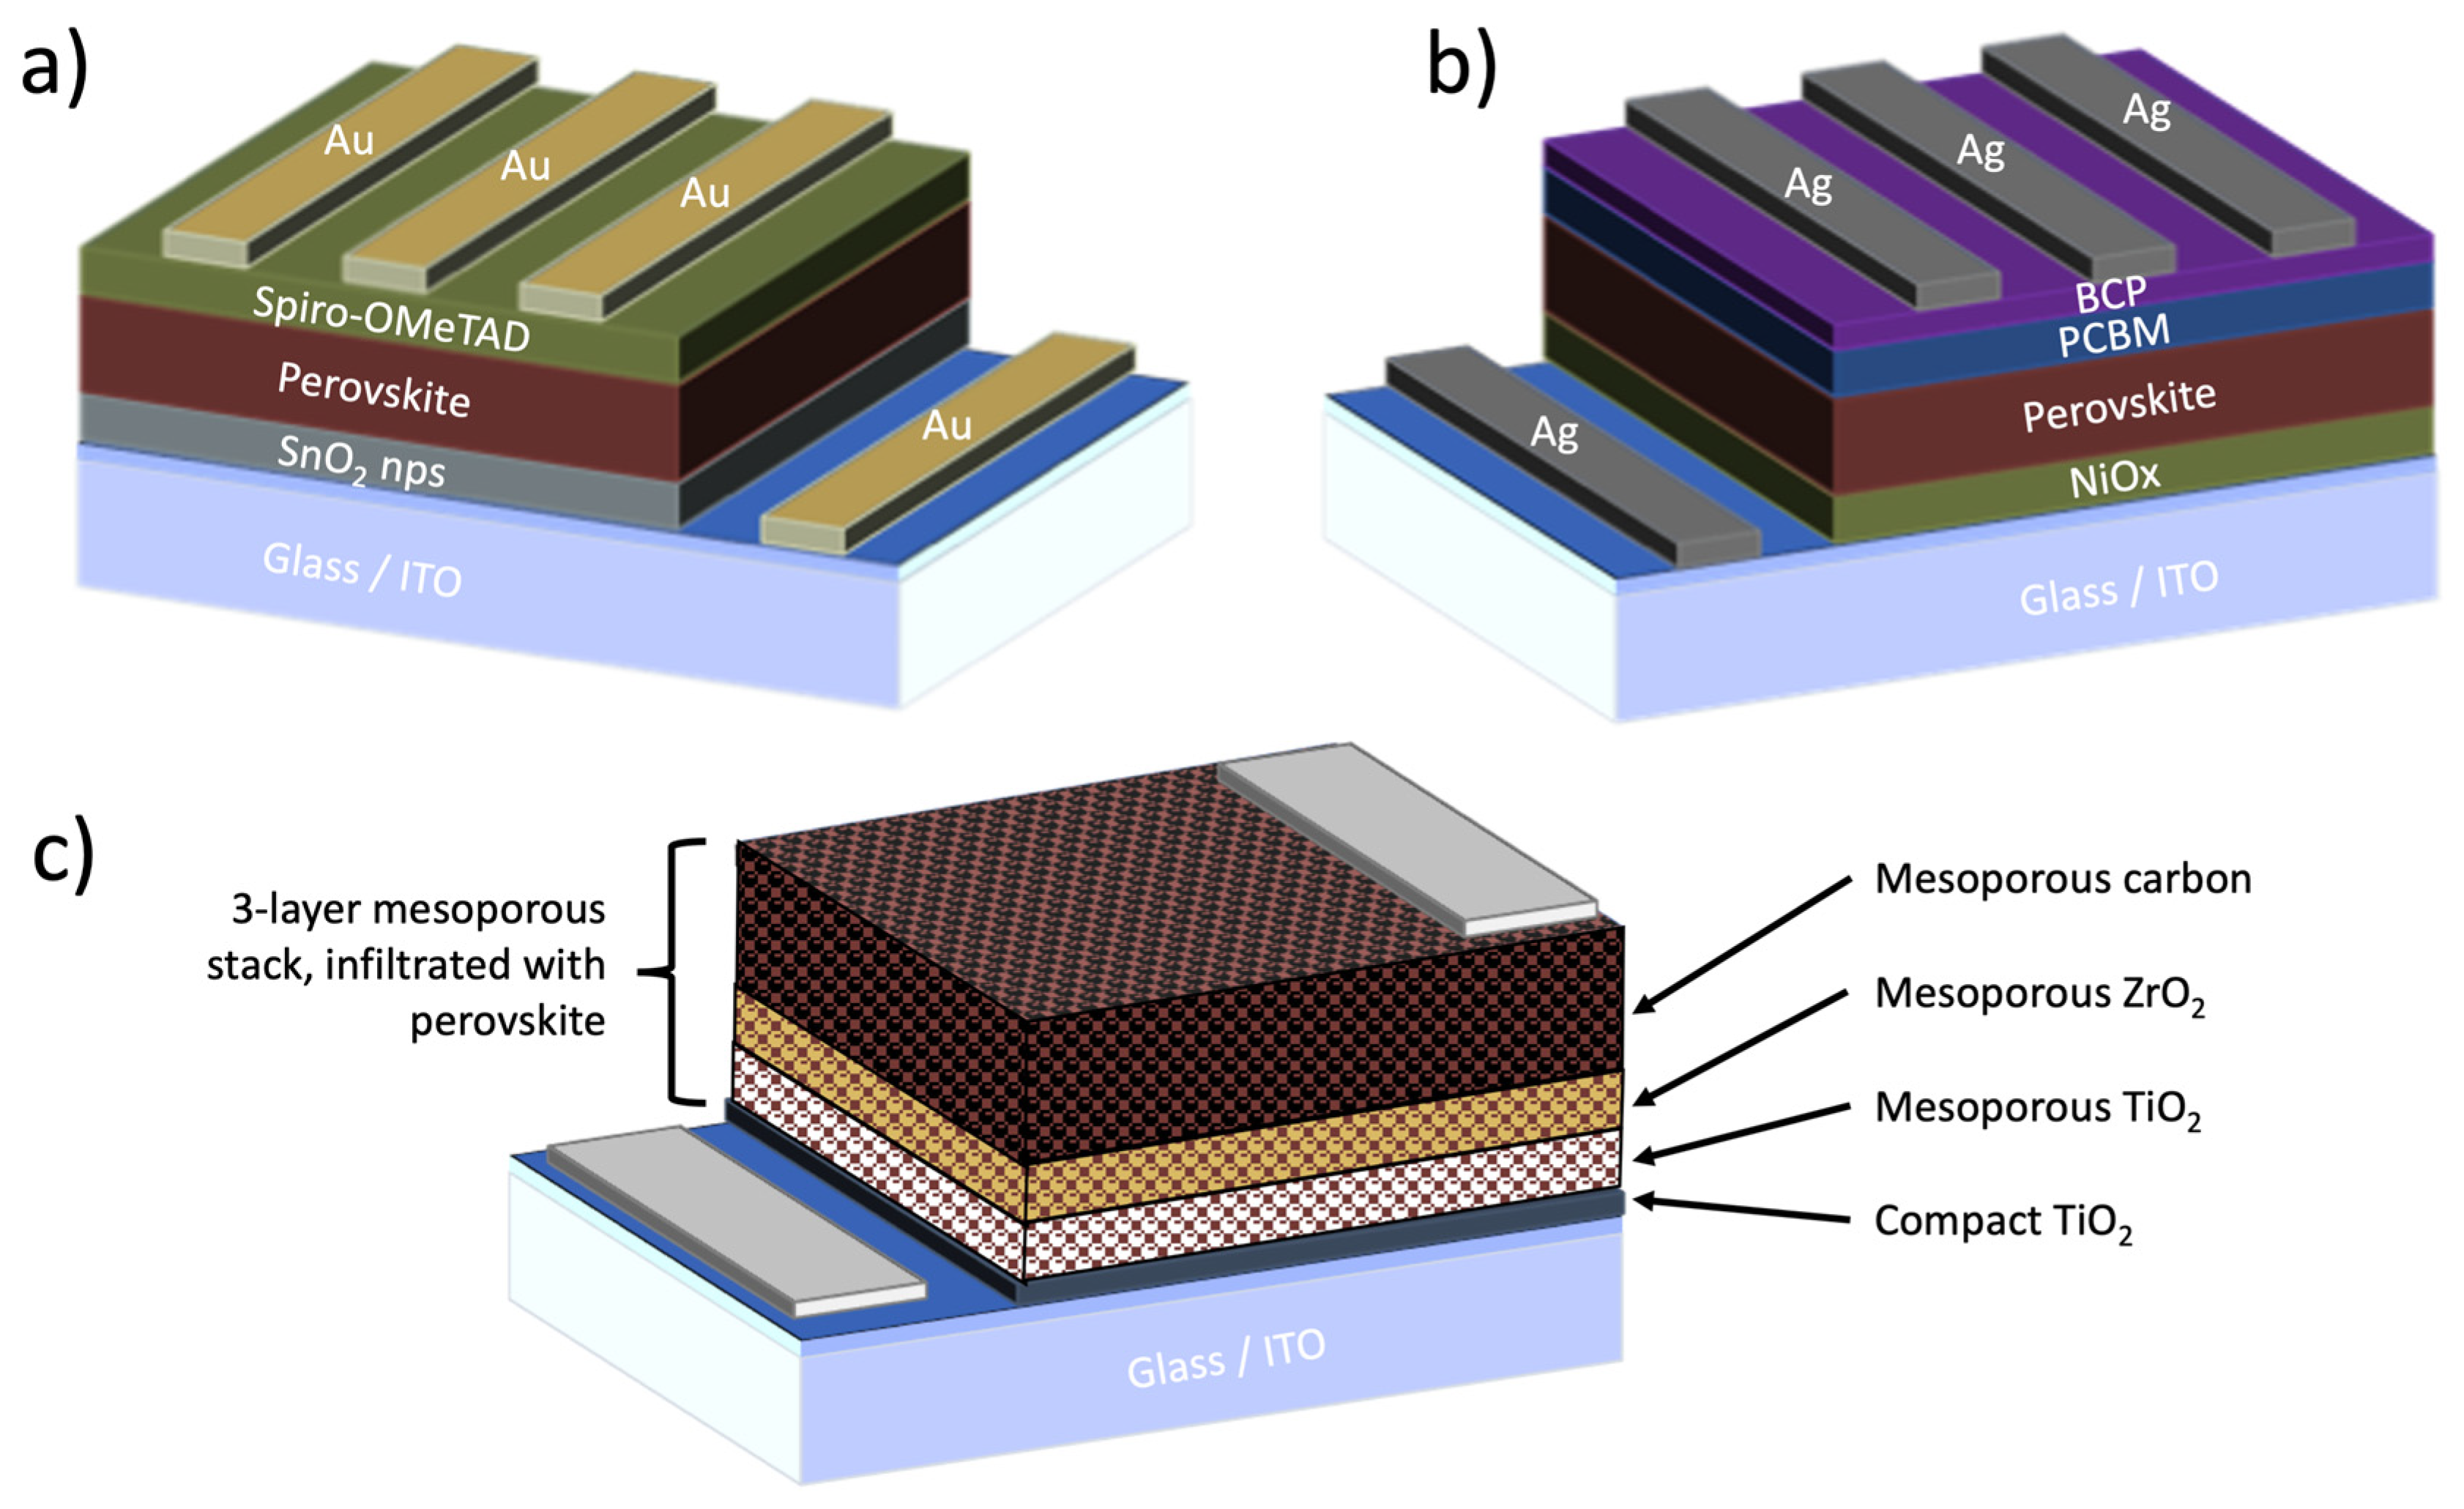
Three types of PSC were tested (see schematics in
Figure 2): a mesoporous carbon-based perovskite solar cell (cPSC), an inverted p-i-n PSC with NiO and PCBM transport layers, and an n-i-p PSC with SnO
2 and Spiro-OMeTAD transport layers. These “in-house” laboratory-built PSCs were compared to commercial GaAs and a-Si solar cells. All cells were measured under AM1.5 standard lighting, often termed “1-Sun”.
Table 1 below outlines the main performance parameters of each cell at 1-Sun. As might be expected the commercial GaAs cell is the most efficient followed by the n-i-p PSC and the cPSC. The poor performance of the p-i-n perovskite cell can be attributed to the cell area and the resultant series resistance increase due to the relatively larger cell area. The high series resistance results in a low fill-factor and hence a lower calculated efficiency. Ideally, all cells tested would have the same cell area but as all cells were sourced from different providers, this is difficult to achieve. The size of the device can have a critical influence on device physics, most importantly the series resistance of the cell increases with increasing size. This is less critical at low light intensities, however, as the carrier densities are at such a level that series resistance is much less of a limiting factor.
To measure the energy yield of the PSCs in each of the scenarios, a customised ambient light simulator with maximum power point tracking (MPPT) was used to recreate the time-dependent light intensity data so that any given period of time could be simulated, and the PSCs tested under those conditions. It should be noted that MPPT in this case refers to the measurement of the maximum power point only and not the technique used to maximise energy extraction. As such, the system employed for these experiments utilises a modified perturb and observe (P&O) algorithm. A standard P&O algorithm maximises the power output by constantly perturbing the operating voltage and recording the effect on the power output, the algorithm is modified by the inclusion of an arbitrarily defined power inversion threshold to mitigate high hysteresis of PSCs and eliminate non-optimal power tracking [
38]. MPPT data was taken at 1 point per second over the course of the whole scenario. The ambient light solar simulator uses LEDs of 2700 K colour temperature fitted with a diffuser to be more realistic, as our measurements of scenario-based light intensity were never taken in direct incident light. Because the LEDs in the MPPT system have a different output spectrum to light sources in our scenarios, spectral mismatch calculations are required in order to accurately measure the energy yield of our devices.
When considering solar cells for the outdoors, one must only consider a single source of light, the Sun, of which the spectral characteristics and angle of elevation are known sufficiently so that accurate predictions of light power can be calculated for a given location on the planet. Ambient lighting is far more complex than sunlight as most indoor environments have a mixture of artificial light sources as well as incident and diffuse natural light provided by windows which could be of several aspects. The characteristics of indoor lighting are highly dependent on room occupancy, personal preference and seasonal and daily variance in the amount of available natural light. In standard solar cell testing procedures, a calibrated reference cell is used to adjust the intensity of an indoor solar simulator (AM 1.5G) which is then used for testing unknown solar cells. It is often the case that the reference cell and unknown cell will exhibit different spectral responses under the same conditions leading to an error known as the spectral mismatch error [
39,
40]. In order to correct for this a spectral mismatch factor (MMF), Equation (1) must be calculated [
41].
where E
ref and E
meas are the spectral irradiance of the sun and AM 1.5G, respectively, and SR
ref and SR
sample are the spectral response of the reference and test cell, respectively.
In the case of our experiments, a non-conventional approach to simulated testing is taken. The reference spectra, E
ref, is replaced by the spectra of the scenario in which each data set was obtained, i.e., an office or corridor. The spectral irradiance distribution of the solar simulator, E
meas, is replaced by the spectra of the LED array of MPPT system. When the spectral response of the test cell is different from that of the reference cell, then a mismatch factor must be calculated. The spectral response or external quantum efficiency (EQE) for the a-Si, GaAs, and PSCs was obtained and can be seen in
Figure 3. Since the same perovskite absorber is used in all PSCs, the normalised EQE is expected to be the same for the purposes of the spectral mismatch calculation. The measured power output of each solar cell is then multiplied by the mismatch factor corresponding to the scenario. The calculated MFFs for each scenario and PV device are shown in
Table 2 below.
Figure 4 below shows the real-time power output and calculated energy yield for each of the test devices in each of the scenarios for one typical day. Daytime MPPT data is only shown, and used for calculation of energy yield, as during the night, the lux values are effectively zero, and hence the night-time power output of the cells, was zero.
Figure 4a shows the power output and energy yield for the photovoltaics cells in scenario one (PhD Office). This is the lowest illumination scenario as there is no natural lighting. The luminance in this scenario never reaches beyond 200 lux. The best performing cell in this case is the GaAs cell, which has an energy yield of 0.163 mWhr cm
−2. This is followed closely by the 1 cm
2 p-i-n PSC with 0.136 mWhr cm
−2. The n-i-p PSC has a much lower energy yield, 0.039 mWhr cm
−2, lower than the a-Si cell at 0.050 mWhr cm
−2. This is perhaps at first a surprising result given the values at one-sun light intensity reported in
Table 1. However, the factors that influence device operation can be different in different light-intesity regimes. For example, the poorer performance of the 1 cm
2 p-i-n perovskite cell at one-sun compared to the 0.16 cm
2 n-i-p PSC can be attributed, in part, to an increased series resistance because generated carriers have further to travel in order to be extracted at the cell electrode. Low light intensities result in fewer generated carriers, meaning that series resistance is no longer a limiting factor. However, at low light intensities, the shunt resistance becomes more important and higher shunt resistances are associated with defect free semi-conductor layers. The 1 cm
2 p-i-n cell clearly has high shunt resistance, whereas the 0.16 cm
2 n-i-p cell seems to have shunting issues (possibly due to pinholes). Despite this result, it is encouraging nonetheless that a perovskite cell, manufactured in laboratory conditions, and with obvious series resistance limitations at high light intensity can perform almost as well as a commercial GaAs at low light intensities. The median scenario in terms of light intensity is scenario two (postdoctoral office), which has east facing windows. The aspect of the windows results in a higher light intensity in the morning compared to the afternoon. Nonetheless the light intensity barely reaches above 500 lux. Again, the GaAs cell is the best performing, with an energy yield of 0.327 mWhr cm
−2. It can also be observed that during periods of higher light intensity, the n-i-p and p-i-n PSCs have similar performance, and it is only in the afternoon, when light intensity reduces, that the p-i-n cell performance begins to increase comparatively to the n-i-p cell, resulting in a higher energy yield for the p-i-n cell (0.139 mWhr cm
−2) compared to the n-i-p cell (0.114 mWhr cm
−2). The third scenario has the highest overall light intensity, and the greatest variance in light intensity and again the GaAs cell is the best performing at 1.25 mWhr cm
−2. The p-i-n cell has the second-best performance (0.92 mWhr cm
−2), despite the measurement showing a drop-out between 07:00 and 08:00. The drop-out in the measurement shows how susceptible lab-built cells can be to electrical stability in relation to MPPT measurement and unfortunately the measurement could not be repeated due to degradation of the p-i-n cell. The cause of the power drop-outs cannot be fully explained at present. They could be caused by environmental instability and the migration of mobile ions, giving rise to electrical instability. The P&O algorithm used by the MPPT to calculate the maximum power point does not cope well with the variable power output of PSCs and it could be that the drop-out is not as severe as the data suggests, but because the system could not obtain a stable measurement at that point in time it is recorded as zero. The n-i-p cell has an energy yield in scenario three of 0.49 mWhr cm
−2 and despite appearing to have a similar power output to the p-i-n cell earlier in the measurement, performs poorly in comparison later in the measurement so that the energy yield is significantly lower than the p-i-n cell. The reason for this is unclear but it may be due to degradation of the perovskite absorber layer.
The a-Si and cPSC cells have not so far been discussed in relation to the scenarios. Amorphous silicon solar cells are relatively cheap to produce and have been used in low power electronics such as pocket calculators for decades but are relatively inefficient at higher light intensities. It is encouraging to observe that in all cases, the energy yield of the p-i-n PSC is higher than the a-Si cell and at higher light intensities the n-i-p and the cPSCs also show better energy yields. cPSCs show better performance than the a-Si cells during I-V measurement at one-sun (
Table 1) and indeed in scenario three the PSC tested has a greater energy yield. However, in scenarios one and two which have on average lower light intensities the cPSC energy yields are lower than that of the a-Si. To explain why this might be the case the time dependant response of the cPSC I-V curve under 1000 lux is shown in
Figure 5 where it can be observed that it takes over 10 min of light soaking for the I-V curve to stabilise. We have previously attributed this slow light-soaking response to the link between surface recombination and ionic movement [
42] and propose that in realistic low-light scenarios, the fluctuations in light intensities mean that the cPSCs never reach a stabilised state and therefore never reach a point of optimised performance. The slightly higher light intensities experienced in scenario three create a greater driving force for ion reorganisation and hence stabilisation and so the cPSC outperforms a-Si once the light intensity is sufficient to stabilise the cPSC output.
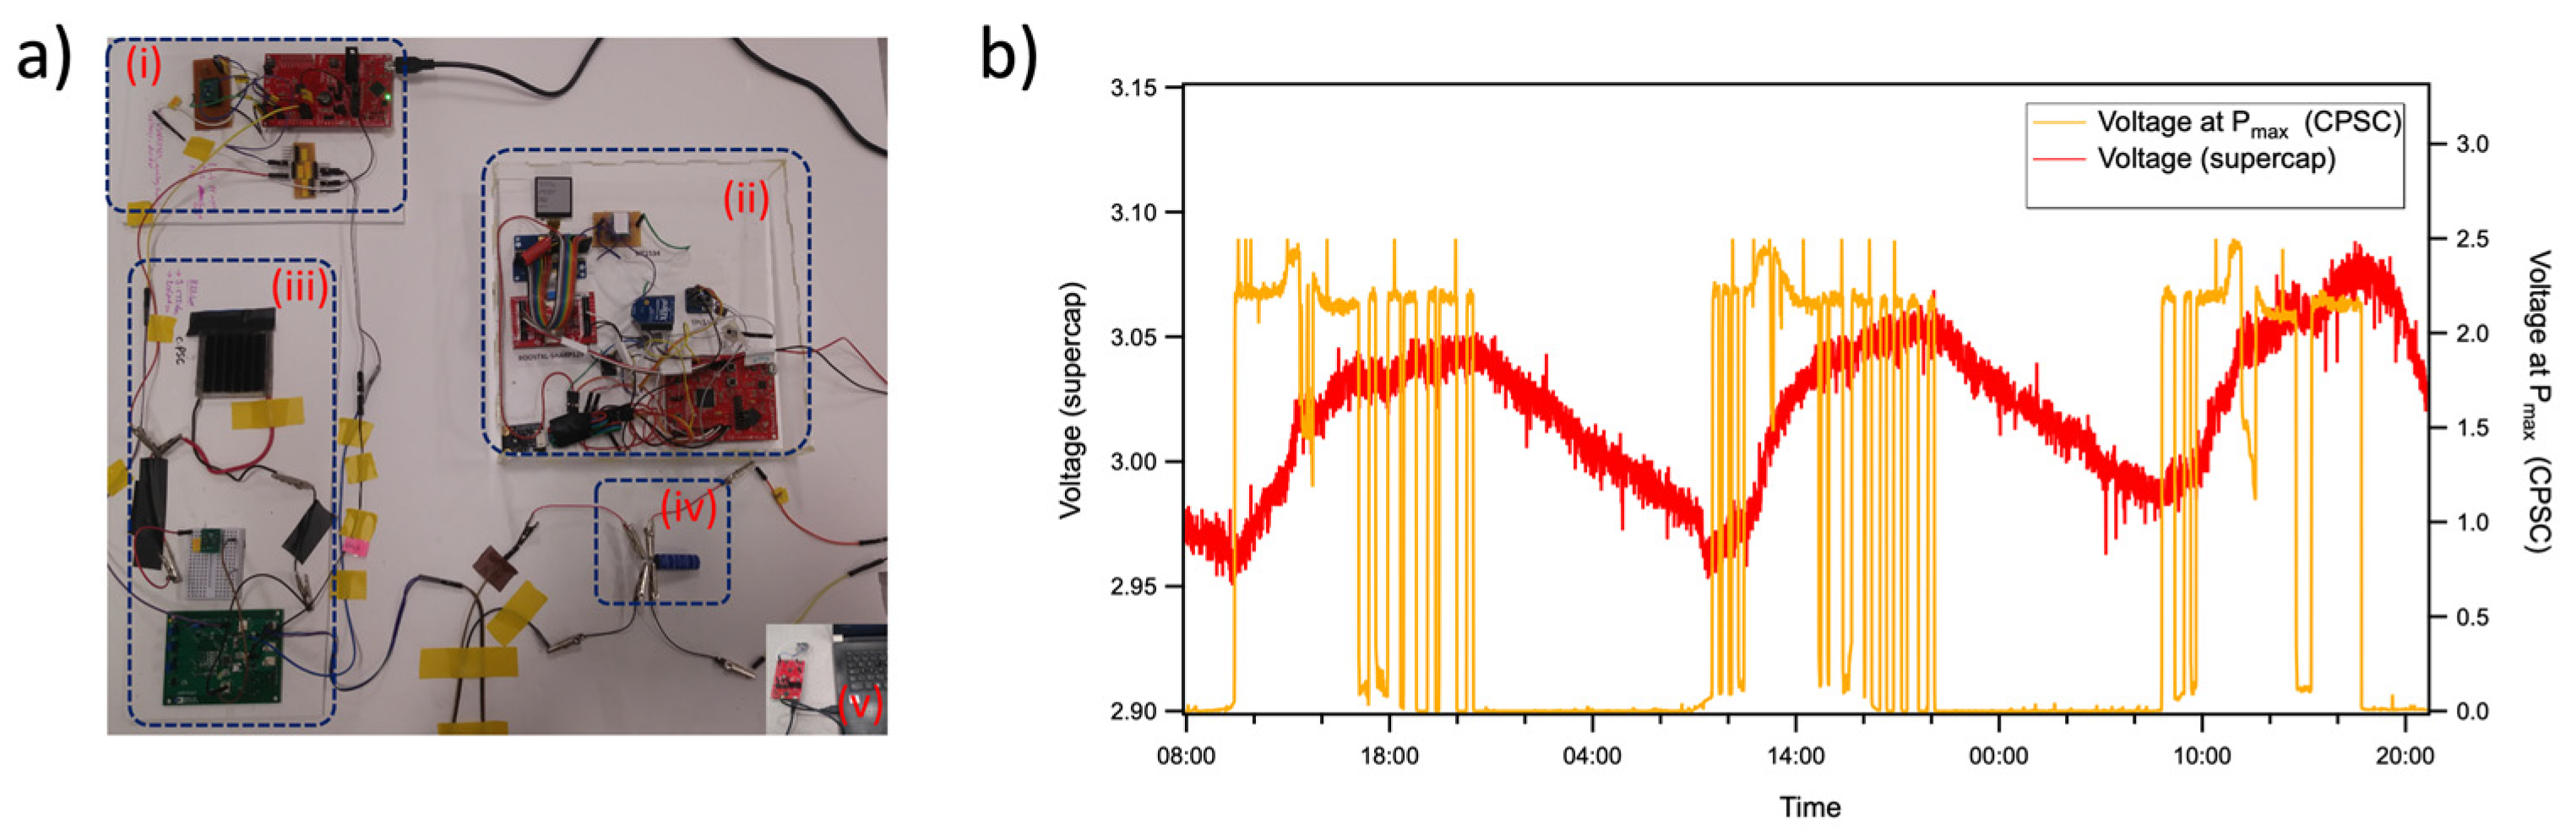
Despite the poorer performance in terms of energy yield, cPSC do have one advantage over the other thin-film PSCs. cPSCs are far more environmentally stable, generally operating for several months without significant degradation. Thin-film PSCs, despite their higher efficiencies, are prone to degrade rapidly if not appropriately encapsulated. It is for this reason that cPSCs were chosen to build our IoT demonstrator to evaluate cPSCs as energy harvester power sources for IoT devices. Our proof-of-concept IoT device measures room temperature (in °C) and atmospheric pressure (in mbar) every 20 min. The data obtained by the IoT device is then transmitted to a remote receiving station every 6.5 h. The sensors of the IoT device are connected to an ultra-low power micro-controller, which is powered by a supercapacitor (3 V, 10 F). The energy harvester, a cPSC mini module (6 cells connected in series, 1.95 cm
2), is used to charge the supercapacitor via an energy harvesting module. The system was placed in a laboratory where the average light intensity was 800 lux. The charging and discharging of the supercapacitor by the cPSC mini module were monitored over the course of three days. The results of which are shown in
Figure 6 despite the cPSC apparently dropping out periodically. It can be observed that the cPSC sufficiently recharges the supercapacitor after its discharge overnight, meaning that the IoT device is self-powering.
Using the data collected from our IoT device, we can it is possible to calculate the amount of charge (
Q) gained by the supercapacitor during the day vs. that lost during the night-time. From the logged data shown in
Figure 6, the minima and maxima supercapacitor voltages are as follows: 2.952, 3.052, 2.953, 3.069, 2.976, and 3.088 V. The capacitance (
C) of the supercapacitor is 10 F and so using
Q = CV, it is possible to calculate an average charge received (
Qday) of 1.094 coulombs vs. an average discharge (
Qnight) of 0.958 coulombs meaning that this device should be self-powering for as long as the conditions in the laboratory remained unchanged and as long as the cPSC lasts before degradation detriments performance.


 ,
, 


