


Remote Sens. 2024, 16(9), 1631; https://doi.org/10.3390/rs16091631 - 02 May 2024
Abstract
Urban artificial surfaces and structures induce modifications in land–atmosphere interactions, affecting the exchange of energy, momentum, and substances. These modifications stimulate urban climate formation by altering the values and dynamics of atmospheric parameters, including cloud-related features. This study evaluates the presence and quantifies
[...] Read more.
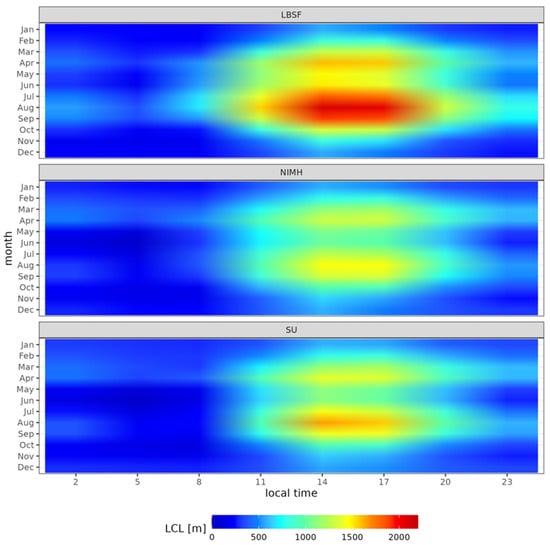
Urban artificial surfaces and structures induce modifications in land–atmosphere interactions, affecting the exchange of energy, momentum, and substances. These modifications stimulate urban climate formation by altering the values and dynamics of atmospheric parameters, including cloud-related features. This study evaluates the presence and quantifies the extent of such changes over Sofia, Bulgaria. The findings reveal that estimations of low-level cloud base height (CBH) derived from lifting condensation level (LCL) calculations may produce unexpected outcomes due to microclimate influence. Ceilometer data indicate that the CBH of low-level clouds over urban areas exceeds that of surrounding regions by approximately 200 m during warm months and afternoon hours. Moreover, urban clouds exhibit reduced persistence relative to rural counterparts, particularly pronounced in May, June, and July afternoons. Reanalysis-derived low-level cloud cover (LCC) shows no significant disparities between urban and rural areas, although increased LCC is observed above the western and northern city boundaries. Satellite-derived cloud products reveal that the optically thinnest low-level clouds over urban areas exhibit slightly higher cloud tops, but the optically thickest clouds are more prevalent during warm months. These findings suggest an influence of urbanization on cloudiness, albeit nuanced and potentially influenced by the city size and surrounding physical and geographical features.
Full article
(This article belongs to the Special Issue Selected Papers from the 5th International Electronic Conference on Remote Sensing)
►
Show Figures

Figure 1


